Blood Flow Measurement: Cardiac Output and Vascular Resistance
Mauro Moscucci
William Grossman
The maintenance of blood flow commensurate with the metabolic needs of the body is a fundamental requirement of human life. In the absence of major disease of the vascular tree (e.g., arterial obstruction), the maintenance of appropriate blood flow to the body depends largely on the heart’s ability to pump blood in the forward direction. The quantity of blood delivered to the systemic circulation per unit time is termed the cardiac output, generally expressed in liters per minute.
EXTRACTION RESERVE AND CARDIAC OUTPUT
The extraction of nutrients by metabolizing tissues is a function not only of the rate of delivery of those nutrients (the cardiac output) but also of the ability of each tissue to extract those nutrients from the circulation. Therefore, tissue viability can be maintained despite a fall in cardiac output as long as there is increased extraction of required nutrients. The extraction of a given nutrient (or of any substance) from the circulation by a particular tissue is expressed as the arteriovenous difference across that tissue, and the factor by which the arteriovenous difference can increase at constant flow (owing to changes in metabolic demand) may be termed the extraction reserve. For example, arterial blood in humans is normally 95% saturated with oxygen; that is, if 1 L of blood has the capacity to carry approximately 200 mL of oxygen when fully saturated, arterial blood will usually be found to contain 190 mL of oxygen per liter (190/200 = 95%). Venous blood returning from the body normally has an average oxygen saturation of 75%; that is, mixed venous blood generally contains 150 mL of oxygen per liter of blood (150/200 = 75%). Thus the normal arteriovenous difference for oxygen is 40 mL/L (190 – 150 mL/L).
The normal extraction reserve for oxygen is 3, which means that under extreme metabolic demand, the body’s tissues can extract up to 120 mL of oxygen (3 × 40 mL) from each liter of blood delivered.1 Thus if arterial saturation remains constant at 95%, full use of the extraction reserve will result in a mixed venous oxygen content of 70 mL/L (190 – 120 mL/L) or a mixed venous oxygen saturation of 35% (70/200 = 35%). This is essentially the value found for mixed venous (i.e., pulmonary artery) oxygen saturation in normal men studied at maximal exercise. The relation between cardiac output and arteriovenous O2 difference is illustrated in Figure 11.1.
Lower Limit of Cardiac Output
The value of 3 for the oxygen extraction reserve predicts that in progressive cardiac decompensation, meeting the basal oxygen requirements of the body demands that oxygen extraction increase as cardiac output falls until the arteriovenous oxygen difference has tripled and cardiac output has fallen to one-third of its normal value (Figure 11.1). Because the extraction reserve has now been used fully, any further reduction of cardiac output will result in tissue hypoxia, anaerobic metabolism, acidosis, and eventually, circulatory collapse. This prediction appears to be quite accurate; clinical investigators have observed for many years that a fall in resting cardiac output to below one-third of normal (i.e., a cardiac index of ≤1.0 L/minute per m2) is incompatible with life.
Upper Limit of Cardiac Output
Several studies have indicated that the largest increase in cardiac output that can be achieved by a trained athlete at maximal exercise is 600% of the resting output. If a normal 70 kg man has a cardiac output of 5 L/minute or 3.0 L/minute
per m2, his maximal cardiac output might be as high as 30 L/minute (18 L/minute per m2). Because cardiac output increases by approximately 600 mL for each 100 mL increase in oxygen requirements of the body, an increase in cardiac output of 25 L/minute with maximal exercise would suggest an increase in total-body oxygen requirements of 4,167 mL/minute, which is approximately an 18-fold increase over the normal resting value of 250 mL/minute. The 18-fold increase in total-body oxygen requirements is met by the combined sixfold increase in oxygen delivery (i.e., cardiac output) and threefold increase in oxygen extraction (extraction reserve). These relations are illustrated in Figure 11.1.
per m2, his maximal cardiac output might be as high as 30 L/minute (18 L/minute per m2). Because cardiac output increases by approximately 600 mL for each 100 mL increase in oxygen requirements of the body, an increase in cardiac output of 25 L/minute with maximal exercise would suggest an increase in total-body oxygen requirements of 4,167 mL/minute, which is approximately an 18-fold increase over the normal resting value of 250 mL/minute. The 18-fold increase in total-body oxygen requirements is met by the combined sixfold increase in oxygen delivery (i.e., cardiac output) and threefold increase in oxygen extraction (extraction reserve). These relations are illustrated in Figure 11.1.
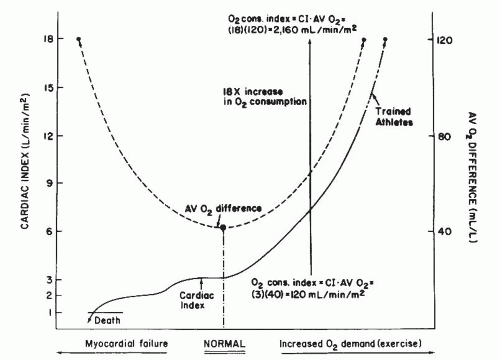 Figure 11.1 Relationship between arteriovenous oxygen (AV O2) difference (broken line) and cardiac index (solid curve) in normal subjects at rest (center) and during exercise (right), and in the patient with progressively worsening myocardial failure (left). (See text for discussion.) |
Factors Influencing Cardiac Output in Normal Subjects
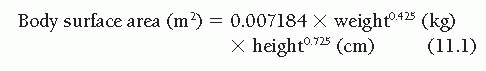
The range of the “normal” cardiac output is difficult to define with precision because it is influenced by several variables. Obviously, body size is important, and the ranges of normal values of cardiac output for 2-year-old children, 10-yearold children, and 50-year-old men are so different that they show only minimal overlap. For this reason, normalization of the cardiac output for differing body size is considered fundamental by all students of this subject, although there is disagreement about the best way to accomplish this normalization. Because cardiac output seems to be predominantly a function of the body’s oxygen consumption or metabolic rate1,2 and because metabolic rate is thought to correlate best with body surface area,3,4 it has become customary to express cardiac output in terms of the cardiac index ([liters/minute]/[body surface area, m2]). Body surface area is not measured directly, but is instead calculated from one of the experimentally developed formulas, such as that of Dubois.4
Despite the shortcomings and weaknesses of this approach to normalization of the cardiac output,1,5 the method has gained nearly universal acceptance by clinicians over the past 40 years and will be used throughout this book. The availability of automatic calculators, which are now incorporated in modern hemodynamic equipment, has facilitated accurate calculation of normalized data and incorporation of these data in standard reporting.
Although expression of cardiac output as the cardiac index narrows to a great extent the range of normal values among our groups of 2-year-old children, 10-year-old children, and 50-yearold men, it does not completely abolish the differences in these ranges. In fact, the normal cardiac output appears to vary with age, steadily decreasing from approximately 4.5 L/minute per m2 at age 7 years to 2.5 L/minute per m2 at age 70 years.1,6 This is not surprising, because it is well known that the body’s metabolic rate is affected to a great extent by age, being the highest in childhood and progressively diminishing with age.
In addition to age, cardiac output is affected by posture, decreasing by approximately 10% when a person rises from a lying to a sitting position and by approximately 20% when a person rises (or is tilted) from a lying to a standing position. Also, body temperature, anxiety, environmental heat and humidity, and a host of other factors influence the normal resting cardiac output,1 and these must be considered in interpreting any value of cardiac output measured in the clinical setting.
TECHNIQUES FOR DETERMINATION OF CARDIAC OUTPUT
Of the numerous techniques devised over the years to measure cardiac output, two have won general acceptance in cardiac catheterization laboratories: the Fick oxygen technique and the indicator dilution technique. Both techniques are similar in that they are based on the theoretical principle enunciated by Adolph Fick7 in 1870. The principle, which was never actually applied by Fick and was first used by O’Klein in Prague to measure cardiac output in men, states that the total uptake or release of any substance by an organ is the product of blood flow to the organ and the arteriovenous concentration difference of the substance. For the lungs, the substance released to the blood is oxygen, and the pulmonary blood flow can be determined by knowing the arteriovenous difference of oxygen across the lungs and the oxygen consumption per minute.
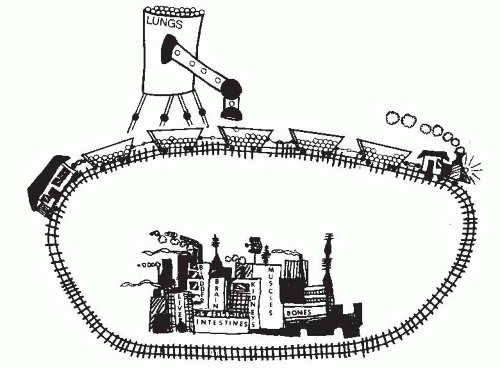 Figure 11.2 Illustration of Fick’s principle. A train, representing the circulation, passes by a hopper (the lungs) that delivers marbles (oxygen) to the train’s boxcars at a rate of 20 marbles per minute. Because the boxcars each contains 16 marbles before and 20 marbles after passing under the hopper, each boxcar is picking up 4 marbles and must be taking only 0.20 minute to pass under the hopper, since it would pick up 20 marbles in each full minute under the hopper. If each boxcar takes only 0.20 minute to pass by the hopper, the train is moving at a speed sufficient to deliver 5 boxcars per minute to any point down the line. This could have been calculated as Train’s speed (boxcars/minute) = marble delivery rate (marbles/minute) “AV” marble difference (marbles/boxcar) = (20 marbles/minute) (4 marbles/boxcar) = 5 boxcars/minute If one boxcar is 1 L of blood and each marble is 10 mL of oxygen, then we have an arteriovenous oxygen difference of 40 mL/L, an O2 consumption of 200 mL/minute, and a cardiac output of 5 L/minute. (Illustration kindly provided by Jennifer Grossman, age 11 years.) |
Fick’s principle is illustrated in Figure 11.2. In this figure, a train is passing by a hopper that is delivering marbles to the boxcars at a rate of 20 marbles per minute. If the boxcars each contains 16 marbles before passing under the
hopper and 20 marbles after passing under the hopper, each boxcar is picking up four marbles and must be taking only 0.20 minute to pass under the hopper, because it would pick up 20 marbles in each full minute under the hopper. If each boxcar takes 0.20 minute to pass by the hopper, the train is moving at a speed sufficient to deliver five boxcars per minute to any point down the line. This could have been calculated as shown in Figure 11.2:
hopper and 20 marbles after passing under the hopper, each boxcar is picking up four marbles and must be taking only 0.20 minute to pass under the hopper, because it would pick up 20 marbles in each full minute under the hopper. If each boxcar takes 0.20 minute to pass by the hopper, the train is moving at a speed sufficient to deliver five boxcars per minute to any point down the line. This could have been calculated as shown in Figure 11.2:
Train’s speed (boxcars/minute)
= marble delivery rate (marbles/minute)
÷ “AV” marble difference (marbles/boxcar)
= (20 marbles/minute)/(4 marbles/boxcar)
= 5 boxcars/minute
If one boxcar represents 1 L of blood and each marble represents 10 mL of oxygen, then we have an arteriovenous O2 difference of 40 mL/L, an oxygen consumption of 200 mL/minute, and a cardiac output of 5 L/minute.
Fick Oxygen Method
In the Fick oxygen method, pulmonary blood flow should be determined ideally by measuring the arteriovenous difference of oxygen across the lungs and the rate of oxygen uptake by blood from the lungs. If there is no intracardiac shunt and pulmonary blood flow is equal to systemic blood flow, the Fick oxygen method also measures systemic blood flow. Thus, cardiac output equals oxygen consumption divided by arteriovenous oxygen difference.
In actual practice, the rate at which oxygen is taken up from the lungs by blood is not measured, but rather the uptake of oxygen from room air by the lungs is measured, because at steady state these two measurements are equal. Furthermore, arteriovenous oxygen difference across the lungs is not measured directly. Generally, pulmonary arterial blood (true mixed venous blood) is sampled, but pulmonary venous blood is not sampled. Instead, left ventricular or systemic arterial blood is sampled and assumed to have an oxygen content representative of mixed pulmonary venous blood. Actually, because of bronchial venous and thebesian venous drainage, the oxygen content of systemic arterial blood is commonly 2 to 5 mL/L of blood lower than that of pulmonary venous blood as it leaves the alveoli.
Oxygen Consumption
Methods for measurement of oxygen consumption have included the Douglas bag method, the polarographic method, and the paramagnetic method. The instruments described in previous editions of this book are no longer available, and today, direct measurements of oxygen consumption are rarely obtained in the cardiac catheterization lab. However, a description of each method and older instruments is still useful for understanding the challenges in obtaining accurate measurements and how the systems have evolved. The older Douglas bag method required the standard procedure of collecting expired air for 3 minutes in a Douglas bag and measuring its volume (Tissot spirometer) and oxygen content. Interested readers are referred to earlier editions of this book for further details.
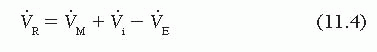
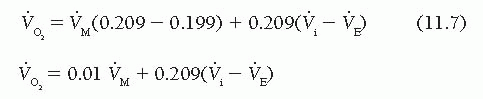
The metabolic rate meter (MRM) polarographic instrument (formerly manufactured by Waters Instruments, Rochester, MN) includes a polarographic oxygen sensor cell (gold and silver/silver chloride electrodes), a hood or face mask, and a blower of variable speed connected to a servo control loop with the oxygen sensor (Figure 11.3). The principle of operation involves using a variable-speed blower to maintain a unidirectional flow of air from the room through the hood and via a connecting hose to the polarographic oxygensensing cell. As illustrated in Figure 11.3, room air enters the hood at a rate [V with dot above]R (mL/minute), which is determined by the blower’s discharge rate [V with dot above]M (mL/minute) and the patient’s ventilatory rate ([V with dot above]i, inhaled air in mL/minute; [V with dot above]E, exhaled air). The blower speed [V with dot above]M is controlled by a servo loop designed to maintain the oxygen content of the air flowing past the polarographic cell constant at a predetermined value. In a steady state, the average value of [V with dot above]M together with the oxygen content of room air and of the air flowing past the polarographic cell can be used to calculate the patient’s oxygen consumption, as follows:
The patient’s oxygen consumption  is given by
is given bywhere FRO2 and FMO2 are the fractional contents of oxygen in room air and in the air flowing past the polarographic cell, respectively.
As can be seen from Figure 11.3,
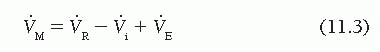
which can be rewritten as
Substituting this in Eq. (11.2) gives
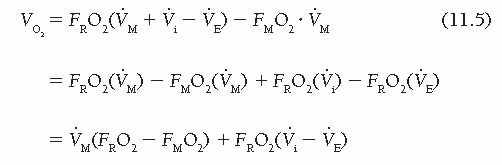
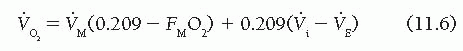
Because the fractional content of oxygen in room air (FRO2) is 0.209, oxygen consumption is given by
Thus in a steady state (where [V with dot above]i − [V with dot above]E is constant), oxygen consumption can be determined by measuring the volume rate of air moved by the blower motor ([V with dot above]M) and the fractional oxygen content of air moving past the polarographic sensor. In the MRM, a servo-controlled system adjusts [V with dot above]M to keep
FMO2 at a constant predetermined value. In practice, FMO2 is set at 0.199 so that Eq. (11.6) becomes
FMO2 at a constant predetermined value. In practice, FMO2 is set at 0.199 so that Eq. (11.6) becomes
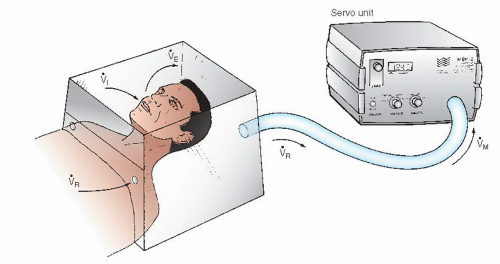 Figure 11.3 Measurement of O2 consumption by a polarographic cell technique using the Waters Instruments metabolic rate meter (MRM). A transparent hood fits snugly over the patient’s head, resting on a pillow. Air enters the hood through holes in a plastic sheet at a flow rate of [V with dot above]R The patient’s inspiratory flow rate ([V with dot above]i) subtracts from and expiratory flow rate ([V with dot above]E) adds to [V with dot above]R to yield [V with dot above]M, the flow rate leaving the hood and entering the servo unit. A blower motor in the servo unit adjusts [V with dot above]M to keep the O2 sensed by a polarographic cell constant. (See text for details.) |
For practical purposes, the respiratory quotient (RQ) is assumed to be 1.0; accordingly, [V with dot above]i = [V with dot above]E and  = 0.01 [V with dot above]M. If the RQ is actually 0.9 (e.g., the patient releases 0.9 L of CO2 for each liter of O2 consumed), the error in
  resulting from the assumption of an RQ of 1.0 is 1.6%, and if RQ is 0.8, the error is 3.2%.
= 0.01 [V with dot above]M. If the RQ is actually 0.9 (e.g., the patient releases 0.9 L of CO2 for each liter of O2 consumed), the error in resulting from the assumption of an RQ of 1.0 is 1.6%, and if RQ is 0.8, the error is 3.2%.This device was a significant advance over the Douglas bag method. A study by Lange et al.,8 however, found that values of oxygen consumption measured by metabolic rate meter (MRM-2, Waters Instruments, Rochester, MN) were significantly lower than those measured using the standard Douglas bag technique, mentioned previously.
The SensorMedics Deltatrac II (also no longer available) differed from the Waters Instruments MRM device in several aspects. First, it was more sophisticated than the MRM and directly measured the fractional content of oxygen as well as the concentration of carbon dioxide in expired flow, and thus calculated the RQ of each patient. The SensorMedics device was calibrated prior to each period of use with a cylinder containing a test gas of 95% oxygen and 5% carbon dioxide. It used a constant flow rate [V with dot above]M leaving the canopy or hood and entering the metabolic monitor unit. The sensors in this unit measured oxygen (paramagnetic sensor) and carbon dioxide (infrared sensor) content, and the unit adjusted for temperature and the partial pressure of water vapor, expressing O2 consumption and CO2 production at standard temperature and pressure, and dry (STPD; dry gas at 0°C and 760 mmHg). There are several newer systems currently available for metabolic testing and  measurements. They are generally portable; they tend to be easier to use; and they can be employed in the cardiac catheterization suite for measuring
  at rest and during exercise. A description of each system and brand is beyond the scope of this chapter.
measurements. They are generally portable; they tend to be easier to use; and they can be employed in the cardiac catheterization suite for measuring at rest and during exercise. A description of each system and brand is beyond the scope of this chapter.Arteriovenous Oxygen Difference
The arteriovenous oxygen difference across the lungs must be measured to calculate cardiac output by Fick’s principle, and this can be accomplished by the following method. From appropriately positioned catheters, systemic arterial and mixed venous (pulmonary arterial) blood samples are obtained during the period when O2 consumption is being measured. The samples are drawn into heparinized syringes and capped quickly. If the patient has received heparin systemically, the syringes used for collection of these blood samples need not be heparinized. Also, if the samples will be analyzed immediately by oximetry, plastic syringes may be used. It should be noted that O2 may diffuse through the walls of plastic syringes. However, in a laboratory test (William Grossman’s laboratory), no appreciable increase in O2 saturation of venous blood could be detected over 2 hours (a capped plastic 15 mL syringe filled with venous blood sitting at room temperature was sampled every 15 minutes for oximetry). The samples should be drawn
simultaneously and as close to the midpoint of the oxygen consumption determination period as possible. Care must be taken to avoid contamination of the blood samples with air bubbles.
simultaneously and as close to the midpoint of the oxygen consumption determination period as possible. Care must be taken to avoid contamination of the blood samples with air bubbles.
Oxygen content (in milliliters of oxygen per liter of blood) can be determined by a variety of methods, the most classic of which (and the one that serves as a standard for all others) being the manometric technique of Van Slyke and Neill.9 The major drawback of the Van Slyke and Neill technique is that 15 to 30 minutes are required to run a single blood sample. The different devices for oximetry measurement have been studied and compared by Shepherd and McMahan.9 The older Van Slyke methodology is rarely used today, and the Lex-O2-Con fuel cell technique is no longer available. Devices in widespread use today are of the co-oximeter class and either hemolyze the blood sample (by ultrasonic or chemical techniques) or use whole blood; both types of co-oximeter depend on spectrophotometric measurement of the percent oxygen saturation of hemoglobin. Using these devices, oximetry of heparinized blood samples is simple and quick, and measures the percentage of hemoglobin present as oxyhemoglobin. This percentage, multiplied by the theoretical oxygencarrying capacity of the patient’s blood, yields the calculated oxygen content of that sample (Figure 11.4). A formula for approximating the theoretical oxygen-carrying capacity in humans is
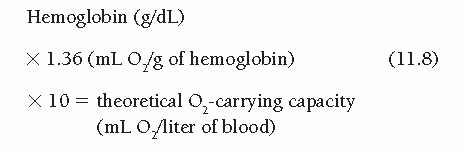
In several textbooks the constant is given as 1.34, but studies on crystalline human hemoglobin suggest that the correct number may be 1.36.10,11 Whatever is its correct value, the formula is only an approximation. The steps of Figure 11.4 may be used to calculate oxygen content of blood samples and arteriovenous oxygen difference when the spectrophotometric oximeter method is used. Oxygen contents of arterial and mixed venous blood samples are calculated as the percentage of oxyhemoglobin saturation of these samples multiplied by the oxygen-carrying capacity (steps 2 to 5, Figure 11.4). Oxygen consumption (determined as described earlier) may then be divided by the arteriovenous oxygen difference (step 3 minus step 5, Figure 11.4) to yield the cardiac output. Current oximeters, such as the AVOXimeter 1000 or 4000 (A-VOX Systems, Inc. San Antonio, Texas USA), illuminate a very small sample of heparinized blood (volume, 50 µL) with light of multiple wavelengths and record the optical density of each transmitted wavelength. This approach allows estimation of total hemoglobin concentration as well as the concentrations of its various components: oxyhemoglobin, methemoglobin, and carboxyhemoglobin. This permits instantaneous calculation of oxygen content, which is displayed on the oximeter’s liquid crystal display screen. This value can then be entered directly in steps 3, 5, and 6 of Figure 11.4. The complete formula for calculation of cardiac output using the Fick’s method is shown in Figure 11.5.
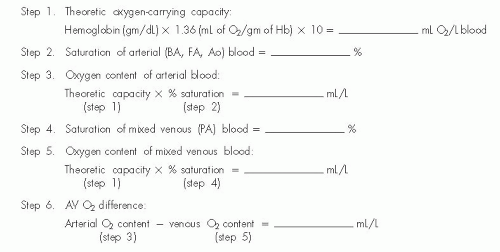 Figure 11.4 Calculation of oxygen content and AV oxygen difference when using the reflectance oximetry method. |
Arterial blood may be taken from a systemic artery, the left ventricle, the left atrium, or the pulmonary veins. Theoretically, pulmonary venous blood is preferable to peripheral arterial blood for the arteriovenous oxygen difference calculations. However, except in the presence of a right-to-left intracardiac shunt, pulmonary venous oxygen content may be approximated by systemic arterial oxygen content, ignoring the small amount of venous admixture resulting from bronchial and thebesian venous drainage. If arterial desaturation (e.g., arterial blood oxygen saturation <95%) is present, a central right-to-left shunt should be excluded before accepting systemic arterial oxygen content as representative
of pulmonary venous blood. Techniques for detecting and quantifying such shunts are described in Chapter 12.
of pulmonary venous blood. Techniques for detecting and quantifying such shunts are described in Chapter 12.
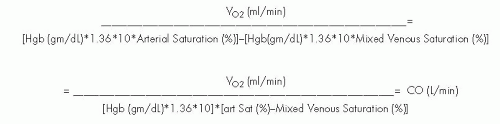 Figure 11.5 Calculation of cardiac output using the Fick oxygen method. |
The most reliable site for obtaining mixed venous blood is the pulmonary artery. Because of streaming and incomplete mixing, using the blood from more proximal sites such as the right atrium or vena cavae as representative of mixed venous blood is much less accurate.12,13 Right ventricular blood is closer to true mixed venous blood and may be substituted for pulmonary arterial blood if necessary.
Sources of Error
The techniques described for cardiac output measurement by application of Fick’s principle assume that a steady state exists (i.e., that the cardiac output and oxygen consumption are constant during the period of measurement). Therefore strict quiet, calm, and decorum must be maintained in the cardiac catheterization laboratory during this time to encourage the achievement of a steady state condition. Potential errors in the determination of cardiac output by the Fick oxygen technique may come from a number of sources.
Stay updated, free articles. Join our Telegram channel

Full access? Get Clinical Tree


