Chapter 2 Principles of Myocardial Metabolism as They Relate to Imaging
INTRODUCTION
The metabolic cost on the heart of maintaining an adequate cardiac output is extremely high. Based on measurements of myocardial oxygen consumption1 and the degree of coupling between oxygen consumption and mitochondrial adenosine triphosphate (ATP) synthesis,2 the heart of a 70-kg individual would produce (and consume) 4.6 kg of ATP per day. As a result, the total content of ATP in the heart turns over approximately 8 times per minute to meet this high rate of flux. While the majority of this ATP expenditure is utilized for contractile activity, ATP is also required for maintaining cellular ionic homeostasis and supporting protein synthesis.
OVERVIEW OF METABOLIC REGULATION IN THE NORMAL HEART
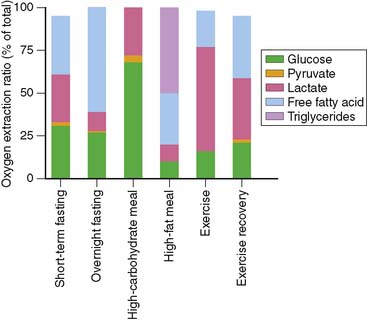
To understand the merits and drawbacks of various metabolic radiotracers, it is important to understand how cardiac metabolism is regulated. As noted above, the heart is an “omnivore,” synthesizing ATP through the metabolism of a variety of fuel substrates.3 Furthermore, the relative contribution of the different substrates varies, and the heart must adapt rapidly to changing sources of substrate. A good example of this plasticity of substrate selection by the heart is reflected in the changes that occur during different physiologic states based on nutritional status and degree of physical activity (Fig. 2-1). The relative contribution of a given substrate to myocardial ATP production is dependent on a variety of selection pressures, including the arterial concentration of the substrate, the availability of oxygen, hormonal stimulation, the workload imposed upon the heart, and the presence of pathologic conditions that affect myocardial utilization of substrates (e.g., coronary artery disease, heart failure, diabetes) through changes in the cardiac myocyte’s expression of regulatory proteins and enzymes.
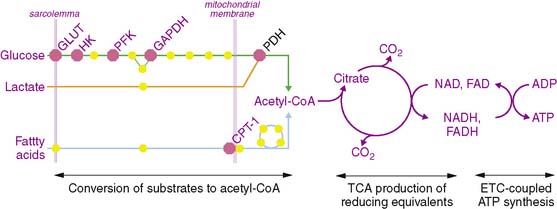
The metabolism of the primary fuels in the heart is graphically depicted in Fig. 2-2 and illustrates three major phases of metabolism. The first phase is involved in converting fatty acids, glucose, and lactate into a common substrate for entry into the tricarboxylic acid (TCA) cycle in the mitochondria. In the second phase, reducing equivalents in the form of reduced nicotinamide adenine dinucleotide (NADH2) and reduced flavin adenine dinucleotide (FADH2) are produced in the TCA cycle and provide electrons for the electron transport chain that ultimately are used to convert oxygen to water. In the third phase, a proton gradient across the inner mitochondrial membrane, which is generated by the proteins of the electron transport chain, drives ATP synthesis.
Fatty Acid Metabolism
Under normal conditions, fatty acids and triglycerides are the preferred substrate for the normal heart. Fatty acids are taken up by the cardiac myocyte through facilitative transport via fatty acid translocase (FAT/CD36).4 Once inside the myocyte, fatty acids are esterified to fatty acyl-CoA derivatives through a reaction mediated by fatty acyl-CoA synthetase, which utilizes the hydrolysis of ATP to adenosine monophosphate (AMP) to drive the reaction. This energy-requiring step may be of great importance in understanding the decrease in accumulation of the fatty acid analog, [123I]β-methyl-iodophenyl pentadecanoic acid (BMIPP), seen in ischemic myocardium. After this activation, fatty acyl-CoA may be transported into the mitochondria following transesterification with carnitine by carnitine palmitoyltransferase 1 (CPT-1). This step represents the rate-limiting step of fatty acid oxidation and is regulated by cytosolic concentrations of malonyl-CoA; this important regulatory step of fatty acid metabolism is discussed in detail later in the chapter. Once inside the mitochondria, CPT-2 converts the fatty acylcarnitine back into fatty acyl-CoA for entry into the β-oxidation pathway. Another metabolic fate of the cytosolic fatty acyl-CoA is incorporation into triglycerides. It is this fate that predominates for BMIPP because the β-methyl group inhibits it entry into β-oxidation in the mitochondria.5
Glucose Metabolism
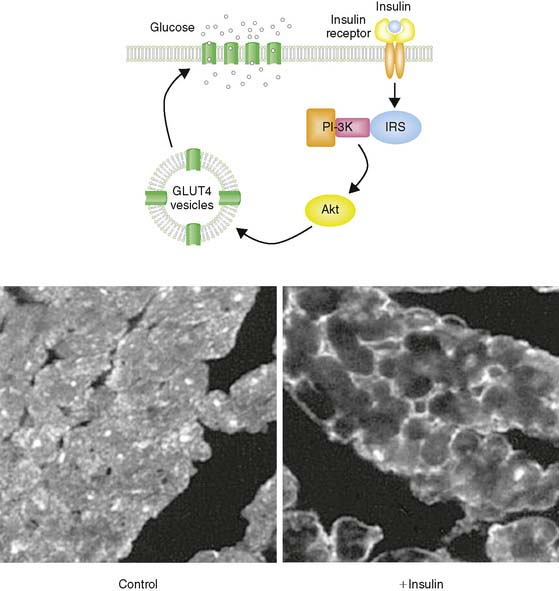
Glucose represents the other major fuel of the heart. The initial transport of glucose across the cell surface membrane represents the rate-limiting step of glucose metabolism and is mediated by facilitative glucose transporters (GLUTs).6 Of the 13 described GLUTs, only two, GLUT1 and GLUT4, are expressed to a significant degree in the heart. GLUT1 is present mostly on the cardiomyocyte cell surface and is responsible for basal glucose uptake. In contrast, GLUT4 exists both on the cell surface and in an intracellular pool of membrane vesicles that can translocate to the cell surface in response to insulin (Fig. 2-3). It is therefore GLUT4 translocation that is responsible for insulin-stimulated glucose uptake in the insulin-sensitive tissues of the heart, skeletal muscle, and adipose tissue. The translocation of GLUT4 is also responsible for the enhanced glycolysis observed during ischemia, although the mechanism of this translocation is independent of the insulin signaling pathway as described later in this chapter.7–9
PFK-1 is also inhibited by citrate, which increases when there is sufficient TCA cycle flux to meet the energetic needs of the cell. This inhibition of glycolysis at the level of PFK-1 by ATP and citrate is the basis of a critical aspect of myocardial metabolism that regulates substrate selection: the glucose/fatty acid, or Randle, cycle. The oxidation of fatty acids in the mitochondria results in an increase in both ATP and citrate, which inhibits PFK-1 and thereby reduces glucose uptake.10 The operation of the Randle cycle has important implications with respect to myocardial substrate utilization under physiologic conditions such as the transition from the postprandial state, in which insulin stimulation and abundant circulating glucose lead to increased reliance on glucose, to the fasting state, in which the greater concentration of free fatty acids increases fatty acid metabolism, and disease states such as diabetes, in which there is a persistent increase in the free fatty acid concentration.
Once glucose is metabolized to pyruvate, it is transported into the mitochondria, where it is converted to acetyl-CoA through the action of pyruvate dehydrogenase (PDH). PDH is a multienzyme complex that is regulated by the metabolic status of the cell. Specifically, PDH is inhibited by increased [NADH2]/[NAD] and [acetyl-CoA]/[CoASH] ratios, both of which occur when there is a relative overabundance of NADH2 and acetyl-CoA that outstrips the ability of the mitochondria to utilize these metabolites.11 This regulation of PDH activity is mediated by PDH kinase, which phosphorylates and thereby inactivates the PDH complex. In the setting of enhanced fatty acid oxidation, flux through PDH is inhibited by increased PDH kinase activity,12 providing another level of regulation of substrate selection in the heart. Conversely, PDH activity can be increased by dephosphorylation, which occurs in response to insulin stimulation.13 In addition, PDH can be activated by increases in workload through a calcium-dependent mechanism.
Tricarboxylic Acid Cycle Metabolism and the Electron Transport Chain
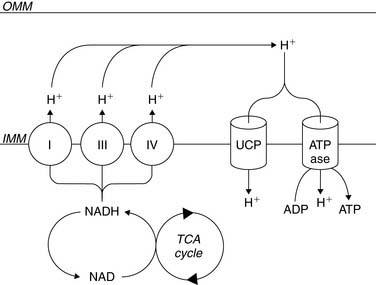
β-Oxidation of fatty acids, glycolysis of both exogenous glucose and endogenous glycogen, and uptake of exogenous lactate result in the conversion of these fuels to a common energetic currency, namely acetyl-CoA, which enters the TCA cycle by condensing with oxaloacetate to form citrate. The citrate that is formed undergoes subsequent oxidative and decarboxylating reactions in the TCA cycle, which results in the generation of five important compounds that not only help to drive mitochondrial ATP synthesis but are also important with respect to metabolic imaging. The first is the ultimate conversion of the 6-carbon citrate to the 4-carbon oxaloacetate, which is then available for another “turn” of the TCA. This is linked to the second important product, carbon dioxide (CO2), which is produced through two decarboxylation steps, one mediated by isocitrate dehydrogenase and the other mediated by α-ketoglutarate dehydrogenase. This CO2 is released from the cell and ultimately leaves the body through the lungs. The third is the production of NADH2 by isocitrate dehydrogenase, α-ketoglutarate dehydrogenase, and malate dehydrogenase. This NADH2 is used by the electron transport chain to generate the mitochondrial membrane potential required to power the mitochondrial F0F1-ATPase that converts ADP to ATP (Fig. 2-4). In addition, FADH2 is produced by succinate dehydrogenase and also contributes electrons to the electron transport chain for the conversion of oxygen to water, but because of the location of succinate dehydrogenase in the inner aspect of the inner mitochondrial membrane, it does not contribute to the mitochondrial membrane potential. Finally, the high-energy phosphate, guanosine triphosphate (GTP), is generated through substrate-level phosphorylation by succinyl-CoA synthetase, a reaction that becomes important to energy production during ischemia because, like glycolysis, it does not require oxygen to produce high-energy phosphates.14
Of great importance to the evaluation of myocardial mitochondrial function by nuclear methods is the fact that there is a direct relationship between the entry of acetyl-CoA into the tricarboxylic acid cycle and the conversion of oxygen to water through the electron transport chain. Because of this coupling of acetyl-CoA metabolism to oxygen consumption, it is possible to determine rates of myocardial oxygen consumption noninvasively using the positron emission tomography (PET) tracer [1-11C]-acetate.15 Furthermore, a coupling between energy demand and energy production translates to the coupling of TCA flux to ATP synthesis. Specifically, increases in workload result in an increase in cytosolic calcium; this increased cytosolic calcium concentration increases mitochondrial calcium content, which activates not only PDH but the calcium-dependent enzymes, isocitrate dehydrogenase and α-ketoglutarate dehydrogenase, that are part of the TCA cycle.
METABOLIC TRACERS
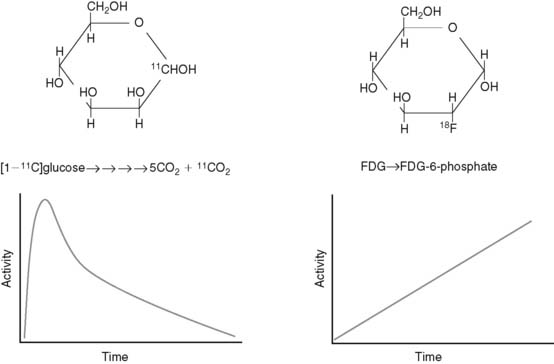
Radiotracers of metabolic pathways fall into two categories: those that are radioisotopes of the parent compound (e.g., [1-11C]glucose and [1-11C]palmitate) or those that are analogs of the parent compound (e.g., [2-18F]-2-fluoro-2-deoxyglucose [FDG] and BMIPP). The quantitative evaluation of metabolic pathways generally utilizes the former tracers because they follow the same metabolic fate of the parent compound, whereas the latter compounds are utilized for qualitative assessments of metabolism because they generally are retained by the tissue, making imaging easier. For example, because the PET tracer [1-11C]glucose is biochemically indistinguishable from glucose, it will follow the exact fate of glucose, including the eventual release from the cardiomyocyte as 11CO2. As a result, there is uptake, retention, and ultimately disappearance of radiotracer from the heart (Fig. 2-5). In contrast, FDG is taken up and phosphorylated by hexokinase, but it is not further metabolized in the cardiomyocyte because of the modification of the carbohydrate structure from glucose to deoxyglucose. As a result, FDG becomes trapped in the cell. Kinetic analysis of the time activity curves for FDG can be used to estimate the initial uptake and phosphorylation of glucose,16,17 but it offers no information about the oxidative fate of glucose.
Although the kinetic analysis of a tracer such as FDG that demonstrates irreversible trapping would appear to be more straightforward than the analysis required for tracers that demonstrate accumulation and disappearance, there are two issues that must be kept in mind in translating information gained from irreversibly trapped radiotracers to conclusions about myocardial substrate utilization. First, as demonstrated earlier, these tracers only provide information about a portion of a given metabolic pathway. Second, differences in the structure of the parent compound and the radiotracer will alter the fidelity with which the tracer measures utilization of the parent compound, and this relationship between tracer and tracee can vary under different metabolic conditions.18
In addition to categorizing metabolic radiotracers based on their ability to trace metabolic pathways accurately and completely, they can also be grouped according to whether they are single photon–emitting or positron-emitting radiotracers (Table 2-1
Stay updated, free articles. Join our Telegram channel

Full access? Get Clinical Tree


