Principles and Techniques of Cardiac Catheter Mapping

Chapter 23 Principles and Techniques of Cardiac Catheter Mapping


Mapping as Process


Intracardiac mapping refers to sampling of endocardial myocardial potentials for substrate analysis and arrhythmia diagnosis. Potentials are recorded by percutaneously introduced intracardiac electrode catheters, and their signal characteristics are evaluated in the context of the recording site and the underlying rhythm to deduce the putative arrhythmia mechanism and associated sites of involvement. Data may be collected using contact mapping in either a point-by-point and beat-by-beat manner, which requires both sustained arrhythmia and local contact between the recording electrode and myocardial surface, or through noncontact mapping that extrapolates global activation during isolated arrhythmia beats and do not require sustained arrhythmia or direct myocardial contact.


Contact catheter mapping techniques have been employed extensively for more than half a century and form the basis of all current mapping strategies. Mapping is often performed during the rhythm of interest—largely tachycardias of both supraventricular and ventricular origins. However, the arrhythmia cannot be directly evaluated in some because of hemodynamic intolerance or noninducibility or because the evaluation requires adjunctive data. In such cases, substrate mapping is performed during sinus rhythm or pacing to evaluate myocardial characteristics and to provide clues to the arrhythmia mechanism and critical sites of involvement. Substrate mapping for tachycardias of supraventricular origin, whether true paroxysmal supraventricular tachycardias (SVTs), atrial fibrillation (AF), or atrial flutters, has not been demonstrated to be routinely useful, though it continues to be investigated in conjunction with newer imaging techniques. Alternatively, substrate mapping is a mainstay of VT evaluation and is addressed separately.


Significance of the Local Electrogram


The single interpretive link between a tachycardia and the operator is the local electrogram (EGM). Proper interpretation of EGMs relies on simultaneous evaluation of signal morphology, timing, and location to identify sites of involvement and arrhythmia mechanism, which may then guide therapy, whether medical, electrical, or ablative. A comprehensive understanding of the significance and implications of the local EGM is therefore critical to the deductive process of catheter mapping.


The intracardiac EGM is a graphical representation of localized cardiac electrical activity occurring in the region of the recording electrodes. From a purely signal-processing perspective, the EGM is determined as the instantaneous difference between signals recorded from two electrodes, at least one being intracardiac, and the second either also intracardiac (bipolar configuration) or positioned more remotely (unipolar configuration), for example, in an intravascular position, or connected to the “Wilson” central terminal or system ground. The “local” myocardial region contributing to the EGM is relative, related to the distance between recording electrodes as well as the specific recording configuration. More closely spaced electrodes are generally insensitive to far-field components and improve the fidelity of the near-field signal but at the cost of signal amplitude; wider-spaced electrodes, however, will detect signal from a larger region and record a greater amplitude, but they may dilute the local signal detail with detected far-field elements (Figures 23-1 and 23-2).


By convention, electrodes within the heart are termed exploring electrodes, as they are “exploring” or detecting from the region of interest, whereas those placed remotely are termed indifferent electrodes, as their contribution is minimized, given that signal amplitude is inversely proportional to the square of the distance to the source. A unipolar signal, which is obtained when recording between an exploring electrode and an indifferent electrode, incorporates the features of both near-field and far-field signals detected from the myocardium spanning the distance between the electrodes. A bipolar signal is given by the difference between unipolar signals recorded from each of the two exploring electrodes, which usually are closely spaced, and so depicts only the near-field electrical activity, with little or no far-field contribution.


Utility of the Unipolar Electrogram


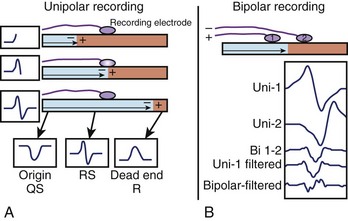
The minimally filtered unipolar EGM manifests an initial positive deflection when a propagating signal approaches the exploring electrode and then a rapid negative deflection as the signal moves away from it, which results in an rS, or RS, morphology. When the exploring electrode is positioned at or beyond a nonconductive boundary (e.g., within scar), such that the signal can only move toward the recording electrode but then cannot continue to propagate past it, the unipolar EGM assumes an essentially upright R, or Rs, morphology. As the exploring electrode is moved within “range” or close to an arrhythmogenic focus, the amplitude and duration of the initial positive deflection decreases, and the negative deflection predominates. When the exploring pole is positioned at an arrhythmogenic focus (e.g., origin of focal atrial tachycardia [AT]), or close to a nonconductive boundary such that the signal can only propagate away from the electrode (e.g., VT exit site or accessory pathway insertion), a QS morphology EGM results with a rapid initial downstroke (Figure 23-3, A; Figure 23-4). The maximum negative slope (intrinsic deflection) of the unipolar EGM coincides with depolarization of tissue directly beneath the recording electrode.1 As such, the unipolar EGM may provide information on proximity to an arrhythmia focus because of this sensitivity to far-field signals, and so may be iteratively evaluated to navigate toward and identify an arrhythmogenic focus or site of early activation. Although the unipolar EGM encodes whether the wavefront propagation is toward or away from the exploring electrode, it cannot further distinguish the specific direction of wavefront propagation.


image

FIGURE 23-3 Generation of unipolar and bipolar electrograms (EGMs). A, The unipolar EGM consists of signal detected between two electrodes, of which only one electrode records cardiac signal and the other contributes little or no signal; the lack of contribution by the second electrode is achieved by placing it remote from the heart (i.e., extracardiac). With unipolar recording, a positive deflection is inscribed as a depolarizing wavefront approaches the recording electrode. The signal then returns to baseline when the wavefront reaches the electrode (as it can no longer “approach” the electrode), and subsequently a negative deflection is inscribed as the signal moves away from the recording electrode. If the electrode were positioned at an electrical dead end, such as next to unexcitable tissue, then the signal can only approach the electrode but not move past it and away from it; thus it inscribes only a positive deflection. If the electrode were positioned at a location such that the signal could only move away from the electrode, for example, at a depolarizing focus (e.g., origin of focal atrial tachycardia), then only a negative deflection is inscribed. B, The bipolar EGM consists of the difference signal generated by the two temporally disparate unipolar EGMs resulting when a depolarizing wavefront approaches the pair of electrodes contributing to the recording bipole. In bipolar recording configuration, the interelectrode distance is usually less than a few centimeters and may even be only a few millimeters, and the EGM consists of the difference between the two time-aligned unipolar EGMs recorded by each electrode comprising the recording bipole. As a depolarizing wavefront approaches a recording bipole, the unipolar signal recorded at the distal pole (Uni-1) is added to the inverted unipolar signal detected at the proximal electrode (Uni-2) by convention, resulting in a difference signal. Though both electrodes record the same signal, they do not record them at the same time because the electrode closer to the approaching wavefront will record a signal earlier in time than the other electrode, thereby introducing a temporal separation in the recorded signals such that the signals do not cancel. The far-field, low-frequency components of each unipolar electrogram are similar and essentially do cancel, but the high-frequency signals are preserved, and the resultant EGM contains multiple notches and deflections not seen in either of the two unipolar EGMs, representing the instantaneous differences in the signals. Hence the high-pass filtered unipolar EGM (Uni-1 filtered) resembles the unfiltered bipolar EGM. Further high-pass filtering of the bipolar EGM (Bipolar-filtered) removes more low-frequency components and enhances the high-frequency characteristics, resulting in a sharper, notched EGM.


(From Stevenson WG, Soejima K: Recording techniques for clinical electrophysiology, J Cardiovasc Electrophysiol 16:1017–1022, 2005.)


While applicable for mapping focal tachycardias, unipolar recordings are somewhat limited in evaluating macro–re-entry when the circuit is entirely contained within a single chamber, as wavefronts arriving from all sites in the circuit would be expected to produce R waves.2


Utility of the Bipolar Electrogram


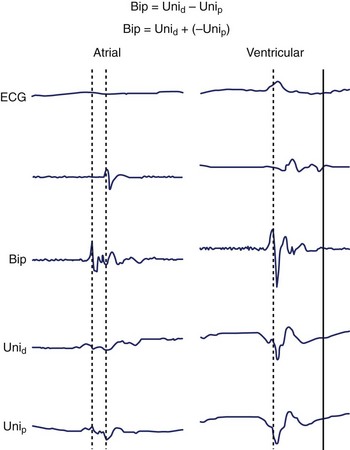
Bipolar EGMs are obtained from two exploring electrodes in relative proximity, each recording in unipolar configuration (see Figure 23-3, B). The lower-frequency components of the unipolar signals are contributed by essentially the same far-field signal and are canceled when their difference is obtained. However, the instantaneous local signals under each electrode differ, primarily in local activation time, voltage and frequency response, and propagation characteristics, generating a bipolar EGM with one or more rapid deflections (Figures 23-4 and 23-5).


Bipolar EGMs are particularly useful when mapping regions of abnormal and scarred tissue, as such sites tend to produce higher-frequency and lower-amplitude EGMs that may be otherwise obscured with unipolar mapping because of the contribution of the larger-amplitude far-field signal from surrounding healthier tissue. When effective ablation is delivered at a particular site, it is commonly observed that the bipolar EGM becomes smaller in amplitude or negative. This is related to loss of signal at the distal electrode (from which radiofrequency [RF] is delivered) with or without loss of signal at the proximal electrode (because of the dependence of the lesion radius on heat transfer and tissue necrosis), resulting in a diminished EGM and a negative EGM, respectively.


Unlike unipolar EGMs, the bipolar EGM does not exhibit a unique morphology when positioned at a tachycardia focus, though proximity may be estimated by its prematurity with respect to a timing reference such as the associated electrocardiography (ECG) wave of tachycardia beats (e.g., P or QRS). Nor can the morphology of the bipolar EGM provide information on the direction of wavefront propagation because of its insensitivity to far-field signals. However, the bipolar EGM is sensitive to the specific direction of wavefront propagation, as a wavefront propagating perpendicular to the orientation of the electrodes will simultaneously register nearly identical signals at both electrodes, which results in cancelation and complete absence of a recordable bipolar EGM when the difference is taken.


Utility of Simultaneous Unipolar and Bipolar Recordings in Focal Tachycardias


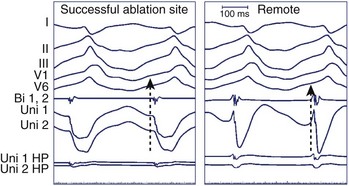
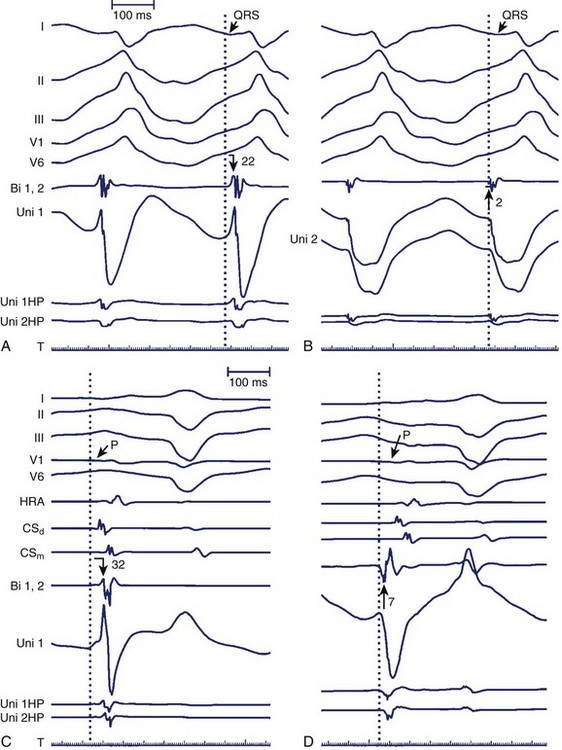
As stated, the amplitude and duration of the R wave of the unipolar EGM decrease with proximity to a tachycardia focus, and the intrinsic deflection of the unipolar EGM correlates well with local activation under the exploring electrode. A QS morphology of the unipolar EGM results when recording at the site of depolarization of a tachycardia origin. However, the timing of the maximal negative slope in the minimally filtered unipolar EGM is often difficult to gauge visually, and QS waves with lesser dV/dt may be seen a distance from a tachycardia focus.2 The peak of the first deflection of the bipolar EGM also correlates well with local activation, and the prematurity of the bipolar EGM with respect to the surface ECG tachycardia beat may be used to identify a presumed tachycardia focus.3 When the onset of the surface ECG wave is difficult to identify, assessing prematurity of the bipolar EGM may become unreliable, confounding the determination of proximity to a tachycardia focus. Instead, the unipolar EGM may be used to identify a tachycardia focus by identifying sites at which a QS morphology in the unipolar EGM coincides with the peak of the first deflection of the simultaneous bipolar EGM, as this obviates reliance on the surface ECG (Figure 23-6). The earliest sites obtained with bipolar mapping are associated with the shortest interval between the onset of the unipolar signal and the first peak of the bipolar signal, with successful ablation sites exhibiting intervals under 15 ms.2


image

FIGURE 23-6 Utility of simultaneous unipolar (Uni) and bipolar (Bi) electrograms (EGMs). While the precocity of the detected EGMs is typically evaluated with respect to the onset of the electrocardiography (ECG) waveform of the tachycardia of interest (i.e., P wave for focal atrial tachycardia and QRS for focal ventricular tachycardia), the onset of the ECG deflection may be difficult to identify, particularly in real time and at increased sweep speeds. However, the high correlation of both the onset of the unipolar EGM (Unio) and first peak of the bipolar EGMs (Bipp) with the onset of surface ECG waveform, implies that these two signals, which may be more easily compared with respect to timing, may be used together to determine proximity to a tachycardia focus. Specifically, minimizing the temporal difference between the onset of the unipolar EGM and the first peak of the bipolar EGM (Unio – Bipp)min obtained from a standard multi-polar mapping catheter identifies the expected tachycardia origin. Upper panels, A focal ventricular tachycardia is being mapped. A, The onset of Uni1 exhibits an initial R wave suggesting location remote from the focus, though proximity is difficult to determine as the onset of the QRS (arrow) is not easily identified. Unio – Bipp is 22 ms, and on close examination, the onset of the bipolar EGM (Bi1,2) is delayed with respect to the QRS. B, At the successful ablation site, Uni 1 exhibits a steep negative deflection at its onset with a QS morphology suggesting proximity to the tachycardia focus, though again, difficulty in identifying QRS onset (black arrow) poses a challenge to determining precocity at this location. The near-simultaneous onset of the bipolar EGM results in Unio – Bipp of 2 ms and identifies the earliest site of activation, and with close inspection, the onset of the bipolar EGM can be seen clearly preceding the onset of the surface QRS. Similarly, during focal atrial tachycardia (lower panels), Unio – Bipp is 32 ms at an unsuccessful ablation site (note the prominent R wave in Uni 1 and onset of Bi1,2 is delayed with respect to onset of the P wave), whereas at the successful ablation site, Unio – Bipp = 7 ms (Uni 1 exhibits only an “embryonic” R wave and onset of the bipolar EGM precedes onset of the P wave).


(From Delacretaz Soejima K, Gottipaty VK, Brunckhorst CB, et al: Single catheter determination for local electrogram prematurity using simultaneous unipolar and bipolar recordings to replace the surface ECG as a timing reference, Pacing Clin Electrophysiol 24:441–449, 2001.)


Factors Affecting the Local Electrogram


Anisotropic Conduction and Electrocardiogram Morphology


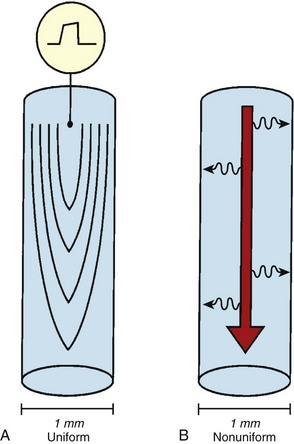
Anisotropic conduction refers to preferential longitudinal conduction that is observed in adult cardiac myocytes.46 In mature muscle cells, activation wavefronts may propagate across intercellular junctions both longitudinally and transversely. Because of the elongated configurations of ventricular myocytes, however, wavefronts propagating transversely encounter comparatively more intercellular junctions and, thus, travel more slowly than wavefronts moving an equal distance longitudinally. Therefore, normal myocardial conduction is described as uniformly anisotropic, with advancing wavefronts that are smooth in all directions but slower transversely than longitudinally, resulting in teardrop-shaped isochrones (Figure 23-7, A).


The “normal” ventricular EGM has been characterized during sinus rhythm in people with normal left ventricular function and without known structural heart disease. Normal bipolar EGMs obtained using multipolar catheters with 10-mm spacing are typically greater than 3 mV and of less than 70 ms duration without splitting, fractionation, or late components, though with somewhat lower amplitude and longer duration at the cardiac base.7


However, normal hearts do not exhibit “normal” EGMs and “normal” conduction patterns at all sites. Anisotropic conduction can become nonuniform in the absence of overt structural heart disease. Such anisotropy may be functional, related to anatomic and histologic barriers, borders, or alterations and varying orientations of overlapping myofibers. These histo-anatomic variances may predispose to local differences in signal characteristics, which, when detected in bipolar configuration, are then extracted and preserved, producing EGMs with multiple rapid deflections similar to those observed in patients with known structural heart disease.8


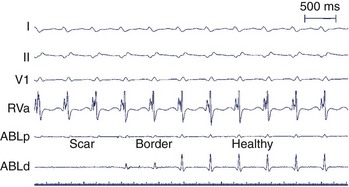
With advancing age, myocardial disease (e.g., myocardial infarction [MI]) and iatrogenic alterations in cellular architecture (e.g., prior ablation, maze procedure, external beam radiation), and associated deposition of connective tissue primarily along the longitudinal axis of cardiac fibers, lateral impulse propagation encounters greater resistance and becomes extremely slow and irregular (see Figure 23-7, B).46 This remodeling of cellular interconnections and electrical uncoupling produces heterogeneous regions of anisotropic slow conduction with reduced voltage and frequency response to excitatory stimuli, resulting in low-amplitude, fractionated EGMs with prolonged duration (Figure 23-8).


Catheter Mapping: Integral Components


Conventional catheter arrhythmia mapping, usually referred to simply as catheter mapping, necessitates (1) a sustained tachycardia, (2) sampling of local EGMs through electrode catheters positioned in direct contact with the underlying myocardium, and (3) knowledge of the specific sites from which signals are recorded.


Sustained Arrhythmia


Inducibility of a sustained tachycardia in the diagnostic electrophysiology suite that replicates the clinical arrhythmia confirms a reproducible and functional physiologic mechanism. Catheter mapping is often performed during sustained tachycardia because it is only during tachycardia that sampled potentials convey the order of cardiac activation. Sustained tachycardia affords the opportunity to observe spontaneous behavior, evaluate activation characteristics, and introduce intentional perturbations, the response to which may further clarify the underlying mechanism. Finally, the inducibility of sustained tachycardia during diagnostic evaluation affords a direct assessment of acute procedural success, as noninducibility after ablation then becomes a relevant endpoint.


It is implicit that the tachycardia being mapped involves a single circuit or focus as identified by EGM morphology and the activation sequence that is identical from beat to beat. Varying activation sequences during sustained tachycardia, which suggest multiple mechanisms, circuits, or sites of involvement, generally are not amenable to catheter mapping alone.


Contact catheter mapping of nonsustained episodes or isolated tachycardia beats poses additional challenges, which prolong the process and may increase the potential for mapping errors as salvos and single beats may not be representative of the clinical tachycardia. Complete noninducibility precludes catheter mapping and halts the evaluation of the tachycardia in most cases, though anatomically directed ablation and substrate mapping may still be undertaken.


Use of Electrode Catheters


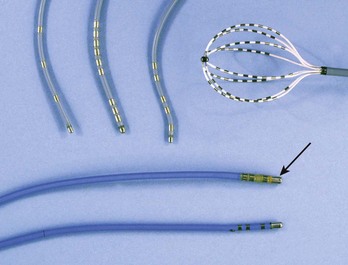
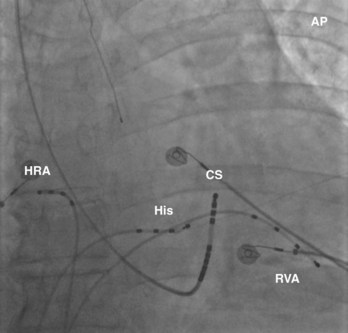
The recording of local activation signals during tachycardia is obtained through both stationary and roving electrode catheters. Standard diagnostic multipolar electrode catheters are introduced percutaneously, and the obtained signals—unipolar or bipolar EGMs—are displayed in real time on a digital recording system. Stationary electrode catheters may be positioned in any cardiac chamber and are typically maintained at a fixed site for the duration of the diagnostic evaluation. For safety and convenience, sites accessible transvenously via the right cardiac chambers are chosen, usually the high-lateral right atrium (approximating the site of sinus endocardial breakthrough), His bundle region (approximating the site of atrioventricular node [AVN] conduction), within the coronary sinus (CS) (approximating a posterior location and a right-left axis of activation of both the left atrium and the left ventricle), and the right ventricle (Figure 23-11). This “standard” catheter positioning approximates the normal conduction system axis and creates a skeleton of recording sites that defines the sequence and timing of activation from all four cardiac chambers, creating a fixed framework within which the tachycardia may be assessed. Other recording sites may be sampled as well to further enhance the diagnostic framework on the basis of the suspected arrhythmia.


Usually, a single roving mapping catheter is introduced to sequentially sample local potentials from cardiac chambers and sites pertinent to the tachycardia. The signal recorded by the mapping catheter is compared with the EGMs recorded by the stationary catheters as well as previously sampled sites to iteratively guide the operator to sites critical to the arrhythmia. Once such critical sites have been identified, further evaluation, such as pacing maneuvers, may be performed to confirm relevance to the tachycardia.


Cardiac Anatomy and Implications for Mapping


Knowledge of recording sites is critical to guide mapping as EGMs are interpretable only when paired with location. Decisions regarding how to proceed with mapping, that is, where to map next or in which direction the sought target is expected, cannot be made without knowing the current catheter positions. Therefore, competent catheter mapping requires basic awareness of fluoroscopic anatomy for proper EGM interpretation. Conversely, fluoroscopy may belie the true location of catheters, given its inability to detect depth, but EGM evaluation may confirm catheter location, as specific anatomic sites are associated with distinguishing EGM patterns or morphologies such that the local anatomic region may be inferred from the recorded signals (Figure 23-12). Sites with distinctive bipolar EGM patterns include the valve annuli, atrial appendage, crista terminalis, His bundle, CS, and the junctions between the cardiac chambers and the vascular tree (Figure 23-13).


Stay updated, free articles. Join our Telegram channel

Aug 12, 2016 | Posted by in CARDIOLOGY | Comments Off on Principles and Techniques of Cardiac Catheter Mapping

Full access? Get Clinical Tree

Get Clinical Tree app for offline access