Positron Emission Tomography for the Noninvasive Study and Quantitation of Myocardial Blood Flow and Metabolism in Cardiovascular Disease: Introduction
The study of the human heart with conventional radionuclide techniques is largely confined to assessments of the relative distributions of regional myocardial blood flow and of global and regional myocardial contractile function. Positron emission tomography (PET) extends these capabilities because it offers assays for probing and defining regional functional processes that span from blood flow to biochemical reaction rates, substrate fluxes, membrane receptor density and function, and neuronal activity. Newly developed assays, still in the investigational stage, can target the expression of transfected and endogenous genes, visualize cell trafficking, or probe molecular processes. The many positron emitting, biologically active tracers, the quantitative imaging capability, and the in vivo application of tracer kinetic principles account for these capabilities. The recent addition of structural imaging with in-line PET/computed tomography (CT) hybrid systems is likely to further refine these noninvasive assays for regional functional processes because they now can be accurately localized and related to structure. Aspects of the human heart’s physiology and pathophysiology can thus be assessed more comprehensively. Novel insights into the function of the human heart can be gained while, at the same time, findings with PET can decisively impact patient diagnosis and management. This chapter reviews the key ingredients of PET and the tools for the evaluation and/or quantification of local functional processes in the human heart. It continues by examining how these tools are applied to the diagnosis and characterization of coronary artery disease and its effects on regional myocardial tissue function and reviewing the impact of PET findings on patient management.
Tools for Probing Myocardial Tissue Function
Fundamental to PET are (1) the quantitative imaging and high temporal resolution capability; (2) the in vivo application of tracer kinetic principles; and (3) the large number of physiologically active radiotracers.
The quantitative imaging capability of PET results from physical properties unique to positrons. After losing their kinetic energy, positrons combine with an electron and “annihilate.“ The annihilation represents the conversion of mass into energy, that is, the combined mass of the positron and the electron converts into two 511-keV photons that leave the site of the annihilation in diametrically opposed directions. If both strike at the same time, two scintillation detectors connected by a coincidence circuitry, an annihilation event is registered. Its location in space can be defined by circular arrays of scintillation detectors. The near simultaneous arrival of two 511-keV photons at the two scintillation detectors positioned at opposite directions allows the use of tomographic reconstruction algorithms analogous to those used with x-ray CT. Accordingly, the spatial resolution throughout the image plane is rather homogeneous, which differs from that obtainable with conventional single-photon emission CT (SPECT) approaches, where the spatial resolution declines as the distance of the imaged object to the scintillation detectors increases. Furthermore, images of the tissue radiotracer concentrations are corrected for photon attenuation so that regional radioactivity concentrations can be measured in millicuries or megabecquerels per volume or mass of tissue. With modern in-line PET/CT systems, the correction for photon attenuation is accomplished by mapping out the regional attenuation coefficients on transaxial CT images. In addition, in-line PET/CT systems hold considerable promise for merging functional information (ie, myocardial blood flow, vascular inflammation, or apoptosis) with structural information (ie, coronary calcifications, multislice CT [MSCT] coronary angiography, arterial plaques, or regional and global left ventricular contractile function).
Positron-emitting isotopes of elements that constitute major parts of living matter, such as carbon 11 (11C), nitrogen 13 (13N), and oxygen 15 (15O), can be inserted into biomolecules without disturbing their very physiologic properties. Their high specific activity (radioactivity per mass) permits administration of minute and, thus, true tracer quantities without exerting a mass effect and thus perturbing the very process to be studied. Because their physiologic half-life is short, functional processes can be measured repeatedly or different aspects of the myocardial tissue function can be explored within the same study session. The radioactivity concentrations of these tracers in tissues such as arterial blood and myocardium and their changes over time can be determined noninvasively. Time-activity curves derived from serially acquired tomographic images at sampling rates of 1 to 10 seconds are fitted with operational equations that are based on tracer kinetic models and yield quantitative estimates of regional functional processes.
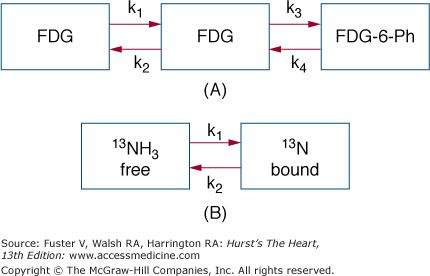
Tracer compartment models describe the distribution of the tracer radiolabel in tissue and its time-dependent changes (Fig. 25–1). Because only the activity concentration of the tracer radiolabel can be measured externally, these models relate the externally derived signal to the metabolic fate of the tracer label and its relationship to the functional process under study. Such tracer kinetic models typically consist of functional rather than anatomic compartments that contain the radiotracer or its metabolites. Exchange of radiotracers between compartments is described typically by first-order rate constants. Flux of radiotracer through a given compartment depends on the flux rate of tracer or of its metabolite as well as on the size of the compartment. Tracer compartment models provide the base for developing operational equations; when applied to the externally derived radioactivity signal as, for example, tissue time-activity curves, estimates of regional functional processes are derived in absolute units.
Figure 25–1.
Tracer compartment models. A. Three-compartment model used for describing the tissue kinetics of 18F-fluorodeoxyglucose (FDG). Compartment 1 describes the radioactivity in the vascular space, compartment 2 describes the activity in tissue, and compartment 3 describes the metabolized radiotracer retained in tissue. Exchange of radiotracer between compartments is described by first order rate constants (k); k1 describes the rate of exchange of FDG from blood into tissue, k2 describes the radiotracer return from the extravascular space into blood, and k3 describes the rate constant for the metabolic reaction, in the case of FDG, the hexokinase-mediated phosphorylation of FDG to FDG-6-phosphate (Ph). B. Compartment model depicting the tissue kinetics of nitrogen 13 (13N)-ammonia (13NH3). Ammonia freely diffuses across the cell membrane into the tissue space so that the vascular and extravascular spaces are lumped into one compartment (on the left). The compartment on the right represents the metabolically bound 13N activity (mostly in the form of glutamate but also glutamine); k1 describes a rate of metabolic trapping of 13N-ammonia, and k2 describes a loss of 13N label from the pool of bound 13N activity.
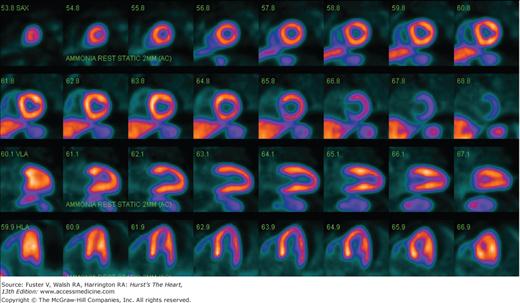
Several approaches exist for determining the relative distribution of and, in particular, for measuring regional myocardial blood flow. Tracers such as rubidium 82 (82Rb) or 13N-ammonia are retained in myocardium in proportion to blood flow so that images of their regional activity concentrations in the myocardium depict the relative distribution of blood flow in the myocardium at the time of tracer injection. The physical properties of the two tracers differ. For example, 82Rb is available through a generator-based, push-button–operated infusion system and, hence, easy to use clinically. Its physical half-life is only 75 seconds, so perfusion imaging can be repeated at time intervals of as little as 10 minutes. Conversely, the short physical half-life tends to produce low-count and, thus, statistically noisy images. Modern three-dimensional (3D) PET systems overcome this limitation and even allow gated acquisition of 82Rb perfusion images. The longer 9.8-minute physical half-life of 13N-ammonia, by contrast, produces images of higher count rates and thus of higher diagnostic quality but requires 30- to 40-minute time intervals between studies and, importantly, an on-site cyclotron production (Fig. 25–2).
Common to most diffusible flow tracers is their nonlinear myocardial uptake response to increases in blood flow, due to a flow-dependent curvilinear decline of the first-pass extraction fraction. Tracer compartment models compensate for the nonlinear tissue response so that noninvasive quantitative estimates of blood flow linearly track changes in blood flow. Such compensation is not needed for 15O-water because capillary and sarcolemmal membranes exert little, if any, barrier effect on the exchange of 15O-water. The extraction fraction is therefore largely flow independent, and radiotracer tracer net uptakes as a function of flow and the extraction fraction increase linearly with higher flows. Hence, 15O-water, at least in theory, is most ideally suited for measurements of blood flow.1 The tracer is also metabolically inert, whereas uptake and retention of 13N-ammonia or 82Rb are potentially susceptible to alterations in regional myocardial metabolism, although such effects were shown in animal experiments to be negligible.2,3 Current research focuses on the development and validation of additional positron-emitting tracers of myocardial blood flow. Most promising are flow tracers labeled with the more widely available fluorine 18 (18F) isotope that can be used without an on-site cyclotron or without a generator system and that, based on initial animal experimental studies, appears to provide exquisite high-quality myocardial perfusion images.4-6
Current PET approaches with different tracers of flow and/or different tracer compartment models yield comparable estimates of blood flow in human myocardium both at rest and during pharmacologically induced hyperemia.7-16 Interstudy differences in reported myocardial blood flow are likely related to methodology- and patient-related factors as well as to differences in study conditions at the time of measurement. Blood flow in normal myocardium depends strongly on oxygen demand and, thus, on cardiac work.17 Accordingly, individual flow measurements should be interpreted within the context of the rate-pressure product as a measure of cardiac work.9,18-20 Differences might also be related to sex. For example, women were found to have higher blood flows both at rest and during hyperemia when compared with age-matched males, a finding the authors attributed to higher high-density lipoprotein (HDL) cholesterol and lower triglyceride plasma levels in females.21,22
Important for measurements of myocardial blood flow is their reproducibility. Repeat studies in normal volunteers report a 10% ± 11% reproducibility (average percent difference of flows normalized to the rate-pressure product) for rest blood flow and a 12% ± 9% reproducibility for hyperemic blood flows.23 Other studies report similar values for 13N-ammonia, 82Rb, and 15O-water.24-28 Noninvasive flow measurements of blood flow have also been validated in animals against independently measured microsphere myocardial blood flows.7,12,29-32
In normal volunteers, stimulation of hyperemia with vascular smooth muscle–dilating agents such as dipyridamole, adenosine, adenosine triphosphate, or the adenosine A2A receptor agonist regadenoson has been shown to produce interindividually variable hyperemic flow responses but induce on average three- to five-fold increases in blood flow.7,8,10,33 Several factors may account for this variability. They include (1) the coronary driving pressure, best reflected by the mean arterial blood pressure; (2) extravascular resistive forces as a function of wall tension, tension development, and heart rate, which in turn depend on the diastolic volume and the myocardium’s contractile state34; (3) β- and especially α-adrenergic control of the basal vasomotor tone35; (4) endothelium-related contributions to vasomotion36; (5) pharmacologic effects on smooth muscle relaxation; and (6) age and sex.
Dipyridamole (at a dose of 0.56 mg · kg–1 over 4 minutes) and adenosine (140 μg · min–1 · kg–1, using a standard infusion time of 6 minutes) produce comparable levels of hyperemic blood flows.11 However, the vasodilator effect of these agents may be modified by antagonists as, for example, caffeine- or theophylline-containing agents,37 so it is imperative that patients refrain from these substances for at least 24 hours prior to pharmacologic stress testing. Higher doses of dipyridamole (by 50%) failed to stimulate higher flows and did not reduce the interpatient variability in flow responses.38
Hyperemic myocardial blood flows and, especially, myocardial flow reserves, decline with age.39-41 Possible contributing factors include an age-dependent decline in the vasodilator capacity and an age-dependent increase in baseline blood flow due to a progressive increase in the rate-pressure product as a major determinant of blood flow at rest. Changes in vascular compliance may further contribute to the age-dependent decline.
It is important to note that the vasodilator reserve as determined pharmacologically may not necessarily reflect the myocardium’s true ability to increase flow during physical exercise. For example, levels of vasodilator-stimulated hyperemic myocardial blood flows in normal volunteers were unrelated to their exercise capacity,42 or further, as observed in patients with hypertrophic cardiomyopathy, myocardial blood flow failed to increase or even declined with supine bicycle exercise despite some residual flow reserve as demonstrated with dipyridamole stimulation.43
Positive inotropic agents, for example dobutamine, are also used for stress interventions. This predominantly β2-adrenoreceptor agonist increases cardiac work, and thus, myocardial oxygen consumption, which is accompanied by a proportionate increase in myocardial blood flow.19 In one study for example, intravenous infusion of dobutamine in normal volunteers at a rate of 40 μg · min–1 · kg–1 body weight produced a two-fold increase in rate-pressure product that was paralleled by a 2.25-fold increase in myocardial blood flow. To augment the flow response to dobutamine, mostly through further increases in heart rate, some laboratories supplement the infusion of dobutamine with intravenous atropine (typically 0.5 mg).44
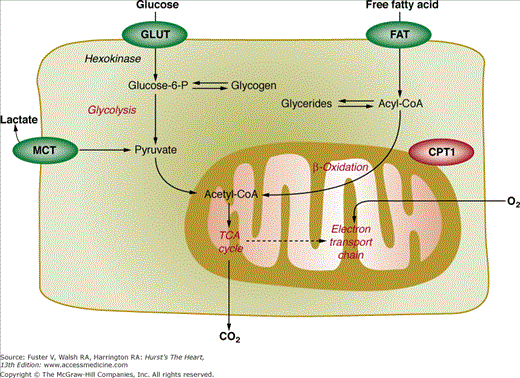
The major components of the myocardial substrate metabolism are illustrated in Fig. 25–3. According to this highly simplified scheme, the myocardium chooses between various substrates; foremost are free fatty acid, glucose, lactate, and ketone bodies. Selection of a fuel substrate depends largely on its concentration in plasma and the overall hormonal milieu.45,46 These, in turn, are governed by the dietary state, the level of physical activity, and, further, plasma concentrations of catecholamine, insulin, and glucagon. In the fasting state for example, circulating free fatty acid levels are high and insulin levels are low so that as much as 70% to 80% of the myocardium’s oxygen consumption can be accounted for by oxidation of free fatty acid.47 Conversely, oral glucose raises plasma glucose and, in response, insulin levels and lowers free fatty acid levels so that myocardium shifts its fuel selection to glucose.46 Strenuous physical exercise increases release of lactate from skeletal muscle. Plasma levels therefore rise, and lactate becomes the major fuel substrate.48,49 In fact, as much as 60% of the oxygen consumption has been accounted for by oxidation of lactate during strenuous exercise. Other determinants of substrate selection include catecholamines, which accelerate lipolysis so that circulating free fatty acid levels increase, associated with a shift in the heart’s substrate selection to free fatty acid as, for example, in congestive heart failure patients.
Glucose enters the cell via facilitated transport systems, the largely insulin-independent glucose transporter GLUT1 and the insulin-dependent glucose transporter GLUT4. The hexokinase reaction phosphorylates glucose to glucose-6-phosphate. The reaction product may be synthesized to glycogen or, alternatively, enters glycolysis with pyruvate as the end product. Converted to lactate, it may leave the myocardium or, if activated to acetyl-coenzyme A (CoA), enters the tricarboxylic acid (TCA) cycle as the final oxidative pathway shared by most fuel substrates. Exogenous lactate can be converted via nicotinamide adenine dinucleotide (NAD+) to pyruvate, which after esterification to acyl-CoA enters the TCA cycle. Like glucose, free fatty acid may enter two different metabolic pathways. After entering the cell via diffusion or a fatty acid carrier, it is esterified by the thiokinase reaction to acetyl-CoA. This compound may then enter an endogenous lipid pool, consisting mostly of glycerides and phospholipids, or proceed via the carnitine shuttle to the inner mitochondrial membrane. It is there where β-oxidation cleaves of the long chain acyl-CoA units into two-carbon fragments, which then engage in the TCA cycle. The TCA cycle metabolizes the two-carbon units into CO2 and H2O. The rate of flux through the TCA cycle is tightly coupled to oxidative phosphorylation where the energy resulting from the synthesis of oxygen and hydrogen ions is stored in the high-energy phosphate bonds of adenosine triphosphate (ATP). The latter is shuttled into the cytosol with transfer of energy to the high-energy phosphate bond of creatine phosphate as a readily available source of energy. Other sites of high-energy production include glycolysis. Energy yields in terms of ATP relative to oxygen differ between the various substrates. For example, for 1 mole of oxygen, glucose yields 6.3 moles ATP, lactate 6 moles ATP, and free fatty acid 5.7 moles ATP.50
As shown schematically in Fig. 25–3, the initial metabolic step of exogenous glucose metabolism can be evaluated and quantified with 18F-fluorodeoxyglucose (18F-FDG). This radiolabeled glucose analog exchanges across the capillary and sarcolemmal membranes in proportion to glucose, with which it then competes for hexokinase for phosphorylation to 18F-deoxyglucose-6-phosphate (see Fig. 25–1).51,52 Unlike its natural counterpart, the phosphorylated glucose analog is a poor substrate for glycogen formation, glycolysis, and the fructose-pentose shunt; its rate of dephosphorylation is low in myocardium, and it is relatively impermeable to the cell membrane. The phosphorylated tracer thus becomes trapped in the cell so that images of the myocardial 18F activity concentrations acquired approximately 40 to 60 minutes after tracer injection reflect the relative distribution of exogenous glucose utilization rates. Because the compound traces only the initial steps of glucose utilization (up to the branch point between glycogen synthesis and glycolysis, see Fig. 25–3), it offers no direct information on glycolytic rates, glucose oxidation, or glycogen synthesis. Yet, in states of glycogen depletion as for example during ischemia, exogenous glucose serves as the major source of glycolytic flux so that 18F-FDG may offer an estimate of the rate of glycolysis.
The tissue kinetics of 18F-FDG have been described by a unidirectional transport model,51,52 which affords the quantification of regional rates of myocardial glucose utilization through relatively simple, rapid, and computationally efficient analysis approaches.53,54 Typical values for exogenous glucose utilization under different dietary conditions and as reported from several laboratories are approximately 0.10 to 0.24 μmol/min/g in the fasting state, approximately 0.69 μmol/min/g after oral glucose loading, and approximately 74 μmol/min/g during hyperinsulinemic-euglycemic clamping.55-57 To adjust for differences in the affinity of glucose and the glucose analog tracer for the hexokinase reaction and for differences in the transmembrane exchange, a so-called lumped constant (LC) is applied. The value used most frequently is 0.7 as derived for canine myocardium.52 However, the LC may not truly be constant but depend on study conditions.58-60 This may be related to changes in the affinity of 18F-FDG for transmembrane exchange in hexokinase and hence in the LC but, at the same time, suggests that the LC can be derived individually from the morphology of the myocardial 18F time-activity curve.61
A more recently developed approach to measurements of myocardial glucose metabolism entails the use of 11C-glucose. Accumulation and clearance of radiotracer in the myocardium are estimated from serially acquired PET images. Using estimates of the myocardial extraction of 11C-glucose and of myocardial blood flow as determined with 15O-water and the arterial blood glucose concentration, the myocardial consumption of glucose can be measured.62-65 Different from the 18F-FDG approach, the 11C-glucose method potentially offers a more comprehensive evaluation of glucose metabolism. Fluorine 18 deoxyglucose traces only the initial metabolic step of exogenously derived glucose, whereas an assessment of the fractional distribution of glucose between glycogen synthesis and glycolysis and oxidation appears feasible with the 11C-labeled compound.
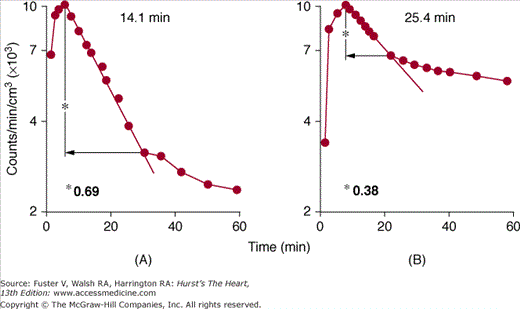
This particular substrate pathway can be evaluated with 1-[11C] palmitate. The labeled long-chain fatty acid participates fully in the metabolic fate of its natural counterpart (see Fig. 25–3). Once esterified to acyl-CoA, a fraction of tracer label proceeds via the carnitine shuttle into mitochondria where β-oxidation catabolizes the long-chain fatty acid into two-carbon fragments that are then oxidized via the TCA cycle. The label is released from the myocardium in the form of 11CO2. The remaining fraction of the initially extracted and activated tracer enters intracellular lipid pools, consisting mostly of di- and triglycerides and phospholipids. The biexponential morphology of the myocardial tissue time-activity curve reflects the metabolic fate of the tracer. The slow turnover rate of the intracellular lipid pools accounts for the slow clearance phase, whereas the relative size and slope of the rapid clearance curve component correspond to the fraction of tracer that has entered oxidative pathways and its rate of oxidation. Ischemia reduces the rate of fatty acid oxidation and of TCA cycle activity. Accordingly, size and rate of the rapid clearance curve component on the 11C myocardial time-activity curve typically decline.66,67 A disproportionately greater fraction of tracer label is then shunted into slow-turnover, endogenous lipid pools. However, enhanced back-diffusion of nonmetabolized tracer may complicate the evaluation of fatty acid oxidation in acutely ischemic myocardium as demonstrated in dog experiments.68 Used mostly as a tracer for the qualitative evaluation of regional myocardial fatty acid metabolism, recent studies indicate the possibility of quantitating myocardial fatty acid oxidation in milliequivalents of free fatty acid per gram of myocardium per minute.62-65
Another more recently introduced approach for estimating the myocardial uptake of free fatty acid entails a radio-fluorinated fatty acid analog, [18F]fluoro-6-thia-heptadecanoic acid (18FTHA). The compound is thought to more selectively trace β-oxidation and, analogous to 18F-FDG, becomes metabolically trapped in the myocardium. Rates of myocardial free fatty acid utilization, derived from serially acquired PET images after intravenous administration of 18FTHA, are comparable to those obtained invasively with the Fick method and, further, are similar to those derived with 11C-palmitate.69-71
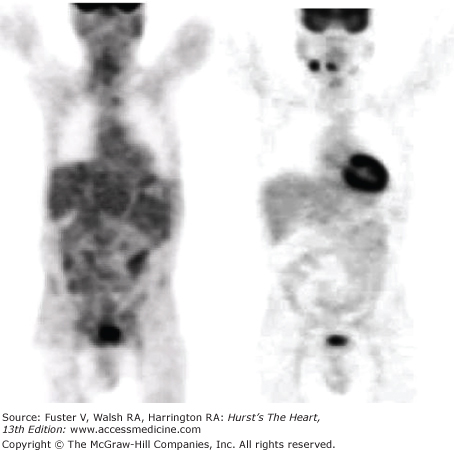
Preferential utilization of a fuel substrate, such as glucose, lactate, or free fatty acid, depends on its concentration in arterial blood, which in turn depends on the dietary state, serum levels, or insulin resistance or on physical stress.72 Changes in the myocardium’s preferential substrate utilization can be demonstrated with 11C-palmitate or 18F-FDG or both.72,73 In the presence of high free fatty acid and low glucose and insulin levels, use of free fatty acid as the preferred substrate is reflected on the 11C-palmitate curve by the large relative size of the rapid clearance phase and its steep slope (both corresponding to increased fatty acid oxidation) and the low or even undetectable 18F-FDG uptake (Figs. 25–4 and 25–5). Carbohydrate ingestion raises plasma glucose levels, stimulates insulin secretion, and depresses free fatty acid levels. The corresponding shift in myocardial glucose utilization is reflected by a decline in the size and slope of the rapid clearance phase of 11C-palmitate and by an increase in myocardial 18F-FDG uptake.
Figure 25–4.
Whole-body images of 18F-fluorodeoxyglucose (FDG) uptake in a patient after overnight fasting (left panel) and 1 hour after oral glucose loading (right panel). Note the 18F-FDG uptake by brain under both conditions and the absence of 18F-FDG uptake by myocardium after an overnight fasting, implicating free fatty acid as a preferred fuel substrate with little glucose utilization. However, in response to oral glucose loading, there is a marked increase in 18F-FDG uptake by myocardium, suggesting a change in substrate metabolism and utilization of glucose.
Figure 25–5.
Effects of substrate availability on myocardial fatty acid metabolism. A and B depict myocardial time-activity curves for carbon 11 (11C)-palmitate derived from serial positron emission tomography images. As seen on the time-activity curves, the radiotracer clears from myocardium in a biexponential fashion; the slow clearance phase corresponds to the radiotracer in the lipid pool, whereas the rapid clearance phase reflects the fraction of radiotracer that undergoes oxidation. In the fasting state (A), a large fraction of radiotracer becomes immediately oxidized as reflected by the large size of the rapid clearance phase. This fraction declines, however, after oral glucose administration (B) when plasma-free fatty acid levels decline, glucose and insulin levels increase, and myocardium shifts from free fatty acid to glucose utilization.
Molecular 15O-oxygen, administered intravenously, affords measurements of the myocardial oxygen consumption. The myocardial extraction of labeled oxygen is determined by PET first, and when multiplied by myocardial blood flow,74,75 the mass of oxygen consumed per minute per gram of myocardium can be estimated. A more widely applied assay of myocardial oxidative metabolism, and thus of oxygen consumption, uses 11C-labeled acetate. The radiotracer clears rapidly from blood into myocardium and produces high signal-to-background images.76-78 It directly traces the rate of substrate flux through the TCA cycle as the final oxidative pathway shared by most fuel substrates. The rate of clearance of 11C activity from the myocardium as derived from serially acquired images corresponds to the TCA cycle activity and, because it is closely coupled to oxidative phosphorylation, to oxidative metabolism, and myocardial oxygen consumption. However, the tracer does not yield mass fluxes but only rate constants that can be converted into units of oxygen per minute per gram of myocardium. Unlike 11C-palmitate or 18F-FDG, the clearance rate of 11C-acetate from myocardium is relatively insensitive to changes in myocardial preferential substrate utilization.76 A tracer compartment model, based on biochemical assays of the tracer tissue kinetics of carbon 14 (14C)-acetate in isolated rat hearts,79 forms the base for estimating myocardial oxygen consumption in absolute units in the human heart and, at the same time, of regional myocardial blood flow.80,81 Both the 15O-oxygen and the 11C-acetate techniques yield similar estimates of the myocardial oxygen consumption in the normal human myocardium.82 However, values in regions with reduced blood flow have been found to differ, mostly because of methodologic differences, where the 11C-acetate approach yields average transmural values, whereas the 15O-water approach renders estimates confined to the water perfusable tissue fraction.
Applications in Cardiovascular Disease
The rapid dissemination and clinical acceptance of PET and, especially, of PET/CT hybrid imaging for tumor detection and staging and therapy response monitoring have been followed by greater clinical use of PET in patients with cardiovascular disease. Identification of coronary artery disease, assessment of its extent and severity, and risk stratification of patients, together with the assessment of myocardial viability, have been and continue to be major clinical applications of PET in cardiology. Indeed, myocardial perfusion imaging has been defined as a class 1 indication that is especially useful in patients with equivocal or nondiagnostic SPECT myocardial perfusion studies.83 Recent developments indicate additional diagnostic benefits, including more accurate estimates of the extent of coronary disease and identification of preclinical coronary atherosclerosis. Furthermore, PET/CT hybrid devices offer additional possibilities such as the combined assessment of function and morphology of the coronary arteries. Other developments that may prove to be clinically useful include the characterization of potentially vulnerable plaques. Assessment of myocardial viability as the second major clinical use of PET advantageously uses radiotracers of myocardial perfusion and substrate metabolism and uses metabolic criteria for identifying potentially reversible impairments in regional contractile function. Beyond this particular indication of PET, recent investigations suggest a possible future clinical role for metabolism imaging in heart failure and for design, implementation, and monitoring of new treatment strategies.
PET studies of myocardial blood flow have generally focused on four aspects of coronary atherosclerosis and coronary artery disease (CAD): (1) detection of obstructive CAD and characterization of its extent and severity; (2) determination of fluid-dynamic consequences of obstructive coronary stenoses on regional myocardial blood flow in terms of absolute units of blood flow; (3) assessment of coronary risk and long-term prognostication; and (4) assessment of coronary vasomotor function and its alterations in individuals at risk for CAD. These investigations explored the vascular smooth muscle–and endothelium-related contributions to the overall coronary function and examined whether functional alterations contained predictive information and whether such functional abnormalities can be reversed or ameliorated through therapeutic and pharmacologic strategies.
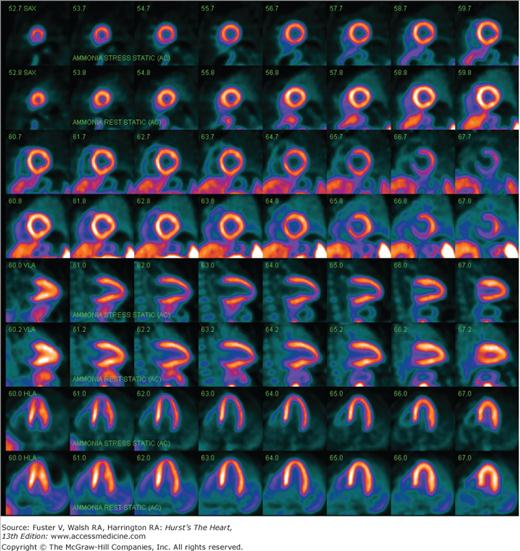
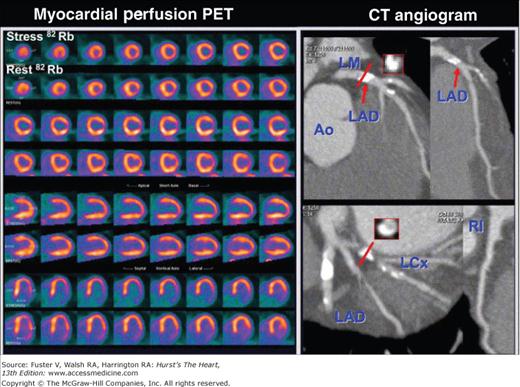
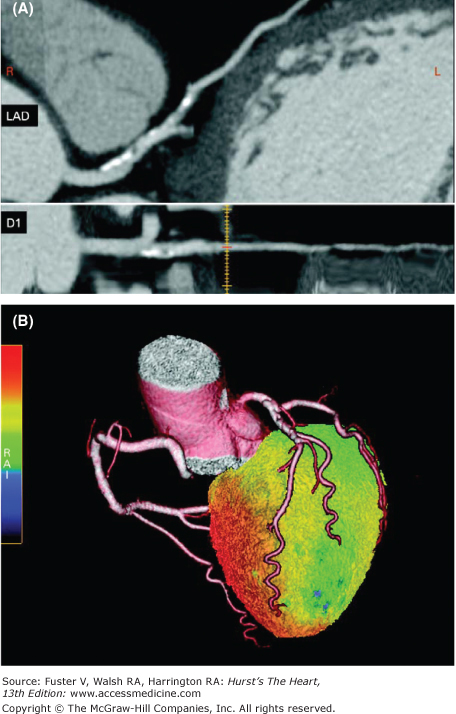
For the detection of CAD, the relative distribution of myocardial blood flow is initially examined at rest and then during stress. PET investigations almost invariably use pharmacologic stress with adenosine, dipyridamole, ATP, or, more recently, the adenosine receptor agonist regadenoson because of the short physical half-life of the positron-emitting flow tracers 82Rb and 13N-ammonia and the requirement for maintaining patients in exactly the same position for acquisition of the emission and the transmission images. However, PET myocardial perfusion imaging is also possible with treadmill or bicycle stress.84,85 Both 82Rb and 13N-ammonia are retained in myocardium in proportion to blood flow so that the resulting images depict the relative distribution of myocardial blood flow at rest and during hyperemia. The approach identifies resting flow defects and attenuated responses of regional blood flow to hyperemia as a consequence of a coronary stenosis (Figs. 25–6 and 25–7). Images of rest and hyperemic perfusion are analyzed by visual inspection and by quantitative analysis where regional tracer activity concentrations are compared with a database of normal concentrations and are displayed in the form of standardized polar maps. Alternate displays of regional myocardial perfusion include surface-rendered 3D images of the left ventricular myocardial perfusion, which can be merged with 3D displays of the coronary angiograms, obtained during the same study session with MSCT and thus connecting structural abnormalities with downstream functional consequences (Fig. 25–8).
Figure 25–6.
Nitrogen 13 (13N)-ammonia images of myocardial perfusion in a normal volunteer obtained during adenosine stress (upper panel) and at rest (lower panel). Note the homogenous distribution of tracer throughout the myocardium as seen on the short axis and the horizontal and vertical long axis images.
Figure 25–7.
Abnormal rubidium 82 stress-rest myocardial perfusion images with an extensive and severe perfusion defect in the lateral wall as seen on the stress images. As seen on the rest images, this defect does not fully resolve with rest. The defect corresponds to the severe stenosis of the left circumflex coronary artery as seen on the multislice computed tomography (CT) coronary angiogram (right panel). Ao, aorta; LAD, left anterior descending artery; LCx, left circumflex coronary artery; PET, positron emission tomography Courtesy of Marcelo di Carli MD, Harvard University, Boston.
Figure 25–8.
Three-dimensional display of the relative distribution of myocardial blood flow combined with the three-dimensional distribution of the coronary vessels by multislice computed tomography (MSCT) coronary angiography. As seen in panel A, the MSCT coronary angiograms display calcifications of the proximal left anterior descending (LAD) coronary artery and an obstruction of the first diagonal branch, resulting in a downstream perfusion defect as depicted in green on the surface-rendered three-dimensional flow distribution. Reproduced with permission from Knuuti and et al.322
Clinical investigations have confirmed the high diagnostic performance of PET for the detection of CAD.86-92 Sensitivities range from 87% to 97%, and specificities range from 78% to 100%. Most studies compared the findings with stress-rest perfusion imaging with coronary angiographic findings, where fluid dynamically significant stenoses were defined by 50% or 70% luminal narrowing. In view of the limitations of visual analysis of coronary angiograms, Gould et al93 and Demer et al88 graded stenosis severity by estimating the coronary flow reserve from quantitative angiograms. Coronary arteries were classified as moderately to severely stenosed if the predicted coronary flow reserve was <3, as intermediate if the coronary flow reserve ranged from 3 to 4, and as minimal if the coronary flow reserve was >4. According to this classification, PET correctly identified 94% of vessels with moderate to severe stenosis, 49% of vessels with only intermediate stenosis, and 5% of vessels with minimal stenosis.
The diagnostic accuracy of PET has been compared with that of more conventional approaches. Demer et al88 indirectly compared their findings with PET to those in another laboratory using thallium 201 (201Tl) SPECT, whereas both used the same angiographic approach for defining stenosis severity.94 This comparison found PET to be more sensitive than SPECT. Both studies defined stenosis severity by the angiographically predicted coronary flow reserve. Moderate to severe coronary stenoses were detected with a 95% sensitivity by PET and a 72% sensitivity by 201T1 SPECT, and intermediate stenoses were detected with a 49% sensitivity by PET, whereas none was detected by SPECT.
Other investigations compared the diagnostic accuracies of PET and SPECT in the same patients. One study examined the relative merits of PET and SPECT in 202 patients during the same pharmacologic stress.89 Myocardial blood flow was evaluated with 82Rb at rest and again 4 minutes after dipyridamole infusion. Eight to 9 minutes later (ie, a total of 12-13 minutes after the end of the 4-minute dipyridamole infusion), 201Tl was injected, and SPECT imaging was performed within 10 minutes. PET and SPECT revealed comparable specificities, but PET demonstrated a significantly higher sensitivity than SPECT. The results were similar when only 132 of the 202 patients without prior cardiac events such as angioplasty or bypass grafting were analyzed. A third study reached different conclusions.90 Eighty-one patients underwent rest and dipyridamole stress imaging with 82Rb and PET; for the 201Tl SPECT study, 38 patients (47%) underwent treadmill stress, and the remaining 43 patients (53%) underwent dipyridamole vasodilator stress. PET and SPECT exhibited comparable sensitivities, whereas the specificity was higher for PET than for SPECT. There were no differences in diagnostic accuracies between patients submitted to treadmill stress testing and patients with pharmacologically induced hyperemia.
Another more recent comparison study lent further support for the high diagnostic accuracy of PET stress-rest myocardial perfusion imaging and explored reasons for its superior diagnostic performance.95 Four experienced nuclear cardiologists interpreted 112 SPECT technetium 99m (99mTc)-sestamibi and 112 PET 82Rb electrocardiography (ECG)-gated, dipyridamole stress and rest perfusion images in two patient cohorts that were matched by sex, body mass index, and angiographic extent and severity of CAD. The overall diagnostic accuracy was significantly higher for PET than for SPECT, regardless of whether a 50% or 70% diameter stenosis was used as stenosis threshold. The higher diagnostic performance of PET was due to a significantly higher specificity, whereas the gain in sensitivity was only marginal and statistically insignificant (Fig. 25–9). PET also proved to be more accurate than SPECT in identifying the number of stenosed coronary vessels and, thus, the extent of CAD. The greater proportion of high-quality images (images without photon attenuation artifacts and without activity cross-contamination between liver and bowels and the left ventricular myocardium) was thought to account for the higher diagnostic performance. An important aspect of this investigation was the high interpretive certainty for defining studies as definitely normal or definitely abnormal. This high interpretive certainty was independent of patient sex or body weight. The four nuclear cardiologists rated 96% of all PET studies as either definitely normal or abnormal as compared with 81% of the SPECT images (P = .001).
Figure 25–9.
Comparative sensitivities (Sens), specificities (Spec), and diagnostic accuracies (Acc) and interpretive certainties for single-photon emission computed tomography (SPECT) and positron emission tomography (PET) stress myocardial perfusion imaging. Adapted with permission from Bateman et al.95
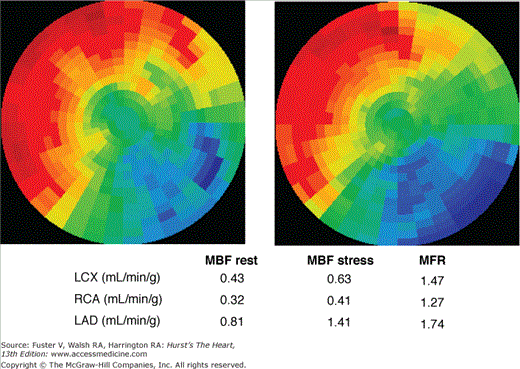
Two other developments promise further improvements in diagnostic accuracy, especially for assessing disease extent and severity. One relates to measurements of myocardial blood flow, and the second relates to the ability to measure left ventricular function during (and not after) the peak vasodilator stress. Conventional myocardial perfusion imaging delineates the relative distribution of myocardial blood flow. Myocardial regions with the highest radiotracer uptake are considered normal and serve as reference for regions with reduced tracer activity. This reference approach becomes limited in triple-vessel disease when the flow response to pharmacologic vasodilation in such normal regions is also diminished, although less in regions subtended by less severely stenosed coronary vessels. The diminished vasodilator response in the reference myocardial regions can be identified by quantitative flow estimates. One investigation used the myocardial retention of 82Rb as index of absolute myocardial blood flow during vasodilator stress and defined thresholds for a normal myocardial perfusion reserve.85 As compared with an average size of stress defects of 44% ± 18% by standard polar map analysis of the relative radiotracer distribution on stress perfusion images in patients with triple-vessel disease, the stress defect size by the quantitative approach averaged 69% ± 24% and thus more correctly identified the true extent of coronary involvement (Fig. 25–10).
Figure 25–10.
Quantitative myocardial perfusion imaging in coronary artery disease. The polar maps of the distribution of myocardial blood flow at rest (left) and during stress (right). Myocardial blood flows (MBFs) for the major coronary artery territories are listed for the rest study and for the adenosine stress study. The corresponding regional myocardial perfusion reserves (MFR) are markedly diminished, so that the anterior and septal myocardial regions with the highest tracer activity are subtended by a diseased coronary artery. LAD, left anterior descending artery; LCX, left circumflex coronary artery; RCA, right coronary artery.
The second development includes measurements of the left ventricular function at rest and during (and not after) peak vasodilator stress. In normal individuals, the left ventricular ejection fraction increases from rest to peak dipyridamole stress.96 However, the ejection fraction reserve is diminished in CAD. Vasodilator-induced changes in the ejection fraction correlated with the extent of CAD, where ejection fractions declined during vasodilator stress in inverse proportion to the extent of stress-induced perfusion defects or, in instances with apparently normal myocardial perfusion during stress in patients with main left or balanced CAD, to the angiographic extent and severity of disease.96,97
Some investigations have explored the prognostic value of stress-rest myocardial perfusion imaging with PET. One preliminary survey of 108 patients with a relatively low pretest likelihood of CAD found no cardiac morbidity or mortality for 2 years after a normal PET study.98 When PET was used in a population with strongly suspected or known CAD, the prognostic value of PET was maintained.99 By following 685 patients for an average period of 41 months, a normal PET study was associated with a 0.9% annual cardiac mortality compared with a 4.3% annual mortality rate in patients with rest and/or stress-induced perfusion defects. Moreover, the value of PET for assessing the preoperative risk in patients scheduled for aortic, carotid, and femoral artery surgery has been explored.100 A normal PET study had a 92% negative predictive accuracy for a cardiac event. Conversely, extensive ischemic defects involving at least 5 of 24 myocardial segments were 64% accurate in predicting a perioperative cardiac event.
Another more recent investigation further explored the prognostic value of 82Rb rest-stress perfusion imaging with PET in a more diverse study population, including 134 patients (35.6%) with obesity (body mass index ≥30 kg/m2), 90 patients (24.5%) with prior equivocal or nondiagnostic SPECT stress-rest perfusion imaging studies, and 148 patients (40.3%) with known CAD.101 Patients were grouped by the stress summed score on the PET stress perfusion images, where (using a 20-segment model) a stress summed score of <4 was considered normal, of 4 to 7 as mildly abnormal, of 8 to 11 as moderately abnormal, and of >12 as severely abnormal. During the 3.1 ± 0.9 year follow-up of 360 patients, there were 11 cardiac deaths and 6 nonfatal myocardial infarctions; 29 patients underwent late revascularizations, and 12 patients required hospitalizations due to cardiac-related symptoms. Annual cardiac event rates were directly related to the severity of the stress perfusion scores. A normal study was associated with an annual rate of hard events (death and nonfatal myocardial infarctions) of 0.4% for patients with normal stress perfusion images and of 2.3% and 7.0% for patients with mildly and moderately to severely abnormal stress perfusion images, respectively. Corresponding annual rates for all cardiac events were 7.7%, 12.9%, and 13.2%, respectively. Multivariable analysis identified the summed stress score as the strongest predictor of all cardiac events, and together with age, as a statistically significant overall hard event predictor. The predictive value of PET was also maintained in patients with prior nondiagnostic SPECT studies; the annual cardiac event rate was 15.2% for an abnormal PET stress image compared with an annual event rate of 1.3% for patients with normal stress images. Similarly, in obese patients, annual all-cardiac event rates were 1.5% and 11.1% for a normal and an abnormal PET study, respectively.
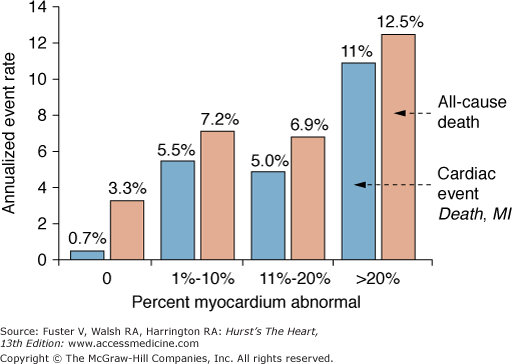
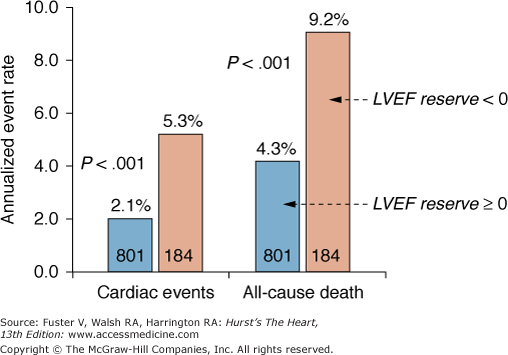
Measurements of the peak stress left ventricular ejection fraction of the ejection fraction reserve by gated acquisition of the 82Rb images add statistically significant prognostic information. In one investigation combining patients from two different medical centers, 1441 patients were followed for an average of 2.7 ± 0.8 years after a gated 82Rb stress-rest perfusion study.102 The 9.2% all-cause mortality in this patient group was directly related to the defect extent on the stress perfusion images, a finding consistent with those reported in earlier investigations.101 However, the annualized all-cause mortality was also associated with the stress left ventricular ejection fraction. For example, an extensive stress perfusion defect (ie, summed stress score >8), together with a <40% ejection fraction, was associated with a 9.9% annualized mortality compared with significantly lower annualized mortalities of only 2.9% and 2.6% for patients with comparable defect extents on the stress perfusion images but with ejection fractions ranging from 50% to 59% and >60%, respectively. Another investigation reports similar findings but differs in regards to the type of functional assessment.103 Among the 985 consecutive patients, 83 (5%) experienced a major cardiac event, and 140 (9.7%) died during an average follow-up of 1.7 ± 0.7 years. Event rates were again related to the perfusion defect extent on the stress images (Fig. 25–11); different from the earlier study, however, only the left ventricular ejection fraction reserve, and not the stress left ventricular ejection fraction, contained statistically significant prognostic information (by Cox proportional hazards model). Annualized mortality rates were 4.3% for patients with ejection fraction reserves of >0 and 9.3% for patients with a negative ejection fraction reserve (ie, the left ventricular ejection fraction decreased from rest to dipyridamole stress) (Fig. 25–12).
Figure 25–11.
Predictive value of positron emission tomography (PET) rubidium 82 stress-rest myocardial perfusion imaging. The annualized event rates (cardiac events in death and nonfatal myocardial infarction [MI]) are plotted in blue, the all-cause mortality is plotted in red. As depicted, the annualized event rates are strongly related to the extent of the perfusion defects and were highest for >20% stress myocardial flow defects. Reproduced with permission from Dorbala et al.103
Figure 25–12.
Prognostic value of gated rubidium 82 positron emission tomography (PET) stress-rest perfusion imaging for patients with a left ventricular ejection fraction reserve of >0 (blue) or <0 (pink). The number of patients for each group is listed in each bar. LVEF, left ventricular ejection fraction. Adapted with permission from Dorbala et al.103
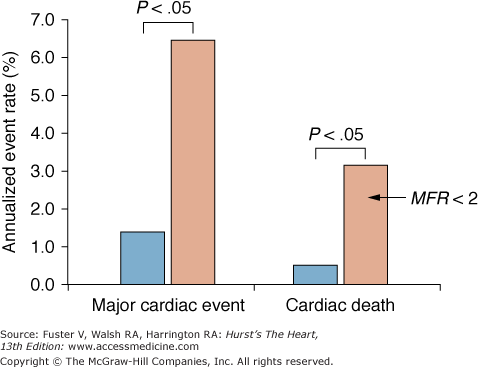
Increments in the predictive value of PET stress-rest perfusion imaging can be obtained from simultaneously measured myocardial blood flows.104 In 256 patients submitted to 13N-ammonia stress-rest perfusion imaging, a regional perfusion reserve of <2 was independently associated with a higher incidence of major cardiac events, including cardiac death, nonfatal myocardial infarction, and the need for interventional revascularization during the average follow-up of 5.4 ± 2.2 years. Importantly, during the initial 3 years of follow-up, patients with normal stress-rest perfusion images but a flow reserve of <2 were more likely to experience a cardiac event than patients with flow reserves of >2 (6.3% vs 1.4%, respectively) (Fig. 25–13). Flow reserves in patients with abnormal stress-rest perfusion images were similarly predictive; cardiac event rates were significantly higher for patients with diminished versus normal regional flow reserves.
Figure 25–13.
Incremental prognostic value of quantitative regional myocardial blood flow during stress-rest myocardial perfusion imaging with positron emission tomography (PET) and nitrogen 13 (13N)-ammonia. Patients with a normal perfusion reserve (>2) are shown in blue, and patients with a diminished perfusion reserve (<2) are shown in pink. Note that regional myocardial flow reserve (MFR) of <2 is predictive of a significantly higher annualized event rate compared with flow reserves of >2. Adapted with permission from Herzog et al104
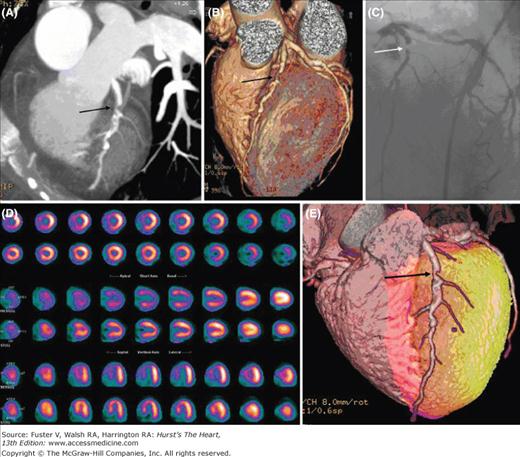
Current developments indicate exciting possibilities for the detection and characterization of CAD with PET/CT hybrid imaging. Fusion of myocardial perfusion, both relative and measured in absolute units, with the coronary anatomy allows an assessment of the functional consequences of coronary stenoses (Fig. 25–14; see also Figs. 25–7 and 25–8). Moreover, impairments in regional contractile function detected on the gated perfusion or the contrast CT angiographic images can be related to regional perfusion and its reserve and, further, to anatomic alterations of the coronary vessels.105 Finally, as discussed later, molecular and cellular processes in vascular lesions and atherosclerotic plaques identified by the submillimeter resolution of MSCT coronary angiography can be delineated and characterized with PET.
Figure 25–14.
Combined imaging of the coronary anatomy with multislice computed tomography and of myocardial perfusion with rubidium82. Note the significant stenosis of the proximal left anterior descending coronary artery on the noninvasive coronary angiograms that is also seen on the invasive coronary angiogram shown in panel C (arrow). The stress perfusion images in panel D reveal a moderate to severe perfusion defect in the distribution of the left anterior descending coronary artery that resolves on the rest images. Location and extent of the stress-induced perfusion defect on the anteroseptal wall is highlighted in the surface-rendered images in red. Reproduced with permission from Groves et al.323
Whether and to what extent MSCT coronary angiography will impact the utilization of PET myocardial perfusion imaging remains uncertain at present. Multicenter comparison studies with conventional invasive coronary angiography have confirmed the high diagnostic accuracy of MSCT angiography,106-108 despite limitations in accurately portraying the true stenosis severity.109 The high negative predictive value of MSCT coronary angiography together and the very high coronary event-free survival as reported in several investigations110,111 are likely to diminish the downstream use of PET perfusion imaging, especially in individuals considered to have a low pretest likelihood for coronary risk. Conversely, high-grade stenoses noted on MSCT coronary angiography that frequently correlate with downstream perfusion defects and thus are considered fluid dynamically significant112,113 may require conventional invasive coronary angiography and therefore lessen the need for additional myocardial perfusion imaging. This especially applies to patients at high risk. However, complimentary information may be needed on the hemodynamic effect of MSCT coronary angiographically imaged vessels with only mild and nonobstructive disease or even with intermediate possibly obstructive lesions, especially in view of the reported relatively low correlation between MSCT angiographic and stress-rest perfusion findings.112,113 These comparison studies have shown that <50% of all lesions defined as obstructive on MSCT are indeed associated with stress perfusion defects on myocardial perfusion imaging. Conversely, angiographically considered mild CAD may also lead to downstream perfusion defects.
Because 13N-ammonia and 82Rb have become more widely available and because PET/CT is now widely used in clinical nuclear medicine, PET myocardial perfusion imaging has become more accessible to cardiac patients. Furthermore, perfusion imaging with PET has been approved and is reimbursed by the Centers for Medicaid and Medicare Services (CMS) and most insurance carriers. As evident from the findings in numerous clinical investigations as also reviewed earlier, PET offers high-quality myocardial perfusion images with high interpretative certainty and high diagnostic accuracy for the detection and characterization of CAD. Although fewer investigations on the prognostic value of stress-rest perfusion imaging are available for PET than for SPECT, current evidence nevertheless suggests that the prognostic information obtained with PET is at least as accurate as that available through SPECT myocardial perfusion imaging. It would also seem reasonable to extrapolate prognostic criteria established for SPECT to myocardial perfusion imaging with PET.
Because many laboratories equipped with PET also use SPECT for myocardial perfusion imaging, there is a need for identifying those patients who are likely to benefit specifically from PET perfusion imaging. The revised practice guidelines for nuclear cardiology have classified PET perfusion imaging as a level 1 indication (ie, as a well-established and clinically useful diagnostic approach).83 The guidelines also recognize the value of PET in instances where SPECT perfusion imaging studies have been nondiagnostic or of suboptimal quality.
Myocardial perfusion imaging with PET appears to be especially useful in the following conditions and individuals:
Equivocal or nondiagnostic SPECT stress-rest perfusion images
Findings on SPECT perfusion images that are inconsistent with clinical findings
Patients expected to have suboptimal SPECT perfusion images as a result of, for example, low count densities or attenuation artifacts, as is the case in obese patients or frequently in females
Patients anticipated to have only mild CAD but possibly detectable with higher spatial and contrast resolution of PET imaging
Patients with extensive and severe CAD including left main or balanced CAD
Current information indicates that the high diagnostic accuracy might reduce the need for additional diagnostic procedures including coronary angiography, especially because of the interpretive certainty of PET myocardial perfusion images with fewer equivocal studies. One study, for example, reported an only 13% downstream utilization of invasive coronary angiography in 2159 patients studied with PET compared with 31% downstream utilization for patients studied with SPECT,114 a value consistent with that reported in a report on economic consequences of available diagnostic and prognostic strategies in stable angina patients (Economics of Noninvasive Diagnosis [END] study).115
The quantitative capability of PET for measurements of myocardial blood flow has been used to explore the relationship between the angiographic stenosis severity, the hyperemic flow responses, and the vasodilator capacity.116-118 Statistically significant correlations between the anatomic stenosis severity and the attenuation of the hyperemic response to pharmacologic vasodilation have been found. Similar correlations between myocardial blood flow and coronary stenosis severity were noted for flow responses to inotropic stimulation with dobutamine.18
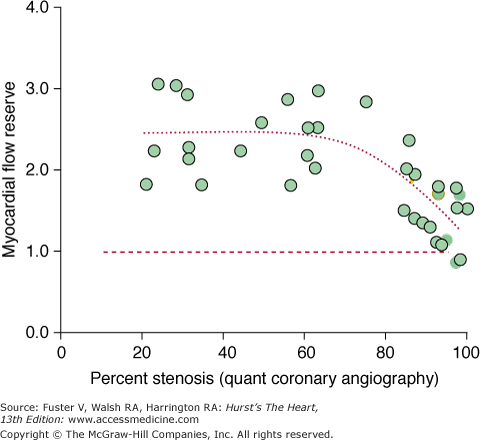
The inverse, nonlinear correlation between the cross-sectional area reduction of the stenosis and the flow reserve in the stenosis-dependent myocardium as reported in one of these investigations (Fig. 25–15)118 resembles Gould’s now classic nonlinear flow-stenosis relationship in experimental animals.119 This flow-stenosis relationship was observed after excluding confounding factors like stenosis-in-series or stenosis-dependent myocardium supplied also by collateral vessels.118 The observed scatter of the data about the regression line may reflect method-related inaccuracies in regional flow measurements, variability of the hyperemic response to pharmacologic stimulation, and differences in patients’ age and baseline hemodynamic states. The scatter of the data may further point to disparities between anatomic and functional properties of human coronary artery stenosis. Different from the experimentally controlled idealized coronary stenosis in the animal experimental setting,119 human coronary stenoses are of remarkably greater morphologic complexity including eccentricity, variable stenosis in- and outflow angles, and different lengths and irregular surfaces, all of which may not be fully appreciated by angiographic criteria or be adequately accounted for by assumptions underlying model-based estimates of stenosis severity. The scatter may further reflect differences in the functional state of the coronary circulation, as suggested by recent studies of trans-stenotic blood flows and coronary risk factors.120 This might suggest that evaluation of downstream myocardial blood flows reflects the sum of all anatomic and functional alterations of an upstream coronary stenosis. Estimates of an attenuated flow reserve obtained from static images of the relative distribution of myocardial blood flow during hyperemic stress clearly offer invaluable information on the functional significance of coronary stenoses; however, given the nonlinear response in radiotracer uptake to increases in myocardial blood flow, the “quantitative“ estimates would tend to more accurately reflect the “true“ functional significance of stenosis severity.
Figure 25–15.
Myocardial flow reserve and coronary artery stenosis severity by quantitative (Quant) angiography. Note the curvilinear relationship between the myocardial flow reserve as determined quantitatively from hyperemic and rest myocardial blood flow measurements with nitrogen 13 (13N)-ammonia. Reproduced with permission of the American Heart Association from Di Carli et al.118
Noninvasive measurements of regional myocardial blood flow offer the intriguing possibility of uncovering functional abnormalities of the human coronary circulation. If such alterations exist already during the early stages of coronary atherosclerosis, then detection of disease during its evolutionary and preclinical stage may become possible. Such measurements further offer the prospect of monitoring disease progression and the responses to interventions aimed at regression of disease or slowing or halting the disease progression. Several lines of evidence, as discussed later, support the possibility of early disease detection through PET measurements of myocardial blood flow.
Several indices of coronary circulatory function can be derived noninvasively through measurements of myocardial blood flow. One is the pharmacologically stimulated hyperemic myocardial blood flow. It reflects the total integrated vasodilator capacity of the coronary circulation and depends on the function of both vascular smooth muscle and endothelium. A second measure is the flow response to sympathetic stimulation with, for example, cold pressor testing; it predominantly depends on and thus reflects endothelial function. A third measure of coronary function is a heterogeneity of blood flow in the base-to-apex direction of the left ventricular myocardium; it is related to an impairment of the flow-mediated, endothelium-dependent vasodilation of the epicardial coronary conduit vessels and thus to endothelium dysfunction.
Numerous investigations with PET measurements of myocardial blood flow have examined effects of traditional coronary risk factors on the total vasodilator capacity and the myocardial flow reserve (as the ratio of hyperemic over baseline blood flows). Studies in asymptomatic individuals with hypercholesterolemia revealed an approximately 32% reduction in myocardial perfusion reserve or an approximately 18% reduction in adenosine-stimulated flows.121-125 Some studies found statistical significant correlations between the myocardial flow reserve and the ratio of plasma total cholesterol over HDL cholesterol121 or low-density lipoprotein (LDL) cholesterol concentrations.126 Other investigations extended these observations but also noted that elevated plasma triglycerides or, in young males, a family history of CAD alone or of hypertension was associated with diminished vasodilator capacities and flow reserves.127-129 Attenuated hyperemic flows were also found in patients with diabetes.130-133 Other factors found to modulate flow responses to pharmacologic vasodilation included oxidized LDL and homocysteine,134 asymmetric dimethylarginine (ADMA),135 and obesity.136-138
Invasive studies of the human coronary circulation have emphasized the central role of endothelial dysfunction early in the atherosclerotic process. Indeed, the endothelium has been referred to as “the cardiovascular health barometer.“139 For example, human coronary arteries with minimal atherosclerotic changes (ie, irregular intraluminal surfaces) and without flow-limiting stenosis or even without any angiographic findings but in the presence of coronary risk factors alone revealed normal predominantly vascular smooth muscle–mediated vasodilator flow responses but attenuated or even highly abnormal endothelium-mediated flow responses.140,141 These invasive approaches probe endothelial function at two sites of the coronary circulation, the large epicardial conduit and the coronary resistance vessels. Endothelium-dependent control mechanisms in concert with vascular smooth muscle–mediated vasomotion at both sites regulate changes in coronary and, thus, myocardial blood flow in response to physiologic or pharmacologic stimuli.
Observations with PET measurements of myocardial blood flow as reviewed earlier appear to differ from those made by invasive techniques where the predominantly vascular smooth muscle–mediated vasodilator response to, for example, intracoronary papaverine or adenosine was frequently fully preserved even in the presence of coronary risk factors, whereas primarily endothelium-mediated responses were markedly abnormal.142 However, as pointed out by Bache,143 the major resistance to flow through the coronary circulation resides at the 100 to 400 μ diameter vessels. If flow increases exert shear stresses on the endothelium of the <400 μ diameter vessels, then primarily flow (endothelium)-dependent mechanisms augment the flow response to predominantly vascular smooth muscle vasodilators. Consistent with such augmentation are observations with measurements of forearm blood flow and with PET of myocardial blood flow.36,l44 In both investigations in healthy volunteers, inhibition of endothelial nitric oxide synthase (eNOS) with L-NG-monomethyl arginine (L-NMMA) or NG-nitro-L-arginine-methyl ester (L-NAME) significantly reduced the adenosine-stimulated hyperemic flow (forearm blood flow by 30% and myocardial blood flow by 21%). It is thus possible that coronary risk factors, such as LDL cholesterol, triglycerides, and diabetes, known to reduce the bioavailability of nitric oxide (NO) or to impair the eNOS activity account for the attenuation of the hyperemic response to adenosine or dipyridamole as observed noninvasively with PET.
Sympathetic stimulation with cold pressor testing evokes coronary flow responses that are modulated by a complex interaction between vascular smooth muscle and endothelium and where vasodilator forces are balanced by vasoconstrictor forces. Measurements of such flow responses target endothelial function of the coronary circulation. Exposure to cold prompts an increase in heart rate and systolic blood pressure and, thus, in cardiac work, which in turn leads to a metabolically mediated decrease in coronary resistance and thus an increase in coronary blood flow. Effects of high flow velocity–related shear stress on the endothelium, possibly together with direct adrenergic stimulation, lead to an endothelium-dependent vasodilation, whereas direct, α-adrenergically mediated, vascular smooth muscle stimulation leads to vasoconstriction. In this interplay between opposing forces, vasoconstrictor effects prevail if endothelial function is impaired and attenuate the flow responses to cold stimulation.
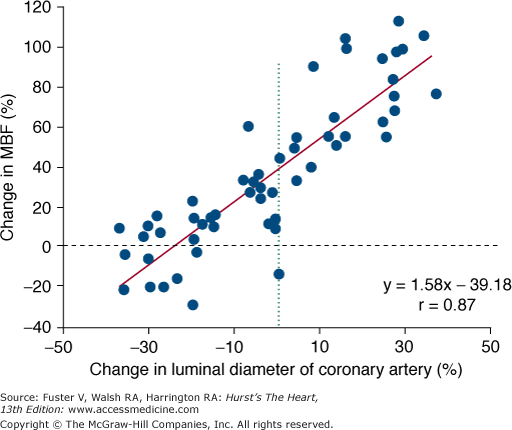
The observed paradoxical decrease rather than increase in luminal diameter of mildly diseased epicardial coronary artery and the increase rather than decrease in coronary resistance with cold pressor testing lend support to the preponderance of vasoconstrictor forces at the level of the coronary conduit and the resistance vessels when endothelial dysfunction is present.140,141,145-147 Findings with invasive coronary flow measurements further support the value of the flow response to cold as a measure of endothelial function. For example, responses of the coronary resistance to direct endothelium stimulation with intracoronary acetylcholine were found to correlate with resistance changes induced by cold pressor testing,148 indicating that flow responses to cold stimulation are related to endothelial function at the level of the resistance vessels. Furthermore, cold-induced responses of myocardial blood flow measured with PET were found to correlate with changes in the conduit vessel diameter, demonstrated by quantitative angiography.149 In individuals with angiographically normal coronary arteries, changes in the epicardial coronary artery diameter as an index of endothelium-related coronary vasomotion were found to be correlated strongly with cold-induced changes in myocardial blood flow (Fig. 25–16).
Figure 25–16.
Correlation between cold pressor–induced changes in the luminal diameter of the epicardial coronary arteries (determined by quantitative coronary angiography) and myocardial blood flow (MBF) (measured with nitrogen 13 [13N]-ammonia and positron emission tomography). Adapted with permission from Schindler et al.149
Observations in normal individuals but with long-term smoking as the only well-defined coronary risk factor further confirmed such possibility. The dipyridamole-stimulated hyperemic flow response was fully preserved, whereas cold stimulation produced only modest and statistically insignificant increases in myocardial blood flow.150 These observations with PET measurements of myocardial blood flow are consistent with those by invasive techniques.140,141,151 Cold-induced increases in rate pressure product in these studies were associated with proportional increases in myocardial blood flow in nonsmokers but not in smokers. A similar uncoupling of flow responses from cardiac work was also noted in patients with risk factors for CAD or with type 2 diabetes.152,153
That the diminished or absent flow response to cold in smokers reflected a functional rather than structural alteration of vasomotor control appears to be supported by the effect of intravenous administration of L-arginine as the substrate for NO, which fully restored the flow response.154 Mechanisms accounting for this improvement remain uncertain but, as mentioned later, might involve interference with eNOS activity, a competitive displacement of the eNOS inhibitor ADMA, or an insulin-mediated effect, especially because intravenous L-arginine infusion was associated with a significant increase in plasma insulin concentrations.
Findings are similar in individuals with insulin resistance of different degrees of severity. Although the total vasodilator capacity was diminished in patients with type 2 diabetes with and without hypertension as the most severe forms of insulin resistance, it was fully preserved in individuals with less severe forms of insulin resistance, including individuals with normal fasting glucose levels or abnormal glucose handling.155 Importantly, however, flow responses to sympathetic stimulation with cold pressor testing were already significantly diminished in the mildest forms of insulin resistance and progressively worsened with more severe states of insulin resistance. Endothelial dysfunction in these milder forms of insulin resistance does not diminish the total vasodilator capacity (Fig. 25–17). Possible factors accounting for the progressive functional decline include effects of insulin resistance alone on the endothelium, but also of hypercholesterolemia and hypertriglyceridemia as associated with insulin resistance and hyperglycemia-related oxidative stress. These factors may exert a cumulative effect on the function of both endothelium and vascular smooth muscle and thus, as also demonstrated previously for other coronary risk factors,141,156 account for the observed progressive impairment of coronary vasomotor function in insulin-resistant states.
Figure 25–17.
Coronary circulatory function in insulin resistance of increasing severity. Myocardial blood flow (MBF) was measured during pharmacologically induced hyperemia (top panel) and in response to cold pressor testing in 19 normal, insulin-sensitive individuals (IS), in 47 normoglycemic insulin-resistant individuals (IR), in 25 individuals with impaired glucose tolerance (IGT), in 21 patients with type 2 diabetes mellitus (DM), and in 8 patients with type 2 diabetes mellitus and hypertension (DM+HTN). As indicated in the toppanel, hyperemic myocardial flows were significantly attenuated only in patients with diabetes mellitus, whereas, as shown in the lower panel, the flow response to cold pressor testing (defined as the change in myocardial blood flow, ΔMBF) from rest to cold pressor testing was already attenuated in normoglycemic insulin-resistant individuals. Adapted with permission from Prior et al.155
Reproducibility of the flow measurements is critical to the use of cold pressor testing for monitoring responses to drug interventions and to risk factor modification. Studies in normal individuals with and without risk factors for CAD have indeed established the reproducibility of such measurements. One study in 20 participants reported repeatability coefficients of 0.46 mL/min/g and 0.51 mL/min/g for 15O-water–measured myocardial blood flows during cold pressor testing, measured twice during the same study session.157 Another study with 13N-ammonia blood flow measurements in 20 normal individuals evaluated the reproducibility of flow response to cold pressor testing (change in myocardial blood flow) during the same study session and in a repeat study 2 weeks later. For the flow response to cold pressor testing, the repeatability coefficient was 0.19 mL/min/g for the short-term (same study session) measurement and 0.6 mL/min/g for the long-term (2 weeks later) repeat measurement.158
Stay updated, free articles. Join our Telegram channel

Full access? Get Clinical Tree


