Phase Contrast Flow Quantification in the Heart
Many of the physical principles of phase contrast MRI have been presented already in Chapter II-3, and the reader is encouraged to review that chapter. Here, the emphasis turns to cardiac applications, where phase contrast MRI can be viewed as the equivalent to Doppler echocardiography for assessment of flow. A review of the specific physical concepts that relate to cardiac applications is covered first, followed by discussions of applications to the cardiac patient.
PHASE CONTRAST MRI OR “DOPPLER MRI”
MR cine phase contrast provides information very similar to Doppler ultrasonography or echocardiography. On phase images, signal intensity is velocity encoded, so that the images are velocity maps. Unlike Doppler images, phase contrast images are in black and white, where the gradations of signal intensity reflect velocity. On phase contrast images, no flow (velocity = 0) has the appearance of a middling shade of gray (Figure III6-1). Darker signal corresponds to flow in one direction, while brighter signal reflects flow in the opposite direction.
The pulse sequences can be designed to measure in-plane flow (two-dimensional velocity encoding) or through-plane flow (one-dimensional velocity encoding). The serial application of flow-encoding gradients in mutually orthogonal directions makes in-plane and three-dimensional phase contrast flow quantification measurements time consuming. Most examples in this chapter are through-plane measurements. Phase contrast sequences are usually gated to the cardiac cycle and generate multiple magnitude and phase images at different time points throughout the cardiac cycle.
KEY CONCEPTS
[right half black circle] Phase contrast MRI can be used like Doppler echocardiography to measure flow in the heart and great vessels.
[right half black circle] Phase contrast flow quantification assumes a nearly constant velocity of protons within a voxel during each frame.
[right half black circle] Higher-order flow (acceleration and jerk) results in inaccurate measurements of velocity.
[right half black circle] ECG-gated acquisitions should use view-sharing options, if available, to improve the apparent temporal resolution to 50 msec or better.
[right half black circle] The maximum velocity through a stenosis can be determined using phase contrast and used to estimate pressure gradient using the modified Bernoulli equation.
[right half black circle] Cardiac applications of phase contrast flow quantification include peak velocity measurements for pressure gradient calculations and volume flow rate measurements for regurgitant fractions, pulmonary-systemic shunt ratios, and stroke volumes.
[right half black circle] Clinical Protocols:
[right half black circle] Aortic valve disease
[right half black circle] Shunt fraction quantification
CHALLENGE QUESTION: In Figure III6-1, what does the black signal during diastole in the ascending aorta signify?
View Answer
Answer: The black signal indicates normal flow reversal in the ascending aorta during diastolic filling of coronary arteries. In aortic insufficiency, which will also have this appearance, the diastolic reversal is present regardless of whether the slice plane is positioned above or below the coronary artery ostia and can be confirmed on cine gradient echo images in the left ventricular outflow tract view as a regurgitant jet of low signal (Figure III4-18 and Figure III4-20).
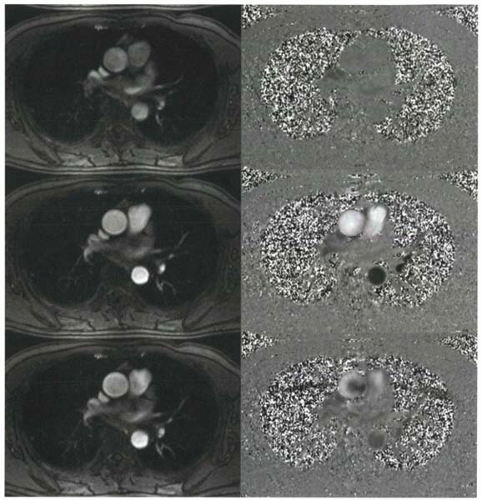 FIGURE III6-1. ECG-gated cine phase contrast magnitude (left) and phase (right) images during end diastole (top), peak systole (middle), and early diastole (bottom). On phase images, bright signal intensity corresponds to cephalad flow, while black signal corresponds to caudal flow. The gray signal intensity of the chest wall reflects stationary tissue, and the mottled appearance of the lungs and air outside the chest is primarily image noise. |
The magnitude images of phase contrast acquisitions (Figure III6-1) are identical to the standard cine gradient echo images that have been discussed in Chapter III-4. By defining anatomy, these images help localize signal on phase contrast velocity maps.
CARDIAC CINE PHASE CONTRAST MR: THE PULSE SEQUENCE
The principles of cardiac cine phase contrast MR sequences are identical to those described for vascular applications in Chapter II-3. Fundamental concepts are reviewed next, with an emphasis on considerations specific to cardiac applications.
Flow-Encoding Gradients
The basic principle of phase contrast flow quantification is that protons that move at a constant velocity and are exposed to a flow-encoding gradient (such as a standard bipolar gradient) will accumulate a phase shift that is proportional to their velocity. To correct for phase errors that are introduced by magnetic field inhomogeneities, all phase contrast sequences require two separate acquisitions, each with a different set of flow-encoding gradients (Chapter II-3).
Before considering the details of cine phase contrast MRI, it is important to discuss the assumption about constant velocity. During the systolic portion of the cardiac cycle, blood flow is rarely constant—it accelerates and decelerates. How valid are velocity measurements? The assumptions about constant velocity hold true, provided the temporal resolution of the acquisition is high compared with the time frame of velocity changes. In the setting of normal pulsatile flow, blood can be approximated as having a constant velocity within a given sampling interval. If blood acceleration is too high, such as in the setting of stenoses, then the error in velocity using phase contrast flow quantification will be greater. Note that a similar assumption is needed for Doppler ultrasound measurements of flow. Doppler shifts are assumed to reflect constant velocity of blood, and higher-order flows are neglected.
View Answer
Answer: Stenotic valves and vessels cause turbulent blood flow. Associated with turbulence are high rates of acceleration and also jerk. Conventional velocity-encoded phase contrast measurements will underestimate the velocities of blood. Intravoxel dephasing causes further signal loss with these complex patterns of flow.
Venc
The relationship between phase shift and velocity depends on the strength and duration of the flow-encoding gradients. Recall that the Venc, or encoding velocity, is the velocity associated with a phase shift of + 180°. The range of measurable velocities is ±Venc or from −Venc to +Venc. On the phase contrast images, protons moving away from the viewer at a velocity equal to the Venc will have the highest signal intensity. Protons moving in the opposite direction, at a velocity that approaches −Venc, will be shown with the darkest signal intensity (Figure II3-5).
IMPORTANT CONCEPT:
The encoding velocity, Venc, allows the user to define the range of measurable velocities with a phase contrast acquisition, typically ±Venc.
ECG Gating for Cine Acquisitions
For quantification of flow in cardiac applications, measurements are performed either through the great vessels or through the pulmonary arteries or veins; intracardiac measurements are also possible. Segmented k-space sequences are routinely used. The higher the number of segments, the shorter the overall acquisition time. With a higher number of segments, however, the temporal resolution is reduced. As discussed in Chapter II-3, for accurate measurements of peak systolic velocity, the acquisition must have sufficient temporal resolution, preferably less than 50-60 msec.
One important consideration in cardiac phase contrast applications is the effect of motion of the heart during the cardiac cycle. With commercial implementations of phase contrast sequences, the slice position is stationary over the acquisition, but in a beating heart the slice position may image a different slice of the heart across the acquisition period (Figure III6-2). For example, at the aortic root, measurements of flow above the coronary artery orifices differ from those below. Acquisitions at the aortic root should be positioned so that cardiac motion does not result in acquisition slices varying considerably during the cardiac cycle, particularly with reference to the coronary ostia. Flow across the mitral or tricuspid valve orifice can be similarly difficult to measure because of cardiac motion. When accuracy in positioning is critical, scout positions and acquisitions must be obtained in the same phase of suspended respiration, recognizing that scout images are typically obtained with the heart in diastole.
View Sharing
Using a sufficiently high number views per segment ensures a short acquisition time (<20 sec) and yields an
approximately 100 msec temporal resolution of a conventional phase


approximately 100 msec temporal resolution of a conventional phase
Stay updated, free articles. Join our Telegram channel
Full access? Get Clinical Tree
