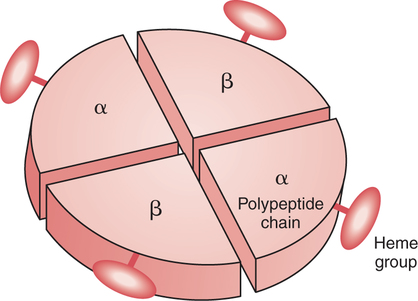
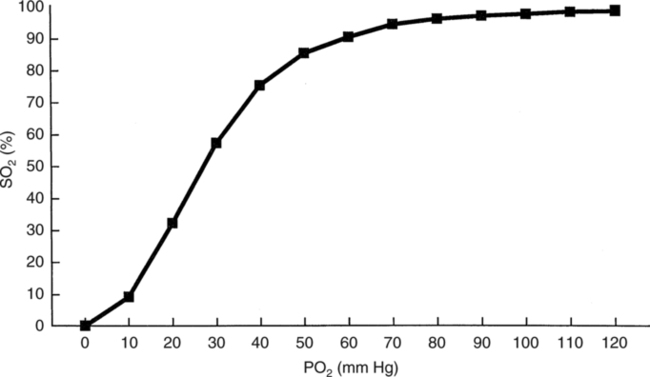
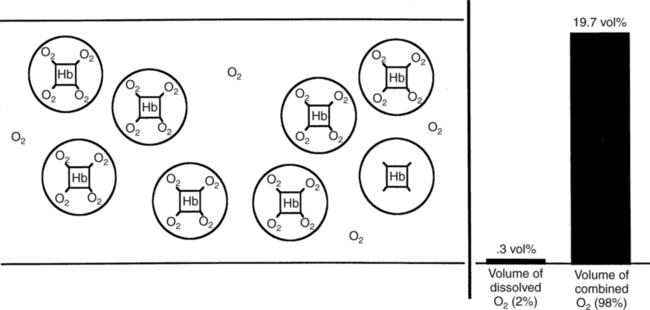
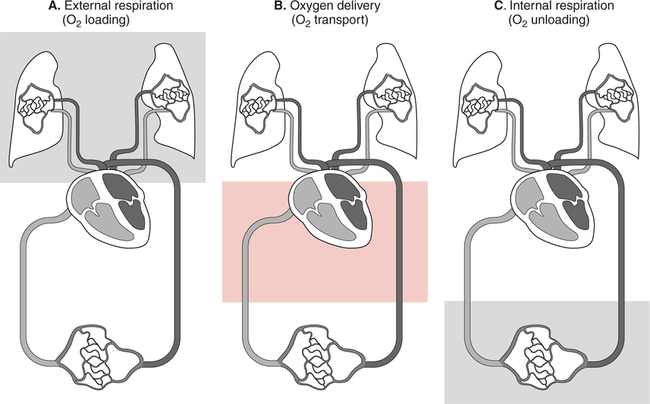
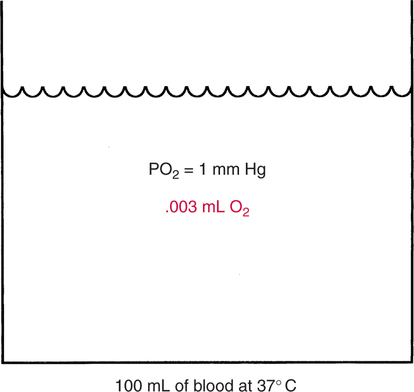
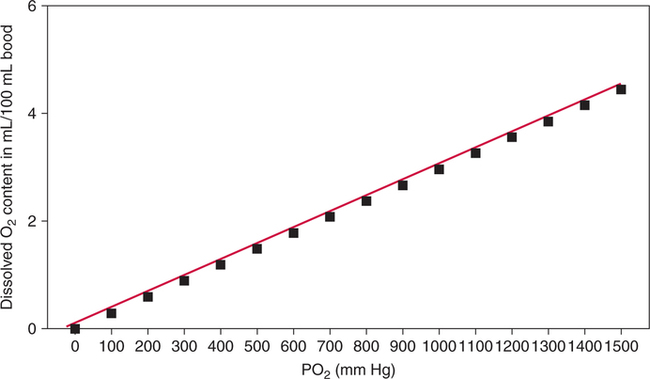
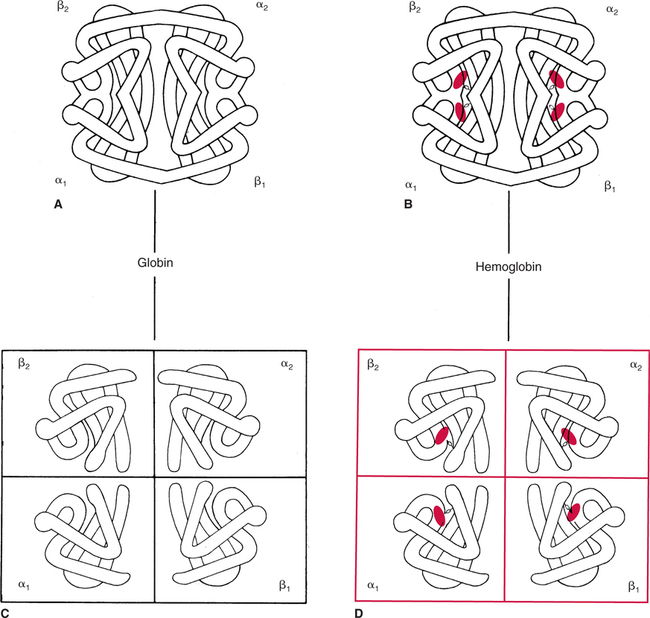
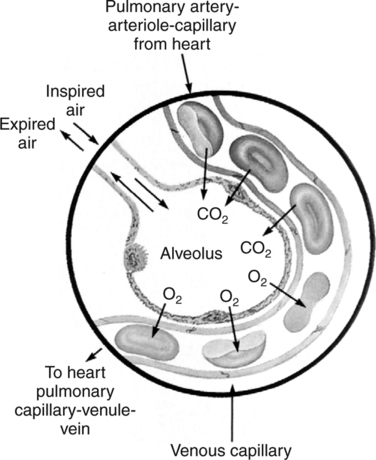
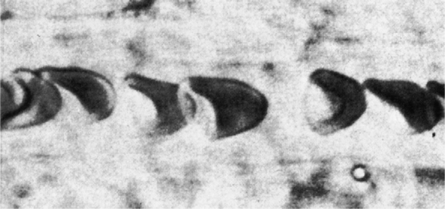
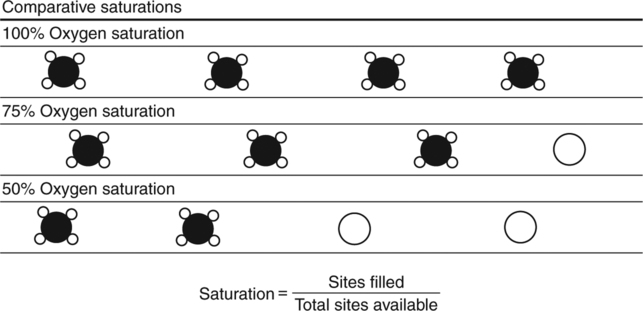
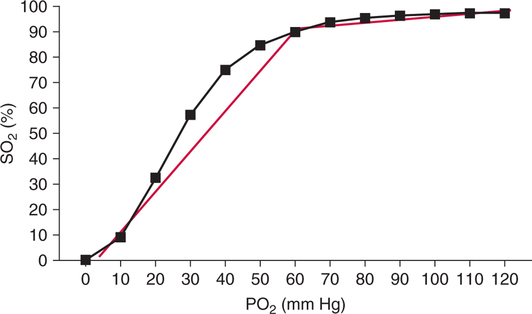
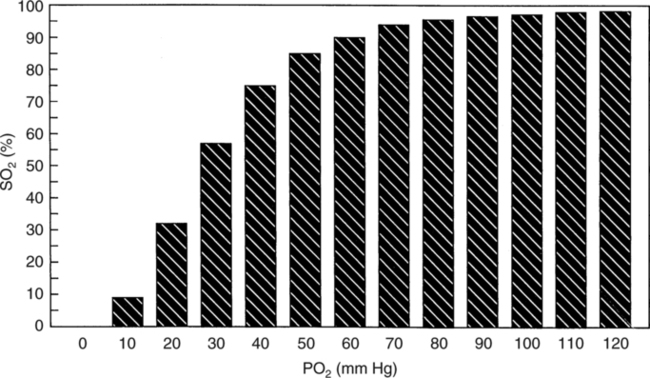
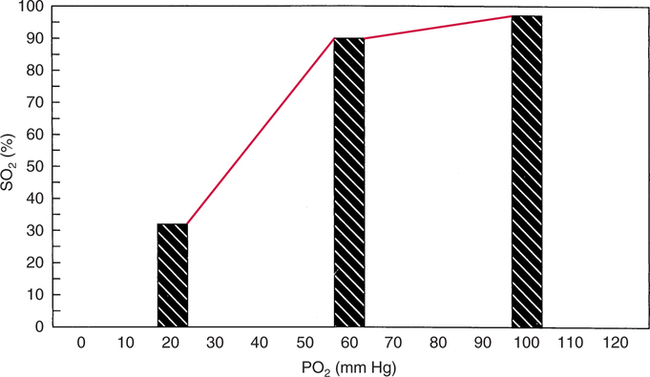
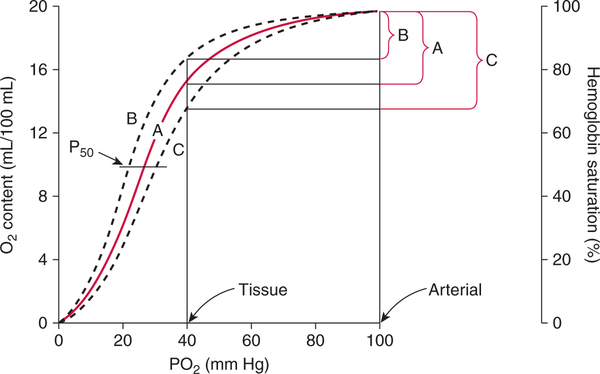
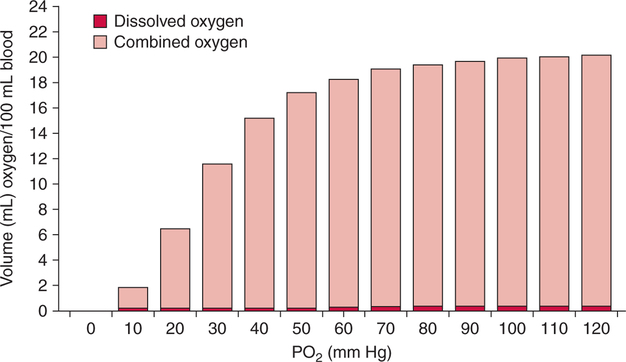
The first step in delivering oxygen to the tissues, external respiration and oxygen loading into the blood, has been discussed in detail in Chapter 6. The second step in tissue oxygenation is oxygen transport as shown in Figure 7-1,B. In this chapter, we will explore basic physiology and pathology as it relates to oxygen transport. Finally, in the last section of this chapter, we will explore internal respiration, the final link in the oxygenation system. Internal respiration and oxygen unloading to the tissues will include the release and use of oxygen by the cells (see Fig. 7-1,C). As described in Chapter 3, gases may diffuse freely between liquid and gaseous phases depending on the difference in partial pressure between the two phases. This principle is important in external respiration because the alveolar- capillary unit is essentially a liquid-gas interface. The partial pressure of oxygen in a freshly ventilated alveolus is greater than the partial pressure of oxygen in the blood. Thus, when blood is exposed to alveolar gas, the partial pressure of oxygen increases in the blood until it equilibrates with the alveolus. Oxygen present in the blood in this uncombined or free state is referred to as dissolved oxygen or oxygen in physical solution. The solubility coefficient of oxygen in blood at 37° C is 0.003 mL of O2/100 mL of blood/mm Hg As shown in Figure 7-2, this means that in a 100-mL blood sample, 0.003 mL of oxygen are dissolved for every 1 mm Hg of oxygen partial pressure. The unit vol% is usually used instead of the more cumbersome milliliters of gas per 100 mL of blood. Thus, 2 vol% of oxygen in the blood is equivalent to 2 mL of oxygen in 100 mL of blood. There is a linear relationship between arterial PO2 and the volume of oxygen dissolved in arterial blood. If 0.003 vol% is present when the PO2 is 1 mm Hg, 0.006 vol% is present when the PO2 is 2 mm Hg (0.003 vol% × 2). It follows then that 0.3 vol% of oxygen is present when PO2 is 100 mm Hg. The direct, linear relationship between PO2 and the volume of oxygen dissolved in the blood persists as PO2 increases still further to very high levels (Fig. 7-3). Chemically, normal adult hemoglobin (HbA) is made up of a heme group and a protein group (globin). The Hb molecule is very large and has a molecular weight of 64,500. Globin alone consists of four chains of amino acids: two alpha chains, each made up of 141 amino acids; and two beta chains, each comprised of 146 amino acids. These long rows of amino acids are called polypeptide chains. The four independent polypeptide chains are shown schematically in Figure 7-4,B, and also their integration into globin (see Fig. 7-4,A). A heme group is combined with each one of these amino acid chains. Each heme group, in turn, is made up of a porphyrin and iron (Fe). Oxygen actually combines with hemoglobin at the site of this iron. Oxygen and iron form a loose bond in this reversible reaction because iron remains in the ferrous (Fe2+) state. Because there are four iron sites, each Hb molecule can carry four oxygen molecules (see Fig. 7-4,C and D). A further simplified schematic of normal HbA is shown in Figure 7-5. Hb resides in red blood cells (erythrocytes) where it accounts for approximately one third of the intracellular space. This pigment (i.e., Hb) is also responsible for giving blood its characteristic red color. It is in tremendous supply in the body, and one erythrocyte contains as many as 280 million molecules.10 The normal concentration of hemoglobin [Hb] is 15 g/100 mL blood in men and 13 to 14 g/100 mL blood in women. The erythrocytes are biconcave discs approximately 7 μm in diameter. Technically, they are corpuscles rather than cells because they extrude their nuclei just before they mature. Remarkably, the size and flexibility of erythrocytes allow them to pass through the pulmonary capillaries in single file. Figure 7-6 shows erythrocytes passing through a capillary single file. Due to their flexibility, as they pass through, they actually assume a parachute-like shape (Fig. 7-7). In the adult, erythrocytes are produced primarily in the bone marrow under the control of the hormone erythropoietin. Erythropoietin is secreted primarily in the kidney; however, small quantities are also produced in the liver.222 The secretion of erythropoietin may increase 100-fold or more in the presence of anemia.223 Molecular biologists have been able to synthesize erythropoietin; recombinant human erythropoietin (Epoetin) became available in 1985.223 Recombinant human erythropoietin has been shown to be effective in the treatment of anemia secondary to renal (kidney) failure.222 Moreover, synthetic erythropoietin has also shown promise in the treatment of sickle cell disease, anemia of prematurity, and even as a substitute for transfusion.224 225 226 Its effectiveness has even caused concern related to its potential abuse to enhance athletic performance.227 As stated earlier, each hemoglobin molecule is capable of combining with four oxygen molecules. The affinity of hemoglobin for additional oxygen molecules is increased after combination with each single oxygen molecule.81 Thus, hemoglobin tends to combine with either four oxygen molecules or none (i.e., it is either carrying oxygen or it is not). Thus, we can think of hemoglobin as being either saturated (oxygenated) or desaturated (unoxygenated). Oxygenated hemoglobin is called oxyhemoglobin. Unoxygenated hemoglobin is called deoxyhemoglobin or reduced hemoglobin, although the latter term is chemically incorrect.10 81 The percentage of hemoglobin that is carrying oxygen in arterial blood is called oxygen saturation of arterial blood (SaO2) or simply saturation (Fig. 7-8). Saturation is a measure of oxygen in the combined state. One must remember, however, that this is only a percentage of available hemoglobin and is in no way a measure of the actual quantity of hemoglobin present. The percentage of hemoglobin that actually carries oxygen depends on several factors, but most importantly on the partial pressure of oxygen (PO2) in the blood. There is a direct, but not linear, relationship between PaO2 and SaO2. If one were to expose 100 molecules of hemoglobin in blood to progressive increases in PO2 and to plot the SO2 at each PO2, a curve similar to that shown in Figure 7-9 would result. This S-shaped curve has tremendous physiologic significance and is known as the oxyhemoglobin dissociation curve. At low PO2 values (i.e., <60 mm Hg), small increases in PO2 would result in relatively large increases in SO2. For example, 50% of the hemoglobin molecules would be oxygenated at a PO2 of only 26 mm Hg (Fig. 7-10). As PO2 is elevated to 40 mm Hg, saturation increases substantially to approximately 75%. Furthermore, this general trend continues as PO2 increases to 60 mm Hg where the corresponding saturation is 90%. Beyond a PO2 of 60 mm Hg, however, saturation increases very slowly and does not reach 100% until approximately 250 mm Hg.81 The oxyhemoglobin dissociation curve closely approximates two straight lines (Fig. 7-11); a rather steep line from PO2, 0 to 60 mm Hg, and a straight flat line above 60 mm Hg. The critical difference between the two portions is that on the steep lower portion of the curve, a small change in PO2 is associated with a large change in oxygen saturation. Conversely, on the flat upper portion, a large change in PO2 is associated with only a small change in SO2. The effect of PO2 on saturation may be more readily visualized when saturation is plotted as a bar graph, as shown in Figure 7-12. This concept can be further illustrated if we compare the effect on saturation of an identical PO2 change on the two portions of the curve (Fig. 7-13). When PO2 increases 40 mm Hg from 20 to 60 mm Hg, saturation increases from approximately 35% to 90% (total of 55%). Thus, on the steep lower portion of the curve there is a large change (55%) in saturation for a relatively small change (40 mm Hg) in PO2. Conversely, when PO2 increases 40 mm Hg from 60 to 100 mm Hg, saturation increases from 90% to 97% (total 7%). Thus, on the flat upper portion of the curve there is a small change (7%) in saturation for a relatively large change (40 mm Hg) in PO2. Obviously, this same principle holds true when PO2 decreases on the respective portions of the curve. Comprehending this critical difference is the essence of understanding the physiologic implications of this curve. The association (i.e., combination) of oxygen with hemoglobin occurs in the lungs as the PO2 increases from 40 mm Hg in mixed venous blood to approximately 100 mm Hg. Because the end of oxygen loading into the blood occurs on the flat, upper portion of the curve, it is sometimes referred to as the association portion of the curve. Conversely, the steep lower portion of the curve is sometimes referred to as the dissociation portion of the curve because the end of oxygen unloading occurs on this portion as PaO2 decreases from 100 to 40 mm Hg in the systemic capillaries (see Fig. 7-11). The association part of the curve is important in the lungs, whereas the dissociation part of the curve is important in the tissues. P50. The oxyhemoglobin dissociation curve is a graphic representation of how PO2 normally affects the combination of oxygen with hemoglobin. The specific affinity of oxygen for hemoglobin can be quantitated by evaluating what partial pressure of oxygen is necessary to achieve 50% saturation. This standardized index of Hb-O2 affinity that is measured at 37° C, PCO2 of 40 mm Hg, and a pH of 7.40 is called the P50.184 Normal P50 is about 26 mm Hg, approximately 27 mm Hg in women and 25 mm Hg in men.185 In other words, 26 mm Hg of oxygen pressure is normally required to oxygenate 50% of the hemoglobin (see Fig. 7-10). At least four factors are known to alter Hb-O2 affinity. As shown in Figure 7-14, temperature, pH, or PCO2 may shift the oxyhemoglobin curve. In addition, the concentration of the substance 2,3-diphosphoglycerate (DPG) within the erythrocyte is similarly known to affect Hb-O2 affinity. Affinity of oxygen for hemoglobin increases when there is a decrease in temperature, hydrogen ion concentration, PCO2, or DPG (Box 7-1). A decrease in hydrogen ion concentration is associated with an increased pH. Conversely (see Fig. 7-14), Hb-O2 affinity is decreased when there is an increase in temperature, hydrogen ion (decreased pH), PCO2, or DPG (Box 7-2). Decreased Hb-O2 affinity and a shift of the curve to the right, on the other hand, generally enhances oxygen delivery to the tissues and is often a valuable compensatory mechanism. Figure 7-15 shows the amount of oxygen that is released to the tissues with various positions of the curve and assuming a normal PaO2 and mixed venous PO2 (P In conclusion, although a shift of the curve to the left tends to enhance the combination of hemoglobin with oxygen, it may be detrimental to the patient because the release of oxygen to the tissues will be impeded. On the other hand, a shift to the right is usually beneficial because the release of oxygen to the tissues is enhanced. This benefit may be negated, however, when PaO2 is less than 60 mm Hg. When hypoxemia is present, shifts of the curve to the right may substantially decrease oxygen loading into the blood, and this factor may outweigh any benefits in terms of oxygen unloading.186 Organic phosphates represent a chemical group normally present in erythrocytes. These organic phosphates tend to bind with hemoglobin and thus reduce affinity of hemoglobin for oxygen.187 188 A decrease in Hb-O2 affinity will, of course, shift the oxyhemoglobin dissociation curve to the right. Therefore, the large amounts of organic phosphates present within the erythrocytes are generally considered to be beneficial. The most important inorganic phosphate is DPG, primarily because it is the most abundant.185 189 Furthermore, changes in DPG tend to have a sustained effect on Hb-O2 affinity whereas the shift of the curve to the right that accompanies an increased hydrogen ion concentration, for example, lasts for only a few hours.185 A twofold increase in DPG, which could occur clini- cally, would greatly enhance oxygen unloading to the tissues. A twofold increase in DPG would increase P50 by 10 mm Hg (e.g., P50 = 36 mm Hg). DPG increases in various situations and appears generally to be an adaptive mechanism in hypoxic insults. Several conditions that have been associated with high DPG levels are shown in Box 7-3. DPG increases relatively quickly as a compensatory mechanism. Measurable increases in DPG may be seen within 60 minutes after strenuous exercise.189 The increase in DPG enhances oxygen unloading and helps to offset deficiencies in the transport or loading of oxygen. Con- versely, DPG concentrations may be less than normal in several conditions such as those shown in Box 7-4. Septic shock is a cardiovascular problem associated with bacterial infection of the blood. Acidemia is a below-normal pH of the blood. The fact that acidemia decreases DPG levels probably explains why high DPG levels are not seen consistently in acute crisis of patients with COPD.190 The increased DPG associated with hypoxemia in these patients may be offset by the decreased DPG associated with acidemia. Probably the most common clinical cause of DPG deficiency, however, is the intravenous infusion of stored blood into a patient. DPG decreases rapidly in blood stored in acid-citrate dextrose preservative and falls to approximately one-third of normal after approximately 1 week of storage.191 Within 2 weeks of storage at 4° C, DPG is almost completely absent.192 Nevertheless, low DPG levels would not preclude a transfusion in a patient who is anemic. It is possible to restore DPG in stored blood to normal levels within 30 minutes, which can be accomplished by incubating the blood with inosine, pyruvate, and phosphate.192 This procedure is not clinically useful, however, because inosine has been associated with adverse effects when administered intravenously.189 Furthermore, DPG levels increase to approximately 50% of normal in approximately 24 hours after the administration of the blood.193 The total volume of oxygen present in arterial blood is called arterial oxygen content (CaO2). The oxygen content can be calculated by adding the volume of oxygen present in the two blood compartments, as shown in Box 7-5. The volume of dissolved oxygen in arterial blood is calculated by multiplying the PaO2 by the solubility coefficient of oxygen in blood (CsO2 = 0.003 mL O2/100 mL blood/mm Hg). The normal volume of oxygen dissolved in arterial blood is approximately 0.3 vol% (0.3 mL O2/100 mL of blood), which is calculated in Box 7-6. Box 7-5 Arterial Oxygen Content To calculate the volume of combined oxygen in arterial blood, one must know the hemoglobin concentration [Hb], arterial oxygen saturation (SaO2), and the oxygen-carrying capacity of hemoglobin. The oxygen-carrying capacity of hemoglobin is a constant value of 1.34 mL O2/g HbO2.81 Theoretical calculations suggest that this value should be 1.39 mL O2/g HbO2; however, this amount is never achieved in humans because of the presence of hemoglobin variants.185 Thus, in calculations here, it is assumed that for every gram of oxygenated hemoglobin, 1.34 mL O2 is present. The formula for calculating the volume of combined oxygen is shown in Box 7-7. SaO2 is multiplied by the [Hb] to determine the amount of oxygenated hemoglobin present. Then, the HbO2 in grams is multiplied by the oxygen- carrying capacity of hemoglobin to determine the volume of oxygen in the combined state. Assuming a normal [Hb] of 15 g% and an SaO2 of 98%, the volume of combined oxygen in arterial blood is approximately 19.7 vol%. Finally, the CaO2 is equal to the sum of dissolved and combined oxygen (Box 7-8). Normal CaO2 is approximately 20 vol%. Approximately 98% of the oxygen in the blood is in the combined state (Fig. 7-16). For this reason, CaO2 correlates very closely with SaO2 and the oxyhemoglobin dissociation curve as shown in Figure 7-17. PaO2, on the other hand, only reflects blood oxygen volume indirectly. Obviously, venous blood returning to the heart will contain less oxygen than arterial blood. As discussed in Chapter 3, peripheral venous blood varies in its oxygen volume depending on the specific tissue it is returning from. Mixed venous blood, however (available only from a pulmonary artery catheter), is an average of all venous blood and normally has a P
Oxygen Transport and Internal Respiration
INTRODUCTION
BLOOD OXYGEN COMPARTMENTS
Dissolved Oxygen
Solubility Coefficients
Linear PO2–Dissolved Oxygen Relationship
Combined Oxygen
Hemoglobin
Saturation
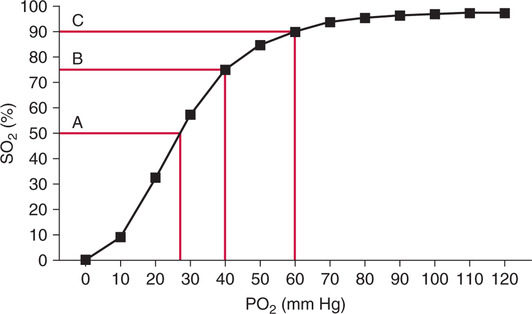
Oxyhemoglobin Dissociation Curve
Association/Dissociation Portions
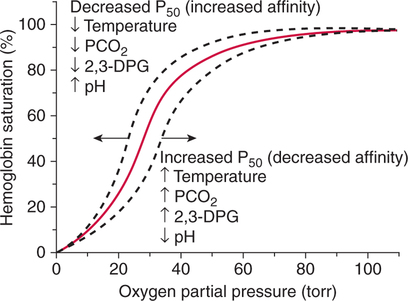
Oxyhemoglobin Affinity/P50
Shifts of the Curve
Clinical Effects of Hb-O2 Curve Shifts
 O2). The amount of oxygen released to the tissues is least when the curve is shifted to the left (see Fig. 7-15,B). Conversely, the amount of oxygen released to the tissues is greatest when the curve is shifted to the right (see Fig. 7-15,C). A shift of the curve to the right in an individual with a PaO2 of 90 mm Hg and a normal P
 O2 of 40 mm Hg could enhance oxygen release to the tissues by as much as 60%.186
2,3-Diphosphoglycerate
Increased 2,3-Diphosphoglycerate.
Decreased 2,3-Diphosphoglycerate.
Oxygen Content
Arterial Oxygen Content
Mixed Venous Oxygen Content
 O2 of approximately 40 mm Hg and an S
 O2 of 75% (see Fig. 7-10). The oxygen content of mixed venous blood can thus be calculated by adding dissolved oxygen and combined oxygen, which is shown in Box 7-9.
![]()
Stay updated, free articles. Join our Telegram channel

Full access? Get Clinical Tree


Oxygen Transport and Internal Respiration
 O2 × CsO2