Accuracy Check and Metabolic Acid-Base Indices


Accuracy Check and Metabolic Acid-Base Indices


ACCURACY CHECK


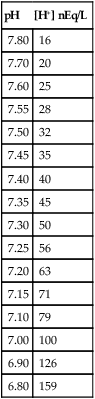
The novice in blood gas application must master Chapter 2 before addressing the content in this chapter. Indeed, Chapter 5 deals with the less frequent and more subtle technical nuances of blood gas classification and analysis and may lead to confusion if routine blood gas classification is not fully understood. This chapter is intended for use when the clinician is faced with some real or perceived inconsistency in the reported information.


From an educational perspective, some instructors or clinicians may prefer to skip this chapter until a solid foundation of clinical blood gas interpretation is assured. Again, this chapter addresses primarily the recognition of “exceptions” to normal blood gas classification and interpretation and may be more suitable as supplementary reading, reference, or advanced study.


Fortunately, the types of technical errors discussed herein are less common than in the past. In most state-of-the-art blood gas laboratories, blood gas results are directly printed to a report from the blood gas measurement device. These direct printouts preclude the possibility of human errors in transcription or oral reporting. The data on direct printouts can generally be assumed to be accurate assuming controls and safeguards discussed in previous chapters are adhered to. Notwithstanding, occasional errors still may occur and result in inappropriate diagnosis or treatment if they are not recognized.


The present chapter is included in this text for completeness, comprehensiveness, and critical analysis. Literal life-and-death decisions are made based on blood gas data. Errors in the diagnosis or management of acid-base or oxygenation status may have dire consequences. Therefore, individuals who are responsible for these decisions must have a thorough understanding of each index and the normal inter-relationships between them. One must be able to detect inaccurate data, or explain and interpret seemingly inconsistent information.


Thus, at some point during the assessment of blood gas data, the clinician should briefly pause and consider the plausibility, consistency, and harmony of the various recorded data. Assessment of the consistency of the reported measurements is recommended in comprehensive and systematic acid-base assessment by most experts.176 To ensure accuracy, blood gas values should be evaluated for internal consistency and external congruity.


Internal Consistency


Techniques for Evaluating Internal Consistency


Most often, gross inspection of blood gases facilitates the detection of internal inconsistencies. Conceptually, acidemia (i.e., pH < 7.35) cannot be present in the absence of a causative acidosis (i.e., PaCO2 > 45 mm Hg and/or [HCO3] < 22 mEq/L). Likewise, alkalemia cannot occur without alkalosis. Another type of gross inconsistency might be the presence of a normal pH with concurrent respiratory and metabolic acidosis. Here again, this combination of circumstances is impossible. Once the basic relationship between acidosis and acidemia is understood, most gross errors in blood gas data are easily and readily recognized.


Occasionally, technical error is less obvious. In these cases, the blood gas values generally make sense but something doesn’t seem exactly right. Example 5-1 may serve as an example.


Example 5-1


pH 7.60
PaCO2 30 mm Hg
[HCO3] 23 mEq/L


Example 5-1 is not internally consistent. The pH is too high given a PaCO2 of 30 mm Hg and essentially normal metabolic status. Actually, the pH must be approximately 7.50. Failure to detect this inconsistency could have undesirable diagnostic or therapeutic consequences. A pH of 7.60 indicates severe alkalemia and should be cause for serious concern. A pH of 7.50 is common in the intensive care unit and most often requires no intervention.


The following discussion explores four methods that can be used to assess internal consistency when errors may be more subtle. These methods are indirect metabolic assessment, the rule of eights, the modified Henderson equation, and an acid-base map. All of these methods make use of the principle that the three acid-base components (i.e., pH, PaCO2, and [HCO3] or alternatively [BE]) are interrelated such that if two components are known, the third component can be deduced.


Acute PaCO2–pH Relationship

To simplify these relationships for a moment, assume that all metabolic factors are normal and constant. Under these circumstances, any deviation of pH from normal must be a result of a change in respiratory status. If it was known exactly how much a given acute change in PaCO2 would alter pH, then the precise pH that would be present with a given PaCO2 could be predicted.


Assuming normal, constant metabolic status, the amount that pH will change in response to a given PaCO2 change is constant and is termed the acute PaCO2–pH relationship. The acute PaCO2–pH relationship for both increases or decreases in PaCO2 is shown in Table 5-1. A different pH change factor is necessary for a decrease in PaCO2 than for an increase in PaCO2 because of the logarithmic nature of these relationships.


Expected pH

Using a pH of 7.40 and a PaCO2 of 40 mm Hg as our baseline, the expected pH that would result from a specified change in PaCO2 could thus be calculated. For example, if PaCO2 decreases 10 mm Hg (i.e., from 40 to 30 mmHg), pH increases 0.10 or from 7.40 to 7.50. Conversely, if PaCO2 increased acutely to 50 mm Hg, the expected pH (assuming normal metabolic tendency) would be 7.34.


Important landmarks in the relationship between PaCO2 and pH are shown in Table 5-2. It may be useful for the clinician to memorize these relationships. When a more precise calculation is desired, specific calculation of the expected pH for any PaCO2 can also be accomplished by application of the formulas shown in Box 5-1.


Indirect Metabolic Status

After the expected pH has been calculated for a given PaCO2, it can be compared with the actual pH on the blood gas report as a means of “indirect metabolic assessment.” Because the acute PaCO2–pH relationship holds true only when metabolic status is normal, if actual pH is equal to the expected pH it can be concluded that metabolic status is, indeed, unchanged and normal.


On the other hand, it is likewise true that if the actual pH is not equal to the expected pH, the metabolic status cannot be normal. This is intuitively correct because any alteration in pH that is not of respiratory origin must be metabolic. The clinician should understand that indirect metabolic assessment is only an approximation (albeit a very good one) and that very small differences between actual and expected pH (e.g., ±0.02) can be attributed to slight measurement error. Blood gas electrode error alone may result in discrepancies of at least ±0.01.


For this reason, a ±0.03 comparison factor is recommended. Indirect metabolic assessment using this factor correlates very well with metabolic assessment using the base excess of extracellular fluid [BE]ecf that is described later in this chapter.


The possible outcomes of indirect metabolic assessment based on comparison of actual and expected pH are defined in Table 5-3. When the actual pH is equal to the expected pH ±0.03, the metabolic status must be normal. When the actual pH is significantly more acidic than expected (i.e., more than 0.03 pH units lower), a metabolic acidosis must be present. Conversely, when actual pH is significantly more alkaline (more than 0.03 pH units) than expected, a metabolic alkalosis (nonrespiratory condition tending to cause alkalemia) must be present. These conclusions closely parallel metabolic diagnosis that is made directly with the [BE]ecf to be discussed later in this chapter.


The values in Example 5-1 presented earlier are used to show the application of indirect metabolic assessment to evaluate internal consistency. Based on the acute PaCO2–pH relationship, the expected pH for a PaCO2 of 30 mm Hg is 7.50. Therefore, in a patient with this PaCO2 level and normal metabolic status, one would expect to find an actual pH within ±0.03 of 7.50.


The patient’s actual pH in Example 5-1 is 7.60, which is much higher than expected. Therefore, the patient must also have a concomitant metabolic alkalosis based on the acute PaCO2–pH relationship. The finding of a normal metabolic index (i.e., [HCO3] 23 mEq/L) is not consistent with the indirect finding. The problem in this case could have been a transcription error. The patient’s actual pH should have been 7.50. A pH of 7.50 would make these data internally consistent.


In summary, metabolic status may be accurately assessed indirectly without ever seeing a metabolic index. In fact, using indirect metabolic assessment, a complete blood gas acid-base classification can also be made based on the PaCO2 and pH alone in the event that a metabolic index is, for some reason, unavailable. This technique is likewise a useful tool in attempting to validate or invalidate the internal consistency of a questionable blood gas report.


A lack of internal consistency does not indicate where an error has occurred. Nevertheless, it is clear evidence that an error is present, and the clinician or laboratory diagnostician should be alerted with regard to the need for further investigation and clarification.


Modified Henderson Equation

The Henderson equation to be described later in Chapter 8 can be modified to relate [H+] in nanequivalents per liter (instead of pH) to PaCO2 and [HCO3] as shown in Equation 5-1. Thus, if any two of these three variables are known the third variable can be calculated.


[H+]=24×PaCO2[HCO3] Equation 5-1


image Equation 5-1


To apply this formula, however, one must be able to convert pH units to hydrogen ion concentration in nanequivalents per liter (nEq/L). To get an idea of how minute this unit is, a nanequivalent is one millionth of an equivalent. A milliequivalent is equal to 10−3 equivalents. A microequivalent is equal to 10−6 equivalents, and a nanequivalent is equal to 10−9 equivalents.


There is a near-linear relationship between [H+] in nEq/L and pH over the pH range (7.20 to 7.50) shown in Table 5-5. It can also be seen that this linear relationship begins to deteriorate quickly beyond this range, especially with acidemia.


A pH of 7.40 is equivalent to a [H+] of 40 nEq/L. As a general rule, for each 0.01 change in pH within the range of 7.20 to 7.50, there is a 1 nEq/L inverse change in [H+]. Thus, a pH of 7.50 is equal to a [H+] of 30 nEq/L, and a pH of 7.30 is equal to a [H+] of 50 nEq/L.


By converting [H+] to pH, Equation 5-1 can be used to check internal consistency of questionable blood gases. This equation is especially useful because it can be used to determine any of the three variables (i.e., pH, PaCO2, or [HCO3]) if the other two variables are known.


With regard to internal consistency, it should also be pointed out that acid-base values can be internally consistent, yet they can still be wrong. For example, if the pH is measured incorrectly, the [HCO3] is also wrong (although it is internally consistent) because it is calculated in the blood gas machine based on the pH and the PCO2.


Acid-Base Map

The acid-base map is discussed in detail in Chapter 14 (see Fig. 14-1), which addresses the identification of mixed acid-base disturbances. Using an acid-base map, one can easily plot two acid-base variables on the map and determine the third. When readily available, the acid-base map is probably the easiest and most expedient way to assess internal consistency.


External Congruity


In addition to assessing internal consistency, the clinician should also evaluate reported data from other laboratories and the patient’s general appearance to ensure external congruity. External congruity in this context means ensuring that all laboratory tests and observations are in concert and are harmonious with the blood gas results. A sign of incongruity is when blood gas numbers are not in harmony with the patient’s appearance or other laboratory values. Incongruity is often the first clue regarding incorrect and/or misleading laboratory measurements.


Laboratory to Laboratory Congruity


Total CO2

The plasma bicarbonate is also usually reported from the chemistry laboratory with standard electrolytes as total CO2 ([total CO2]). Because plasma [HCO3] comprises approximately 95% of total CO2, these two measurement may essentially be viewed as being interchangeable.176 177 One caveat is that total CO2is measured in the chemistry laboratory using venous blood, which is typically 2 to 3 mEq/L higher in bicarbonate. Nevertheless, total CO2 is, for all practical purposes, an index of plasma bicarbonate. Therefore, the electrolyte report may be used as a crosscheck regarding the accuracy of the [HCO3] reported on the blood gas report.


Historically, total CO2 was introduced as a clinical metabolic acid-base index before the routine availability of blood gases. Today, total CO2 is considered to have only minimal value as an isolated index because it must be interpreted in the context of pH and PaCO2. Nevertheless, the [HCO3] can easily be approximated from the total CO2, and this value can be compared with the blood gas bicarbonate as a gross index of external congruity. As previously stated, total CO2 should be expected to be slightly higher than bicarbonate from the blood gas report because it is measured from venous blood.


Total CO2 Components

As discussed in Chapter 8, CO2 is transported in the blood as bicarbonate, dissolved CO2, and carbamino-compounds. Bicarbonate and dissolved CO2 are responsible for almost all of the CO2 present in the blood plasma. Therefore, total CO2, usually reported in mEq/L, is presumed to be equal to the sum of CO2 dissolved in the plasma and plasma bicarbonate, which is shown in Equation 5-2. PaCO2 may be multiplied by the conversion factor (0.03 mEq/L/mm Hg) to determine the dissolved CO2 concentration in mEq/L.


[Total CO2]=[dissolvedCO2]+[bicarbonate][Total CO2]=(PaCO2×0.03)+2425.2=1.2+24(mEq/L) Equation 5-2


image Equation 5-2


Bicarbonate Calculation from Total CO2

To calculate the specific [HCO3], dissolved CO2 in mEq/L is subtracted from the reported total CO2 (see Equation 5-3). The difference represents plasma bicarbonate in mEq/L. Because the concentration of dissolved CO2 in mEq/L is so small (typically 1 to 2 mEq/L) and bicarbonate represents 95% of the total CO2 value, gross inspection of the total CO2 provides a reliable estimation of plasma bicarbonate even without this calculation.


[Total CO2][dissolvedCO2]=[bicarbonate]25.2(PaCO2×0.03)+24=[bicarbonate]25.21.2=24(mEq/L) Equation 5-3


image Equation 5-3
< div class='tao-gold-member'>

Stay updated, free articles. Join our Telegram channel

Jul 10, 2016 | Posted by in RESPIRATORY | Comments Off on Accuracy Check and Metabolic Acid-Base Indices

Full access? Get Clinical Tree

Get Clinical Tree app for offline access