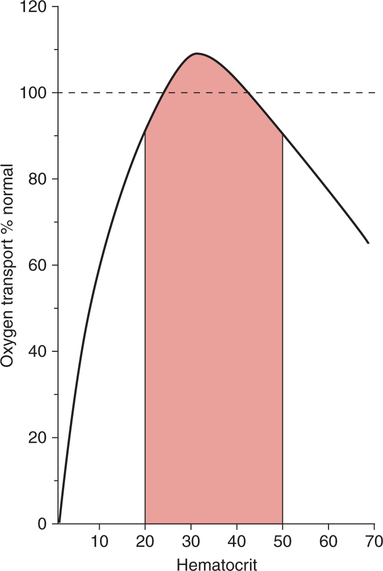
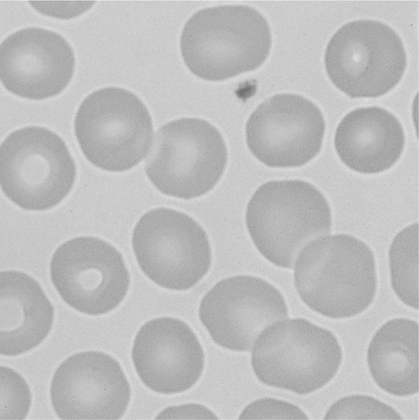
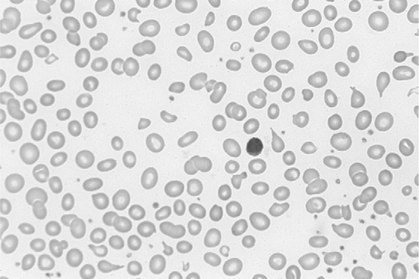
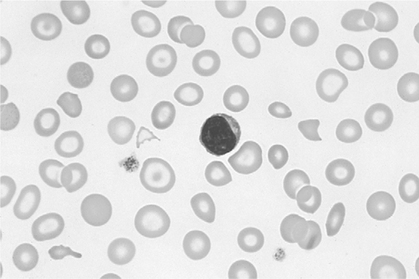
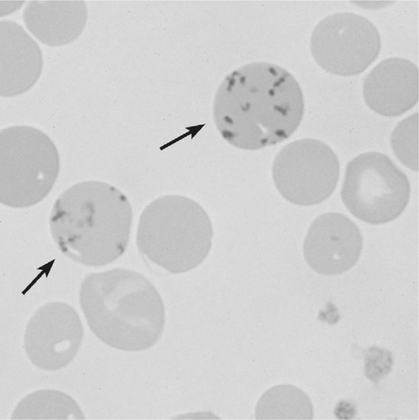
There is no single, simple index or way to quickly and accurately assess tissue oxygenation. Rather, tissue oxygenation status is best assessed by systematically analyzing the various components of the oxygenation system and by evaluating related laboratory data. I have divided tissue hypoxic assessment into two phases. First, as a matter of routine, one should evaluate the three essential components of oxygen supply shown in Box 11-1. The ABCs of tissue oxygen supply are Arterial oxygenation assessment, Blood hemoglobin concentration, and Circulatory status. A deficiency in any one of these components may compromise oxygenation of the tissues. Although evaluation of oxygen supply components is a logical starting point, in many cases, it is still difficult to conclude whether tissue hypoxia is, indeed, present. Therefore, when more definitive information is needed, the clinician may look to specific indices that suggest oxygenation failure and tissue hypoxia. Potential markers of tissue hypoxia are listed in Box 11-2. These include lactate measurement, indices of mixed venous oxygenation, oxygen uptake and utilization, and gastric mucosal acidosis. Each of the oxygen supply variables as shown in Box 11-1 will be described in detail. There are two primary indicators of arterial oxygen supply: PaO2 and SaO2. An approximate gauge of SaO2 is often reflected by pulse oximetry and in this case may be referred to as SpO2. The student should understand that true SaO2can only be measured by CO-oximetry as described later in this chapter and Chapter 15. Nevertheless, SpO2provides a crude index of SaO2in the absence of abnormal Hb species. These guidelines represent clinical rules of thumb. There are, of course, exceptions to every rule. It has been shown that under certain conditions, hypoxia does not occur despite the presence of severe hypoxemia.378 379 380 For example, mountain climbers at the summit of Mt. Everest had PaO2 levels below 30 mm Hg without apparent adverse consequences.378 Similarly, patients with congenital heart disease had PaO2 levels averaging 37 mm Hg without notable physiologic impairment.380 Furthermore, these patients were capable of some exercise, during which PaO2 levels decreased further to 28 mm Hg.380 Finally, despite the fact that a PaO2 of less than 20 mm Hg is generally considered to be incompatible with life, 13 of 22 patients in one study recovered without permanent physiologic impairment despite PaO2 levels of less than 21 mm Hg.379 Thus, PaO2 alone, even when extremely low, is inadequate as an index of tissue hypoxia. Also, one must not rely too heavily on PaO2 alone because measurements in stable critically ill patients in one study varied as much as 13% from one reading to another.381 This constitutes an average variance of about 16 mm Hg in PaO2 measurements without a noticeable change in patient condition. The guidelines presented previously, notwithstanding the exceptions, represent a prudent approach to the classification of hypoxemia and the prevention of hypoxia. One must remember that in normal persons, when PaO2 decreases to about 55 mm Hg, judgment and short-term memory may be impaired, presumably due to hypoxia.382 Therefore, in all but unusual circumstances, it is unacceptable to allow moderate or severe hypoxemia (i.e., PaO2 < 60 mm Hg) to persist.382 This is true even in patients with chronic obstructive pulmonary disease (COPD), because a PaO2 of 60 mm Hg is not associated with a great risk of increasing hypercarbia.382 As described in Chapter 10, there are some circumstances (e.g., paraquat poisoning, ARDS) when moderate degrees of hypoxemia may be considered acceptable or permissive. Indeed, a rebuttal of the traditional approach to treatment of hypoxemia has been presented.696 Nevertheless, treatment of moderate hypoxemia seems prudent until clear evidence suggests otherwise. Methods available to treat hypoxemia have been discussed in detail in Chapter 10. Although the PaO2 is a useful starting point in clinical hypoxic assessment, it is foolhardy to equate a normal PaO2 with normal tissue oxygenation. The myriad other factors that may influence O2 transport and internal respiration must also be evaluated. Some laboratories use a nomogram to predict the SaO2, based on the PaO2 and pH.383 This calculated SaO2 does not account for factors other than the pH that may alter HbO2 affinity. Furthermore, this methodology assumes that no abnormal forms of Hb are present, such as HbCO or MetHb. Obviously, calculated SaO2 provides little more information than PaO2 and may sometimes lead to a false sense of security. Some laboratories label calculated saturation as SO2. SaO2 may be measured more accurately via oximetry. Oximeters are two- wavelength spectrophotometers. The specific technique underlying two-wavelength oximetry is discussed in Chapter 15. It is important to understand two essential points when SaO2 is measured with the two- wavelength method. First, when only two wavelengths are used, abnormal forms of Hb such as HbCO and MetHb cannot be detected.383 Second, SaO2 measured in this way is the percentage of HbO2 compared with the sum of HbO2 and desaturated Hb only. Because this measurement does not include abnormal forms of Hb, it is sometimes referred to as functional SaO2.383 Functional SaO2 is the percentage of HbO2 compared with the quantity of Hb capable of carrying O2. MetHb and HbCO are not capable of carrying O2; therefore, they are not specifically considered in this measurement. The saturation as measured by pulse oximetry (SpO2) is a functional SaO2 measurement as described earlier. As a two- wavelength device, the pulse oximeter cannot distinguish between HbO2 and HbCO; therefore, SpO2 is equal to the sum of HbO2 and HbCO percentages.385 Other factors that have been thought to alter pulse oximetry readings include hypothermia, dark fingernail polish, vasoconstriction associated with shock, and infusion of dyes.386 Interestingly, SpO2 readings may be slightly higher if the finger being used for the test is elevated, presumably because of changes in venous congestion.387 Newer pulse oximeter technology tends to eliminate many potential measurement errors (see Chapter 15). There is sometimes concern that a left-shifted oxyhemoglobin dissociation curve may cause tissue hypoxia because the hemoglobin will not release oxygen to the tissues. This phenomenon alone, especially in chronic conditions, is probably unlikely to cause tissue hypoxia as a patient with a p50 of 11 mm Hg did not appear to show any evidence of hypoxia.436 In most clinical situations, conventional wisdom is simply to maintain the fractional SaO2 above 90% to 92%. This usually equates to a PaO2 > 60 mm Hg. When SaO2 falls below this point, however, immediate action is usually indicated to restore SaO2 to safer levels. One must remember that below 90% saturation, SaO2 will fall precipitously with further PaO2 reductions. Although this approach has been recently challenged,696 presently it is probably best to adhere to conventional wisdom. A reduction in the amount of circulating RBCs or Hb is termed anemia. In general, the classic criterion for an individual to be considered anemic is if [RBC] is less than 4 million/mm3 or if [Hb] is less than 12.5 g%.702 Actual normal values vary with age and sex. Anemia may greatly diminish the ability of the blood to transport oxygen because hemoglobin is responsible for approximately 98% of oxygen transport. In a sense, hematocrit is a double-edged sword. If Hct is extremely low, arterial oxygen content and oxygen transport will be compromised. Conversely, when Hct is excessive, blood viscosity is increased and again, oxygen transport may be diminished due to a fall in cardiac output (Fig. 11-1). The optimal clinical Hct is likewise controversial and, in different patient populations, has been shown to be as low as 30% or as high as 45%.437 Normal RBCs are, for the most part, approximately 7 μm in diameter. Figure 11-2 shows a normal RBC film magnified 1000 times. Anisocytosis is said to exist when there are abnormal variations in cell size (Fig. 11-3). The presence of great numbers of large (>10 μm) RBCs is called macrocytosis. This condition is also seen in Figure 11-3. Conversely, the presence of great numbers of small (<5 μm) RBCs is called microcytosis (Fig. 11-4). Cell size is measured in the clinical laboratory using the mean corpuscular volume (MCV) index. Normal MCV is 90 (±8) femptoliters (fL).388 Decreased [Hb] associated with an MCV less than 82 fL is called microcytic anemia; decreased [Hb] associated with an MCV greater than 98 fL is called macrocytic anemia. Abnormalities in the shape of RBCs are called poikilocytosis. An example of a cell with an abnormal shape is the megaloblast. These cells are large (11 to 20 μm), nucleated RBCs that are oval and slightly irregular in shape (see Fig. 11-3). Megaloblasts are found in anemia due to vitamin B12 deficiency (i.e., pernicious anemia) or in folic acid deficiency. The presence of large numbers of immature RBCs in the blood suggests that anemia may be due to acute blood loss. Under normal conditions, between 0.5% and 1.5% of RBCs are in the immature form known as reticulocytes (Fig. 11-5).389 The presence of increased reticulocytes in the blood is called reticulocytosis. Reticulocytosis leads to rapid oxygen consumption in acquired blood samples and may lower blood PaO2 if not measured promptly. Another type of immature RBC, the normoblast, is not normally found in the blood but may be observed in anemia secondary to acute blood loss. A normoblast is a nucleated RBC similar in size to a normal RBC. The percentage of the RBC volume occupied by Hb is another useful diagnostic aid in anemia. Normally, approximately one-third of the RBC consists of Hb. The clinical laboratory test used to evaluate RBC [Hb] is the mean corpuscular hemoglobin concentration (MCHC). Normal MCHC is 34±2%388 and is called normochromia. Hyperchromia (MCHC >36%) is rare; however, hypochromia (MCHC <32%) is seen commonly in iron deficiency anemia (see Fig. 11-4). Table 11-1 compares MCV and MCHC.Table 11-2 summarizes many of the terms used in describing RBCs when diagnosing anemia. Common types of anemia associated with each laboratory finding are also shown in Box 11-3. Table 11-1 Some of the more common types of anemia are briefly discussed here to acquaint the reader with the variety of potential anemic mechanisms (see Table 11-2). The presence of anemia means either (1) that there is a decrease in the production of RBCs or hemoglobin or (2) that RBCs or Hb is being lost or destroyed at an accelerated rate. Table 11-2 Probably the most common cause of iron deficiency anemia is chronic blood loss. It may also be seen in infants or in mothers during pregnancy. An interesting diagnostic characteristic observed in some individuals with iron deficiency is pagophagia.438 Pagophagia is a type of “pica” or craving for unusual substances. Pagophagia is a strong craving for ice and is the most common type of pica seen in iron deficiency anemia. Pica occurs in up to 58% of patients with iron deficiency.438 In recent years, severe iron deficiency has become relatively uncommon. Nevertheless, mild iron deficiency is still far too common and can have damaging long-term consequences.439 Thus, we must continue to be vigilant in its identification and prevention. Hemolysis is usually the result of the presence of toxins in the blood. Toxins may originate from infectious processes or may directly enter the blood, such as in poisonous snakebites. Many chemical agents may be associated with hemolysis. Finally, chronic hemolysis with acute exacerbation may occur in disorders such as sickle-cell disease (see Chapter 7) or thalassemia. The pain rate (episodes per year) is a useful measure of the severity of sickle cell disease.440 Treatment, which has been discussed briefly in Chapter 7, may include bone marrow transplant, or more commonly, administration of pharmacological agents (e.g., hydroxyurea) aimed at increasing the amount of fetal Hb (HbF).441 Increases in HbF have an ameliorating effect on the disease and symptoms. Many of these chemotherapeutic agents, however, may cause adverse effects and drugs with less potential of side effects (e.g., butyrate) continue to be explored.441 Reticulocyte levels typically are increased in conditions associated with hemolysis or blood loss. In most long-term hemolytic anemias, reticulocytes exceed 5%.390 When evaluating the reticulocyte levels, however, one must keep in mind that reticulocytes are usually expressed as a percentage of total RBCs. Furthermore, the body responds to anemia by increasing cardiac output and increasing 2,3-diphosphoglycerate (DPG) levels. In healthy individuals, mild, acute normovolemic anemia is compensated for by increases in cardiac output up to 50%.391 Within 2 weeks the cardiac output returns to preanemic levels, with an increase in DPG accounting for the compensation. Thus, the major compensatory mechanism in acute anemia is an increased cardiac output, whereas in chronic conditions, increases in DPG prevail. In moderate to severe anemia (i.e., [Hb] = 6 to 9 g%) hypoxia may occur, depending on the cardiac reserve and the acuteness of onset. Anemic hypoxia in all likelihood will be seen when [Hb] falls below 6 g% and the capabilities of compensatory mechanisms are exceeded.392 Blood transfusion is the treatment of choice for severe anemia; however, this therapy may be associated with substantial risk. Some adverse effect to blood transfusion may occur in as many as 20% of recipients.442 Immune side effects are seen in approximately 3% of all transfusions.393 Typically these are mild allergic reactions, although potentially fatal hemolytic reactions are observed in approximately one of 6000 transfusions.393 In addition, anaphylactic reactions may occur, and not infrequently patients contract post-transfusion hepatitis.393 Finally, blood is a complex substance and may carry with it additional risk factors not yet clearly identified. The acquired immunodeficiency syndrome has been a painful lesson in this regard. The ideal hematocrit and [Hb] in critically ill patients are also a matter of some controversy. Certainly, Hct need not be within the normal range in order to ensure adequate oxygenation. Optimal levels are probably somewhere between 30% and 45% depending on the individual’s particular pathology.394 437 There is some evidence to suggest that the optimal hematocrit in critically ill patients is about 33% (see Fig. 11-1), because further increases do not result in increased cellular O2 availability.395 Obviously, low Hct levels are associated with decreased ability of the blood to carry oxygen. In contrast, high Hct levels increase blood viscosity and thereby dampen cardiac output. A [Hb] blood transfusion trigger of less than 7.0 g/dL has been recommended and is probably a useful guideline.444 Nevertheless, at high altitude, or for patients with brain injury, a much higher trigger (e.g., 10 g/dL) is probably appropriate.443
Hypoxia: Assessment and Intervention
OVERVIEW
OXYGEN SUPPLY VARIABLES
Arterial Oxygenation
PaO2
PaO2 as an Index of Hypoxia
Prevention of Hypoxemic Hypoxia
SaO2
SaO2 Determination
Calculated SaO2 Using a Nomogram.
Oximetry.
Pulse Oximetry.
SaO2 as an Index of Hypoxia
Maintenance of an Adequate SaO2
Blood Hemoglobin Concentration
Anemia
Laboratory Diagnosis of Anemia
Mean Corpuscular Volume
Red Blood Cell Shape
Immature Red Blood Cells
Mean Corpuscular Hemoglobin Concentration
Summary
Mean Corpuscular Volume (MCV)
Mean Corpuscular Hemoglobin Concentration (MCHC)
Measurement of average size or volume of individual RBCs
Measurement of average [Hb] in 100 mL of packed RBCs
Normal value: 90 ± 8 fL
Normal value: 34 ± 2%
MCV <82 fL indicates microcytosis
MCHC <32% indicates hypochromia
MCV >98 fL indicates macrocytosis
MCHC >36% indicates hyperchromia
Types of Anemia
Terminology
Description
Types of Anemia
Anisocytes
Abnormal variations in cell size
Nonspecific
Hypochromia
Pale cells due to decreased [Hb] within cell
Iron deficiency
Macrocytes
Large cells greater than 10 μ
Pernicious anemia and folic acid deficiency
Megaloblasts
Large, oval, irregular, nucleated cells
Pernicious anemia and folic acid deficiency
Microcytes
Small cells less than 5 μ
Iron deficiency, thalassemia
Normoblasts
Immature, nucleated red blood cells of normal size
Acute blood loss
Poikilocytes
Abnormal variations in cell shape
Nonspecific
Reticulocytes
Immature red blood cells containing a network of granules or filaments
Acute blood loss
Sickle cells
Crescent or sickle-shaped cells
Sickle cell anemia
Inadequate Hemoglobin Synthesis
Red Blood Cell Loss/Hemolysis
Anemia and Hypoxia
Blood Transfusions
Circulatory Status
Cardiac Output
Shock
< div class='tao-gold-member'>
![]()
Stay updated, free articles. Join our Telegram channel

Full access? Get Clinical Tree


Hypoxia: Assessment and Intervention
 or sometimes CO) is the volume of blood ejected from the left side of the heart each minute. Cardiac output is a crucial index concerning tissue oxygenation. Cardiac output is approximately 5 L/min in normal individuals. The cardiac index (CI) relates cardiac output to body size and expresses cardiac output as liters per minute per body surface area in square meters (m2). Thus, the cardiac index should be the same in all individuals regardless of size or weight. The normal cardiac index is 3.5 ± 0.7 L/min/m2.
 /
/ in the lungs.
Only gold members can continue reading. Log In or Register to continue
