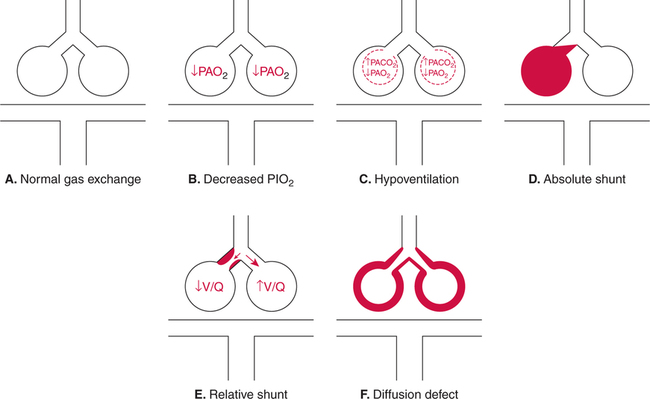
Hypoxemia is defined in this text as a below- normal PaO2 in the blood. The severity of hypoxemia is an important indicator of the likelihood of hypoxia concomitant with the hypoxemia. Table 2-7 is provided in Chapter 2 for classification of the severity of hypoxemia. Five mechanisms by which hypoxemia may occur are shown in Figure 9-1. Hypoxemia may be due to a low partial pressure of inhaled oxygen (PIO2) (which is present at high altitude), when exhaled gas is rebreathed continuously in a confined area, or when a gas with less than 21% oxygen is inspired (see Fig. 9-1,B). This mechanism, however, is rarely responsible for hypoxemia in the acute care setting. In the hospital, there are really only four potential causes of hypoxemia (Box 9-1). These causes include hypoventilation (see Fig. 9-1,C); absolute shunting (see Fig. 9-1,D); relative shunting, commonly referred to as ventilation/perfusion mismatch (see Fig. 9-1,E); and diffusion defects (see Fig. 9-1,F). Almost all hypoxemia (excluding changes in cardiac output) in the hospital setting may be presumed to be due to one or more of these four mechanisms. The differential diagnosis of hypoxemia is discussed in a subsequent section of this chapter. A decrease in cardiac output is not generally considered to be a primary cause of hypoxemia, and no mention of cardiac output is made in Box 9-1 regarding the causes of hypoxemia. Notwithstanding, it is not correct to presume that the cardiac output has no effect on PaO2. The relative influence of cardiac output on PaO2 in various clinical situations is explored. The clinician must always keep in mind that arterial blood is a mixture of blood from two sources. Oxygenated blood is leaving functional alveolar-capillary units and entering the arteries. Also, some mixed venous blood is always entering the arterial circulation via the normal anatomic shunt (Fig. 9-2). A decrease in P In the individual with an abnormally high pulmonary shunt, the P Figure 9-5 shows how a decline in cardiac output affects PaO2 in the patient compromised with preexisting pathologic shunting. Note the lower PaO2 shown in Figure 9-5 compared with Figure 9-4, despite identical shunt fractions of 25%. Note also that a decrease in cardiac output has a greater impact on PaO2 in the individual with increased physiologic shunting (see Fig. 9-5), compared with the individual who has only a normal anatomic shunt (see Fig. 9-3). It has in fact been shown that a decrease in P In the presence of a large physiologic shunt and hypoxemia, cardiac output is more likely to increase rather than decrease in the individual with an intact cardiovascular system.245 The increase in cardiac output is due at least partly to stimulation of the peripheral chemoreceptors secondary to the hypoxemia. Cardiac output tends to increase quickly, due primarily to an increased heart rate, and in a dose-response fashion.245 In other words, the more severe the hypoxemia, the greater the increase in cardiac output. Increasing cardiac output tends to enhance tissue oxygenation both by an increase in the blood reaching the tissues and, to a lesser extent, by increasing PaO2. The increase in cardiac output improves PaO2 by increasing P The logic of these assumptions is sound, and most often these assumptions prove to be correct. Sometimes, however—particularly in the critically ill patient with substantial pulmonary dysfunction—a change in PaO2 may be primarily due to a nonpulmonary change.246 As has been shown, cardiac output has a notable effect on PaO2 in patients with increased physiologic shunts. Furthermore, the influence of cardiac output on PaO2 is related directly to the size of the shunt. It is wise to suspect a change in cardiac output when abrupt, unexplained hypoxemia is observed in the critically ill patient with apparently stable pulmonary status. Cardiac output can be measured directly in the patient with a pulmonary artery catheter in place. In the absence of a pulmonary catheter, the patient should be monitored for signs of low cardiac output, such as those described in Chapter 10. The PaO2 alone provides little information regarding the efficiency of oxygen loading into the pulmonary capillary blood. The physiologic shunt, on the other hand, is the percentage of the venous blood that remains unoxygenated after traveling from the right side of the heart to the left side of the heart. It includes blood that is absolutely shunted (i.e., anatomic shunts and true capillary shunts) and alveolar-capillary units in which perfusion exceeds ventilation (i.e., relative shunts). Thus, monitoring physiologic shunting is an excellent way to quantitate the efficiency of oxygen uptake via the lungs. The indices that can be used to measure or to estimate physiologic shunting are shown in Box 9-2. The classic shunt equation for calculation of physiologic shunting ( It should also be noted that Nevertheless, When mixed venous blood is unavailable, a modified version of the classic shunt equation is sometimes used to estimate physiologic shunting. Estimated shunt equations assume a given arteriovenous oxygen content difference (C[a− An example of an estimated shunt equation using a C(a− When mixed venous blood gases are unavailable, the estimated shunt equation is probably the best alternative to the classic shunt formula.248 251 Notwithstanding, however, there are really no true substitutes for actually measuring mixed venous oxygen contents in critically ill patients.252 The mean normal P(A−a)O2 is approximately 10 mm Hg in adults younger than 60 years of age breathing room air.254 Individual variations, however, may be great. The upper limit of normal for adults younger than 60 years of age is approximately 20 mm Hg.254 255 Unfortunately, P(A−a)O2 increases with advancing age and may be as high as 35 mm Hg in the healthy individual older than 60 years of age.254 Furthermore, in some individuals, P(A−a)O2 may also change with body position. In individuals older than 44 years of age, P(A−a)O2 increases with the assumption of the supine position.256 257
Assessment and Treatment of Hypoxemia and Shunting
ASSESSMENT OF HYPOXEMIA
EFFECTS OF CARDIAC OUTPUT ON PaO2
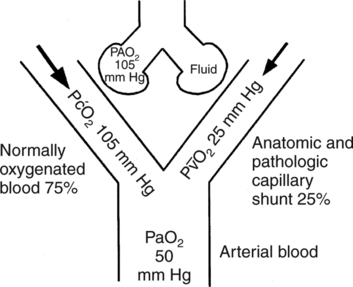
Arterial Blood as a Mixture
Changes in Cardiac Output or Shunting
Decreased Cardiac Output with a Normal Shunt
 O2 typically accompanies a decrease in cardiac output if oxygen consumption remains constant. Because tissues are exposed to less blood, they must extract more oxygen from available blood, which results in a lower P
 O2. Thus, when cardiac output falls, shunted blood entering the arterial circulation will have a lower P
 O2 than shunted blood when cardiac output is normal (Fig. 9-3). Nevertheless, it is important to note that in otherwise normal lungs, a decrease in cardiac output lowers PaO2 only slightly because shunted blood accounts for only 5% of the total arterial blood mixture. Thus, although PaO2 decreases slightly with a decrease in cardiac output, the effect of a decreased cardiac output on PaO2 in the normal lung is minute.
Increased Shunting with Normal Cardiac Output
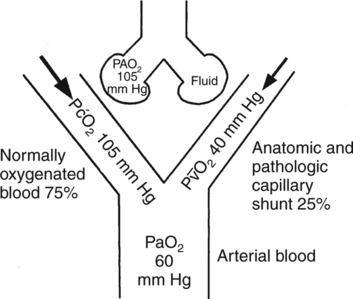
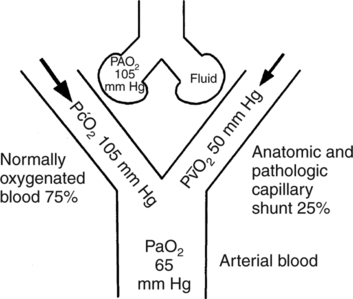
 O2 of the shunted blood has a more substantial impact on PaO2as shown in Figure 9-4. The low PaO2 that accompanies increased physiologic shunting is a result of the large percentage of venous blood entering the arterial circulation. Note that, in this case, the cardiac output and P
 O2 are still normal. Increased shunting is the most common mechanism responsible for the development of hypoxemia.
Decreased Cardiac Output with an Increased Shunt
 O2 from 40 to 30 mm Hg with a constant 30% shunt decreases PaO2 from 55 mm Hg to approximately 45 mm Hg.244
Increased Cardiac Output with an Increased Shunt
 O2, which is shown in Figure 9-6. This result is the opposite effect to that shown in Figure 9-5 where cardiac output is decreased.
Clinical Implications
ASSESSMENT OF PHYSIOLOGIC SHUNTING
Introduction
Indices of Physiologic Shunting
Classic Shunt Equation
 sp/
sp/ T) was described in Chapter 6 (Equation 6-3). It is noteworthy that the classic shunt equation corrects for any nonpulmonary (e.g., P
 O2) mediated effects on arterial oxygenation, which have been described earlier in this chapter. This is accomplished by directly measuring mixed venous oxygen content and by using this value in the denominator of the equation. In fact, the classic shunt calculation is the only index of oxygen-loading efficiency of those shown in Box 9-2 that takes into account these nonpulmonary factors.
 sp/
sp/ T changes somewhat depending on the FIO2 at which it is measured. The pulmonary shunt tends to decrease as FIO2 is increased from 0.21 to 0.40, remains constant from FIO2 0.40 to 0.70, then increases as FIO2 moves above 0.70.253
 sp/
sp/ T, which is calculated through the classic shunt equation, is the measurement of choice whenever a pulmonary artery catheter is in place. Similarly, when precise monitoring of pulmonary shunting is indicated, such as in the patient with severe pulmonary shunting (e.g., PaO2 of 60 mm Hg on FIO2 of 0.60), some clinicians recommend pulmonary catheterization to facilitate accurate monitoring of the physiologic shunt.247
Estimated Shunt Equations
 ]O2) in their calculations. In some versions of the equation, the difference is assumed to be the normal 5 vol%.248 249 Because it is common for critically ill patients to have a higher cardiac output or lower oxygen extraction than normal (and therefore a lower arteriovenous difference), in some versions, a difference of 3.5 vol% is deemed more accurate.250 A lower C(a−
 )O2 has also been demonstrated in patients with hepatopulmonary syndrome and should be used when calculating estimated shunt in this group.282
 )O2 difference of 3.5 vol% is shown in Equation 9-1. Also note that the equation has been rearranged to accommodate inclusion of the arteriovenous difference.
 sp/
sp/ T = (C
 O2−CaO2)/(C
 O2−CaO2) + 3.5 Equation 9-1
The P(A−a)O2
Normal Values
![]()
Stay updated, free articles. Join our Telegram channel

Full access? Get Clinical Tree


Assessment and Treatment of Hypoxemia and Shunting
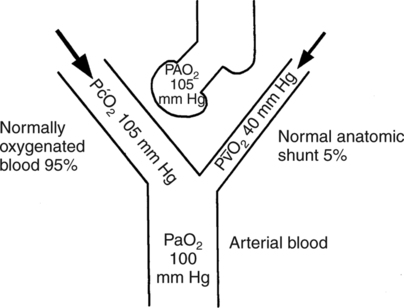
 O2, which is approximately 40 mm Hg). Arterial PaO2 nearly approximates alveolar PAO2 because roughly 95% of arterial blood originates from normally functioning alveolar- capillary units where the blood end-capillary PO2 (P
 O2 equilibrates with the PAO2). In contrast, less than 5% of the arterial mixture is comprised of P
 O2 contributed from the shunted blood.
 O2). Actually, the oxygen content of mixed venous blood (C
 O2) more accurately reflects the amount of oxygen present in this blood and, therefore, how much it affects the arterial PO2. Nevertheless, P
 O2 is used here to illustrate this concept in the most straightforward manner.
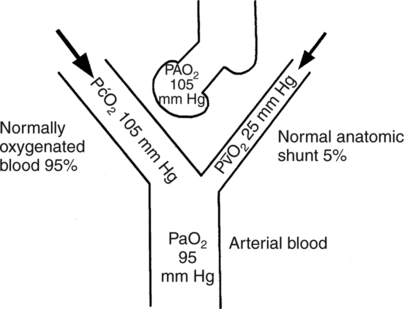
 O2
O2 sp/
sp/ T) via the classic shunt equation is thus the only accurate way to measure physiologic shunting when cardiac output is unstable. Also, by using this index, the clinician can distinguish between PaO2 disturbances of pulmonary versus cardiovascular origin. The physiologic shunt as calculated via the classic shunt equation is therefore the most sophisticated and accurate measure of the efficiency of the lungs to transfer oxygen. The classic shunt equation and measurement is therefore the gold standard in the measurement of the efficiency of oxygen uptake by the lungs.
Only gold members can continue reading. Log In or Register to continue
