Clinical assessment
As outlined above, the initial step in any analysis designed to demonstrate incremental value is the consideration of all the information available prior to performance of the test. This will always include the results of the history and physical examination, and may sometimes include the results of other tests already performed. This section focuses on the information available from clinical assessment.
Diagnosis of coronary artery disease
As demonstrated by the earlier example, clinicians often encounter patients with chest pain and suspected CAD. The ability of clinical assessment to predict the likelihood of significant obstructive CAD has been demonstrated in numerous studies. The likelihood of significant disease based on clinical assessment is appropriately labeled the “pretest probability”, in statistical terms.
Age, gender, and the patient’s chest pain description are the most important clinical parameters for estimating the likelihood of CAD.4 Older patients, men, and patients with chest pain that is typical, or classic, for angina pectoris are more likely to have coronary disease. Although multiple different systems have been used to classify chest pain, the simplest and easiest was proposed by Diamond.5 He suggested a classification based on three elements – substernal location, precipitation by exertion, and relief by rest or nitroglycerin. If all three elements are present, the chest pain is classified as “typical angina”. If two elements are present, the chest pain is classified as “atypical angina”. If only one or none is present, the chest pain is classified as “non-anginal chest pain”.
Table 2.1 shows published estimates of pretest probability on the basis of age, gender, and chest pain description.4 It is obvious that there is a very wide range of pretest probability, ranging from 1% for a 35-year-old woman with non-anginal chest pain to 94% for a 65-year-old man with typical angina. Note that a 50-year-old man with atypical angina has about a 50% probability of disease.
Table 2.1 Pretest probability of coronary artery disease

From Diamond and Forrester.4 Reprinted by permission of the New England Journal of Medicine, and Diamond GA.
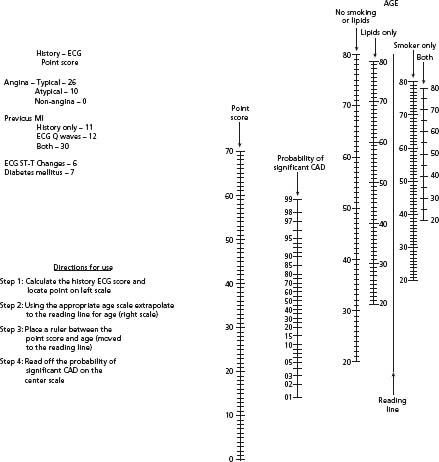
A more comprehensive attempt to consider all clinical characteristics, including risk factors for atherosclerosis, was published from the Duke University Medical Center databank.6 In addition to the three parameters previously discussed, this analysis found that evidence for previous infarction, smoking, hyperlipidemia, ST and T wave changes on the resting electrocardiogram (ECG), and diabetes were all highly significant predictors of the presence of coronary artery disease. Figure 2.1 shows a published nomogram for men that incorporates all of these parameters. Careful inspection of this figure demonstrates that the impact of clinical parameters other than age, gender, and chest pain is variable. ECG and historical evidence of previous infarction have a major impact, diabetes and ECG ST-T changes have a modest impact, and lipids and smoking have a minimal impact. For example, a 50-year-old male with atypical angina has a 46% pretest probability of disease in the absence of smoking, hyperlipidemia or diabetes, a 48% pretest probability in the presence of both smoking and hyperlipidemia, and a 65% pretest probability if he has diabetes as well. In the presence of ECG Q-waves and a history of MI, his pretest probability exceeds 90%.
Figure 2.1 Nomogram for predicting the probability of significant coronary artery disease (CAD) in men. ECG, electrocardiogram; MI, myocardial infarction. (After Pryor et al.6) Example: a 50-year-old, white male with atypical angina and diabetes mellitus, but no ECG ST changes, previous MI, smoking or hyperlipidemia. Point score on left scale = 10 + 7 = 17. Appropriate reading line on right labeled “no smoking or lipids”. Connect age 50 on this reading line to point score of 17 with a straight edge. This intersects the middle line at 60, indicating that this is the percentage probability of significant CAD.

Recent evidence, particularly from the NHLBI-sponsored Women’s Ischemic Syndrome Evaluation (WISE) Study,7,8 has suggested that this traditional approach significantly underestimates the presence of obstructive CAD in women, particularly younger women. Moreover, many women without obstructive disease continue to have symptoms and a poor quality of life.9–11 Many of these have evidence of microvascular dysfunction.12 There is a growing interest in the development of gender-specific tools for the assessment of ischemic heart disease in women, but the evidence is not yet robust enough to support the widespread use of a new approach.
Non-invasive screening for severe coronary artery disease
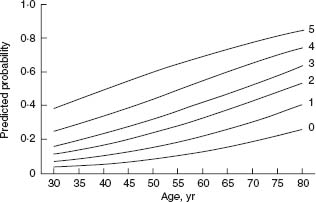
Not surprisingly, clinical parameters are also very important in estimating the likelihood of severe (three-vessel or left main) CAD.13 The same parameters that are most important for predicting the presence of disease – age, gender, and chest pain description – remain important. In addition, diabetes mellitus and history or ECG evidence of myocardial infarction are also very important. The simplest approach to estimating the likelihood of severe disease was published by Hubbard et al.14 They assigned one point each for: male gender; typical angina; history and ECG evidence of myocardial infarction; diabetes; and insulin use. Thus, the point score had a minimum value of 0 and a maximum value of 5. Figure 2.2 shows a nomogram for the probability of severe CAD based on age and this point score. It is quickly apparent that age is an extremely important parameter for predicting severe disease.
Figure 2.2 Nomogram showing the probability of severe (three-vessel or left main) coronary artery disease based on a five-point score. One point is awarded for each of the following variables – male gender, typical angina, history, and electrocardiographic evidence of MI, diabetes, and use of insulin. Each curve shows the probability of severe coronary disease as a function of age. (From Hubbard et al,14 with permission.)

A more comprehensive analysis on a larger number of patients was published from the Duke University Medical Center databank.15 In addition to the five parameters already mentioned, these workers found that the duration of chest pain symptoms, other risk factors (blood pressure, hyperlipidemia, and smoking), a carotid bruit, and chest pain frequency were also important determinants of the likelihood of severe CAD. However, the magnitude of their additional effect was modest.
Prediction of p atient o utcome
The ability of clinical assessment to predict patient outcome has been demonstrated in numerous previous studies. The largest and most important of these came from the Duke University databank16 and the Coronary Artery Surgical Study Registry.17 Many of the same parameters that predict the presence of disease and the presence of severe disease are also associated with adverse patient outcome. Age, gender, chest pain description, and previous myocardial infarction all have independent value in predicting patient outcome. In addition, history and physical examination evidence for congestive heart failure, history and physical examination evidence of vascular disease, unstable chest pain characteristics, and other ECG findings, such as ST and T-wave changes, left bundle branch block, and intraventricular conduction delay, all have prognostic value. It is not generally appreciated how well clinical parameters perform in this regard. The Duke group reported that 37% of the patients undergoing stress testing at their institution had a predicted average annual mortality of 1% or less over the next three years, on the basis of clinical assessment.17
Several studies have shown that a normal resting ECG, and the absence of a history of prior infarction, predict a normal ejection fraction with 90% confidence,18,19 and therefore a favorable prognosis.20–22
Approaches to the assessment of incremental value
Once the information available from clinical assessment (and other tests already performed) has been considered, there are a variety of conceptual and statistical approaches that can be employed to assess the incremental value of the test in question. This section will present examples of three such approaches.
Diagnosis of CAD
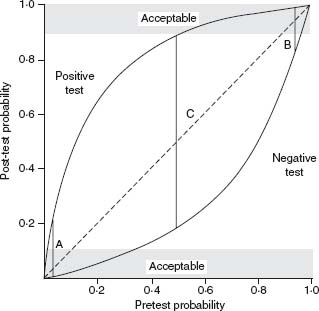
The application of multiple different stress tests for the diagnosis of coronary artery disease has been extensively studied. The most common approach used in this setting to demonstrate the incremental value of a new test employs Bayes’ theorem.23 This theorem indicates that the likelihood of disease following testing (post-test probability) can be calculated from the test characteristics (sensitivity and specificity) and the pretest probability. This calculated post-test probability is often plotted graphically as a function of pretest probability (Fig. 2.3).
Figure 2.3 Relationship between pretest probability and post-test probability. The solid curves for positive and negative tests are plotted for a test with 80% sensitivity and a 90% specificity. Post-test probabilities that are acceptable for diagnosis (90% and 10%) are shown in the shaded zones. Line A represents a patient with a very low pretest probability; line B, a patient with a high pretest probability; line C, a patient with an intermediate probability. (Modified from Berman DS, Garcia EV, Maddahi J. Thallium-201 scintigraphy in the detection and evaluation of coronary artery disease. In: Berman DS, Mason DT, eds. Clinical Nuclear Cardiology. New York: Grune and Stratton, 1981, with permission.)

In Figure 2.3, the pretest probability is shown on the x-axis and the post-test probability is shown on the y-axis. The dotted line represents the line of identity. The vertical distance from this line to the upper solid curve represents the increase in the probability of disease as a result of a positive test. In analogous fashion, the vertical distance from this dotted line to the lower solid curve represents the decrease in probability as a result of a negative test. The solid vertical lines describe three different clinical situations.
Line A represents a patient with a very low pretest probability, such as a 40-year-old woman with non-anginal pain. A negative test changes probability very little. A positive test increases probability somewhat, but the post-test probability remains well under 50%, and the test is most likely a “false positive”.
Line B represents a patient with a high pretest probability of disease, such as a 65-year-old man with typical angina. A positive test will increase the probability only slightly. A negative test will decrease the probability of disease somewhat, but the post-test probability remains substantially greater than 50%, so that the test is most likely a “false negative”.
The final situation (line C) represents a patient with an intermediate probability of disease, such as a 50-year-old male with atypical angina. A positive test in such a patient would increase the probability of disease substantially to near 90%. On the other hand, a negative test would decrease the probability of disease substantially to approximately 18%.
Thus, it is evident that the incremental value of diagnostic testing is greater in patients with an intermediate probability of disease, a principle that is broadly recognized.23 However, it is also recognized that this kind of analysis has a number of limitations. The single curves for positive and negative tests do not take into account the degree of test abnormality. The test results are therefore better displayed for a whole range of values for a parameter that helps distinguish normal from abnormal. The best known example of this would be the magnitude of ST segment depression on treadmill exercise testing.24 In addition, multiple other parameters are reported during a treadmill exercise test, which help to distinguish severely abnormal tests from only mildly abnormal tests.25 Ideally, all of these parameters would be incorporated into a single “score” and a series of curves would be plotted.
Next, construction of such curves relies on the premise that the sensitivity of tests will be identical for any population of patients with disease regardless of disease prevalence. This assumption is usually invalid. As demonstrated in the previous section, those parameters which help to identify the presence of disease also help to identify the presence of severe disease. In general, the sensitivity of most tests is greater in patients with more severe disease. It is therefore quickly evident that sensitivity would be expected to vary with the prevalence of disease. This point has been demonstrated by several investigators26 and provides justification for the use of logistic regression analysis for diagnostic purposes.27 Despite these limitations, Bayesian analysis serves as a useful framework for understanding the potential incremental value of diagnostic tests.
Post-test referral bias, also known as work-up bias or verification bias, occurs whenever the results of the test in question influence the subsequent performance of the “reference” test (sometimes referred to as the “gold standard”). This bias has been recognized for more than 20 years.28 An early survey of the literature on exercise testing showed that only two of 33 studies avoided this bias.29 The recognition of the importance of this phenomenon was emphasized in a landmark paper in 1983, which described the “declining specificity” of radionuclide angiography as a result of this bias.30 Almost 20 years ago, a monograph from the Institute of Medicine emphasized this well-established concept.31 The key question to ascertain whether postreferral bias is present is “did the results of the test being evaluated influence the decision to perform reference standard?”.32
Although this bias potentially occurs for any diagnostic test, it is particularly important for non-invasive diagnostic tests for CAD. Patients with positive non-invasive tests are often referred to coronary angiography (the “reference” test). In contrast, patients with negative tests are often sent home without coronary angiography. The effects of this preferential referral to coronary angiography are to markedly decrease the observed specificity of the test in question and modestly increase its sensitivity.
The clearest solution to the problem of post-test referral bias is to avoid it completely by studying patients in whom the decision to proceed with the “reference” test is made before the performance of the diagnostic test in question.31 For the diagnosis of CAD, this standard is incredibly difficult and rarely achieved. A more feasible alternative is the mathematical correction of sensitivity and specificity for post-test referral bias using one of two published formulae and information about all of the patients who were studied using the diagnostic test in question and did not proceed with coronary angiography.33,34 There are a number of published studies demonstrating the effect of these corrections on the observed test performance for exercise elec-trocardiographic testing,35 exercise echocardiography,36 and exercise single photon computed tomography (SPECT) perfusion imaging.37
Stay updated, free articles. Join our Telegram channel

Full access? Get Clinical Tree


