EEG has made a unique and valuable contribution to our understanding of the brain’s electrical function. The utility of EEG lies in its application to a number of neurological conditions associated with altered brain function. To understand what constitutes an abnormal EEG, a solid foundation of what constitutes the normal boundaries is essential. EEG represents a three-dimensional cerebral source graphically represented in a two-dimensional plane. Most of the human cortex lies deep beneath the scalp surface where EEG has limited capabilities in assessing subcortical abnormalities. The origin of cerebral potentials is based upon the intrinsic electrophysiological properties of the nervous system (1). Scalp EEG is routinely used in the assessment of normal EEG, though three-dimensional source localization is possible (2). To be believable as a source of electrical activity that emanates from the brain, an appropriate polarity (Table 5.1) and accompanying electrophysiological field must exist (3). The correct interpretation involves synthesizing complex waveforms from different bandwidths generated by a cerebral source to determine whether the combined result is normal. Because the routine interpretation of EEG as normal is most routinely a qualitative skill, the result is based upon one’s knowledge, training, and experience. No single parameter or collective group of features present in the EEG can identify a tracing as normal. It is the overall pattern of waveform organization and orderly progression over time that best represents the “brain waves” as normal. Recognizing common features of normal EEG, the infrequent variations seen with a normal record, and the benign variants of uncertain significance that are considered normal is an essential task to ensure appropriate interpretation. The changes that normally occur in the EEG with advancing age are also important to recognize. From the time of birth to old age, the appearance of waveforms that are inappropriate for other ages may occur. Understanding the temporal relationship (Table 5.2) that occurs with time is essential for an age-appropriate assessment of a normal EEG. Misinterpreting an EEG usually occurs from the overinterpretation of a normal record as abnormal. This can result in the incorrect treatment of patients and potentially lead to serious consequences (4).
Polarity with Respect to Electrode Pairs: Input Terminal 1 (aka G1) and Input Terminal 2 (aka G2) versus Surface Waveform Deflection (Arrows)
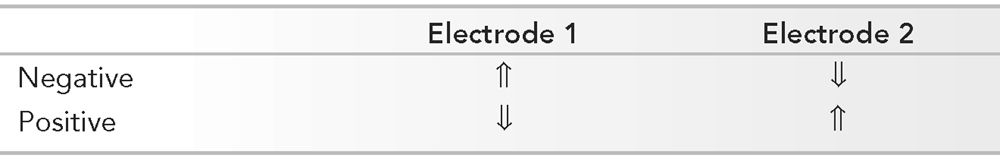
By convention, when G1 is relatively electronegative, the deflection is up.
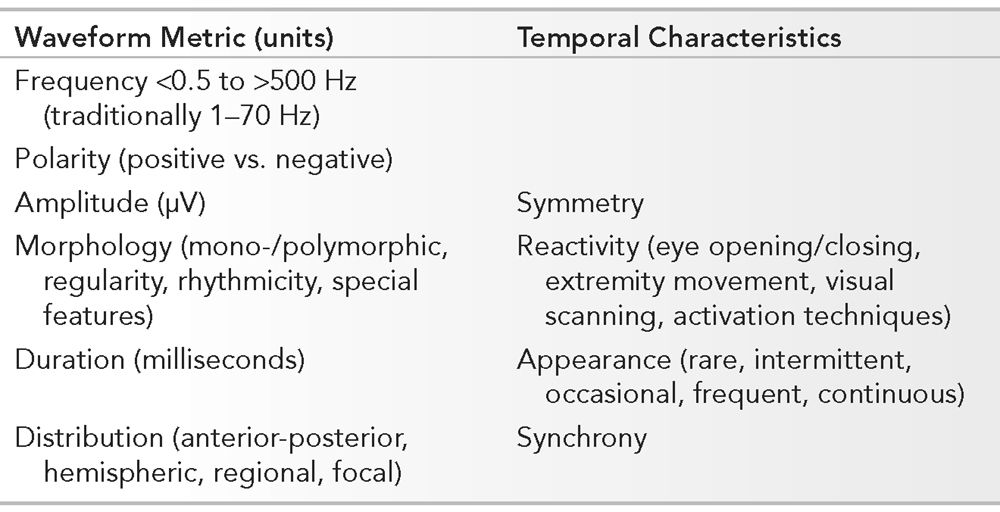
Essential Features of the Normal EEG Involving Waveform Measurements and Temporal Characteristics
PARAMETERS OF RECORDING
Frequency, polarity, amplitude, morphology, duration, and distribution are elements that govern the description and reflect the identity of individual waveforms. Symmetry, reactivity, appearance, and synchrony constitute the temporal characteristics of all the waveforms. The absolute waveform metrics and their temporal relationship is relative to all other components in the EEG. Analyzing the EEG requires a systematic approach. In the routine interpretation of scalp EEG, recordings are usually performed with standardized parameters. A visual display of 30 mm per second is utilized to reflect the “paper speed.” Amplifier sensitivity is initially recorded at 7 μV per mm, though are adjusted based upon requirements of the individual. Lower amplitudes necessitate a higher amplifier gain (i.e., higher sensitivity setting) that is often seen normally in younger patients. Filter settings are routinely set between 1 and 70 Hz. Adjustment of the low-frequency filter (to a higher cutoff frequency) may be required if artifact is problematic such as with sweating. High-frequency filter modification (to a lower cutoff frequency) may be necessary if myogenic artifact is prominent, and a selective “notched” filter at 60 Hz may be required in cases where electrically hostile environments exist. Standard settings are used in the examples throughout the text unless otherwise noted. The state and age of the patient may be known to the electroencephalographer prior to interpretation, though most typically initially interpret the EEG independent of background information. This is to facilitate a final interpretation of the EEG in the proper clinical context of recording. Physiologic functions such as eye opening and closure, visual scanning, and activating procedures are components that are utilized in analyzing normal EEG. In adults, an interpretation should be performed without prior knowledge of the patient’s history to prevent bias during interpretation. Recognizing an adult EEG that has normal background organization with characteristic waveforms makes even the information about the age and state nonessential. The EEG of neonates, infants, and children under 3 years of age, on the other hand, normally has electrocerebral activity that varies substantially based upon age and state. A purists’ approach to analysis of the adult EEG is to develop a working impression without any information. Indicating the patient’s level of alertness is important. An example would be to misinterpret a normal background rhythm less than 8 Hz in drowsiness as abnormal.
Every routine EEG should include at least one montage that uses the longitudinal bipolar, reference, and traverse bipolar montages. Newer modified electrode systems use electrode placement with more closely spaced electrodes in a 10–10 system. High-density arrays and complex methods of signal analysis, such as independent component analysis and phase congruency, may increase the sensitivity of scalp EEG further to refine the location of the generators in normal and in abnormal EEG (5,6). Changes in montage, sensitivity, and display speeds as well as post hoc filtering, spike and seizure software applications, quantitative EEG analysis, and artifact rejection may clarify an EEG that is not otherwise interpretable (7).
BANDWIDTHS IN THE NORMAL ADULT EEG
Normal EEG produces waveforms represented by a spectrum of frequencies (Table 5.3). Routine interpretation of the routine scalp EEG typically involves bandwidths of frequencies that lie between 1 and 30 Hz. Alpha, beta, theta, and delta frequencies comprise the major frequencies for analysis. Most amplitudes range between 10 and 100 μV. Invasive EEG (iEEG) reveals a similar spectrum of frequencies as those recorded at the scalp (8). “Ultra-frequencies” may be observed below 1 Hz (infraslow activity) and above 30 Hz (high-frequency oscillations), depending upon the technical limitations of the recording. Altered morphology, higher amplitudes (5- to 15-fold on iEEG), and shorter durations contrast the bandwidths noted with scalp EEG (9).
Frequencies in the EEG and Their Bandwidths
Frequency | Bandwidth (Hz) |
Ultraslow Delta Theta Alpha Beta Gamma Ripples Fast ripples Ultra-fast ripples | 0–0.3 <3.5 >3.5–<8 8–13 >13–30 >30–80 >80–250 >250–500 500–1,000 |
Alpha
The alpha rhythm is the starting point to assess the background activity when interpreting the EEG. The normal range for the alpha frequency in the occipital region in adults is 8 to 13 Hz. The alpha rhythm is best observed during relaxed wakefulness and normally has a side to side difference of less than 1 Hz. The frequency of the alpha rhythm is coupled with cerebral blood flow and falls when blood flow is compromised. The alpha rhythm has been evaluated in relationship to cognitive and mental function (10,11). Reactivity and a posterior location distinguish the alpha rhythm from an alpha frequency. In majority of people, the occipital region is the site of maximal activity for the alpha rhythm (Fig. 5.1). While a posterior dominant rhythm first becomes apparent at 3 to 4 months of age, an alpha rhythm of 8 Hz is achieved in the majority by 3 years of age and is 10 Hz by age 10. The frequency may transiently increase after eye closure for an instant to lie in the beta bandwidth. However, this rhythm is seen on eye closure and is reactive, independent of the beta frequency and is known as alpha squeak. The alpha rhythm is best observed during periods of relaxed wakefulness and often during periods of relative physical and mental inactivity. In normal EEG, a dominant alpha rhythm is present over the posterior aspect of the head and lies within the 8- to 13-Hz bandwidth. Measures of the alpha rhythm vary over time and are age-dependent, reflecting the changing physiology of brain function with aging. Only 1% of a healthy young population has an alpha rhythm of 8 Hz. While an 8-Hz alpha rhythm is considered normal for an adult, this broad interpretation should be liberally applied in adults greater than 65 years of age but more restrictive in younger patients. With advancing age, the alpha rhythm frequency steadily declines, though should remain stable with normal frequencies of 8 Hz even into late life. Therefore, even in those greater than 80 years of age, an alpha rhythm of 7.5 Hz should be viewed critically as an abnormality.
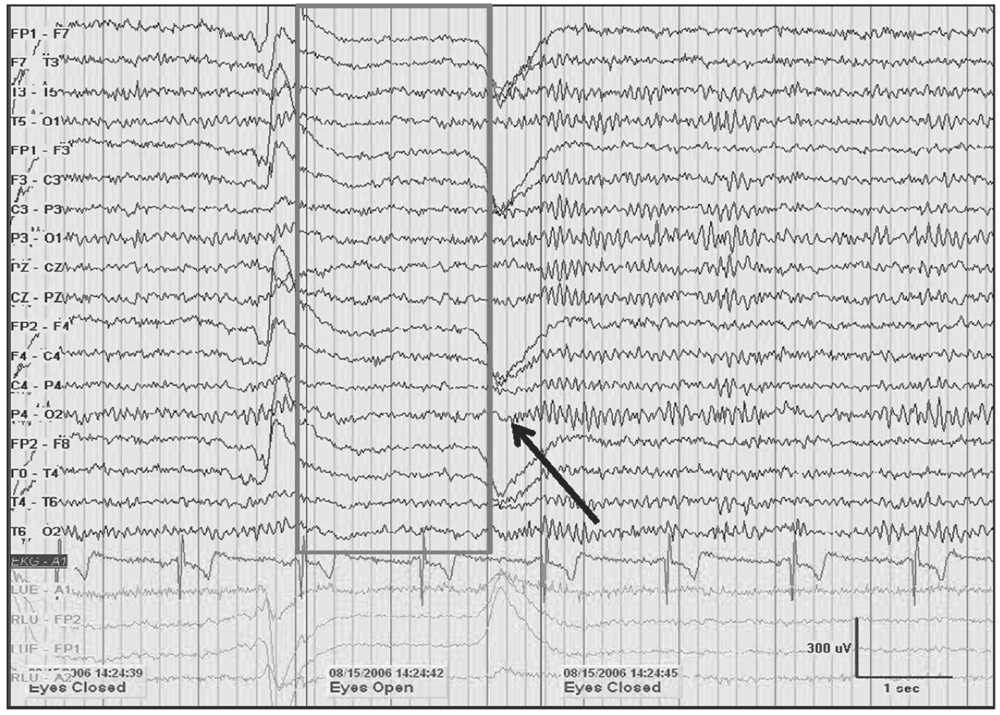
Figure 5.1: A 10-Hz alpha rhythm in an awake 45-year-old woman with spells dissipates when the eyes are opened (gray box). A return of alpha is noted demonstrating reactivity upon eye closure (black arrow). Note the increase in frequency immediately following eye closure known as alpha squeak.
Reactivity is a characteristic of the alpha rhythm. Attenuation of the alpha activity is seen in response to eye opening. With eye closure, there is a return of higher voltage alpha frequencies in the occipital region denoting the reaction to visual input. This “block” is temporary and dependent upon a stimulus that may eliminate or attenuate the voltage of the alpha rhythm. Reactivity may be seen with other forms of stimulation, including cognition, though the most powerful remains eye opening and closure. Complete unresponsiveness of the alpha rhythm is not expected in normal EEG.
In approximately one-fourth of normal adults, the alpha rhythm is poorly visualized or it may be only intermittently visualized. Amplitudes also vary between individuals, over the time of recording and lifetime. Low-amplitude recordings may be present, and in less than 10% of patients, voltages of less than 15 μV are seen. The alpha rhythm is distributed maximally in the occipital regions, and shifts anteriorly during drowsiness. Asymmetries of the alpha rhythm are best assessed at two posterior electrode sites (i.e., parietal and occipital), with both bipolar and referential recordings to ensure consistency. Higher amplitudes are usually noted over the right hemisphere between 20 and 60 μV in the majority of individuals from peak to peak. Using the P4-O2 derivation, normal amplitudes of 15 to 45 μV are typically encountered. Higher amplitudes are noted with slower alpha rhythms. Voltage asymmetries of greater than 50% should be regarded as abnormal. When the left side is greater than the right by greater than 35%, it is more likely to be associated with abnormality.
The morphology of the alpha rhythms is typically sinusoidal, though at times may normally appear with a sharp surface negative component especially in younger patients. It may show a waxing and waning “beating” pattern due to varying amplitudes. These alpha “spindles” may be noted in some people, while in others, this pattern is absent. The spindle pattern, however, is a continuous pattern unlike the proper use of the term spindle that is associated with sleep. The cerebral field involved with the alpha rhythm involves the posterior quadrant of the head. When it extends into the central regions, it may be confused with mu. If the temporal region is involved, it may be misinterpreted as an abnormal epileptiform discharge (4). Some temporal alpha may be detected in the presence of a breach rhythm and is believed to be independent of the posterior alpha and mu rhythms, and has therefore been referred to as the “third rhythm” (12).
Unilateral failure of the alpha rhythm to attenuate reflects an ipsilateral abnormality involving the posterior head region (Bancaud’s phenomenon). Paradoxical alpha occurs when alertness results in the presence of alpha and drowsiness does not. Alpha harmonics are normal features of the alpha where frequencies that are exactly two times the alpha (supraharmonics) or one-half the frequency (subharmonics) are seen (Fig. 5.2).
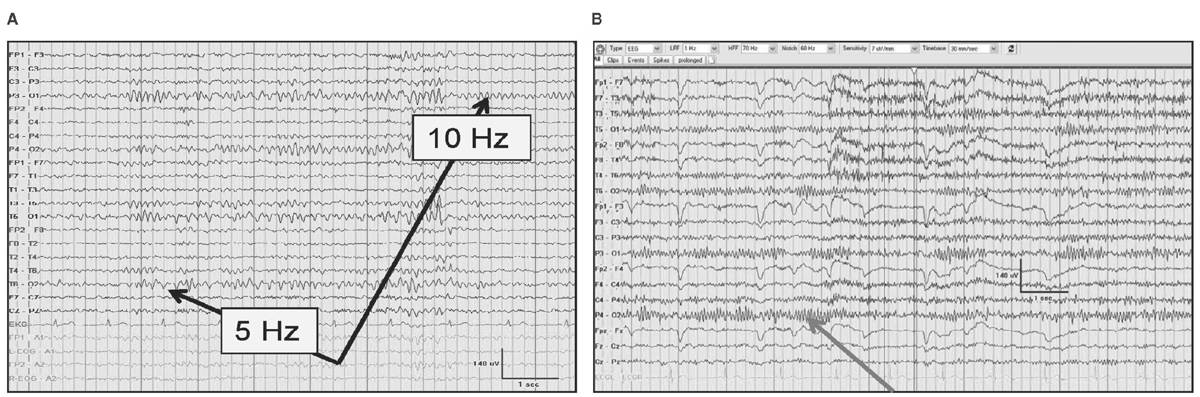
Figure 5.2: The alpha rhythm noted in the occipital region in two-thirds of patients (black arrows) with subharmonics below (A) during drowsiness that is half the frequency of the normal 10-Hz alpha rhythm. In (B), an alpha rhythm is less than 13 Hz occasionally, not due to a supraharmonic in a 24-year-old after cardiac transplantation.
No sex-dependent differences in the alpha rhythm is seen in the EEG (13). The relationship of the menstrual cycle relative to EEG has been proposed, with acceleration of the alpha frequency and amount reduced in the premenstrual phase, with slowing of the alpha and amount increased during menses (14). A relationship to body temperature has been shown with acceleration of the alpha rhythm during rising body temperatures. Cardiac pacemakers have been shown to increase the alpha frequency by more than 1 to 2 Hz, probably due to increased cardiac output and improved cerebral blood flow (15). Drugs that are used even as prescribed may result in slowing of the alpha rhythm. In cancer patients exposed to hyperthermia of 41°C for treatment purposes, slowing of the alpha rhythm is encountered with depression of the electrocerebral activity (16).
Mu Rhythm
The mu (aka motor) rhythm is a normal, centrally located, reactive, alpha frequency. It has characteristics that are similar to the alpha rhythm but it is physiologically distinct. However, it has been referred to as the “somatosensory alpha rhythm” with a restricted central location approximating the pre- and postcentral gyrus to approximate the sensorimotor cortex in relaxed wakefulness. Mu is typically asymmetric and asynchronous with interhemispheric shifting. It is well localized to the C3 and C4 electrode locations, and is associated with a characteristic physiologic reactivity. The frequency of mu is 10 Hz and frequencies less than 8 Hz are probably abnormal. The mu rhythm has been identified in the first year of life and is believed to reflect the early developmental necessity of evolving motor function during early life. The reactivity of mu may mimic the central spread of the alpha rhythm. Though in contrast to the alpha rhythm that is eliminated by eye opening, the mu rhythm is eliminated by movement of a contralateral limb (17). The reactivity of a mu rhythm highlights the impact of cognition on EEG desynchronization on motor function (18). The reactivity of mu has been shown in amputees attempting to initiate movement of an amputated limb. Furthermore, just the thought of a movement has been enough to create a bilateral blocking response. Light tactile stimulation to create a sensation and enhancement by photic stimulation has been demonstrated to compound the idea of the sensory-motor function of mu rhythm to implicate both sensory and visual integration (14). Quantitative EEG (qEEG) has suggested that the mu is separate from the alpha rhythm and that the rolandic beta is separate from a harmonic of the mu rhythm (19). The 10-Hz frequency of the mu rhythm is most often encountered. It is believed that this frequency reflects the sensory cortical function, while 20-Hz reactive beta frequencies producing a notched appearance in the mu rhythm have been suggested to have a greater correlation with motor function (20). During yoga, more than one element of the mu rhythm may coexist in the same individual (14).
Beyond the similar frequency that may slow with age, the distribution of mu is typically asymmetric and asynchronous. It may appear in brief bursts and prolonged runs. It can be differentiated from alpha rhythm despite the similarities by the asymmetry of the mu rhythm and the symmetry of an alpha rhythm. The amplitude of the mu rhythm is usually lower than the amplitude of the alpha rhythm. Morphological differences may be noted (Fig. 5.3). The morphology is arciform with a comb-like appearance. The prevalence of mu has varied depending on the author, though with computerized EEG, mu can be identified in most. When a lesion in the central region exists, this may diminish the presence of the corresponding mu rhythm or reduce its reactivity (21). When mu is strictly unilateral, an ipsilateral breach rhythm or rolandic cortical disturbance should be considered. When it is persistent, unreactive, and associated with focal slowing, mu-like frequencies are abnormal.
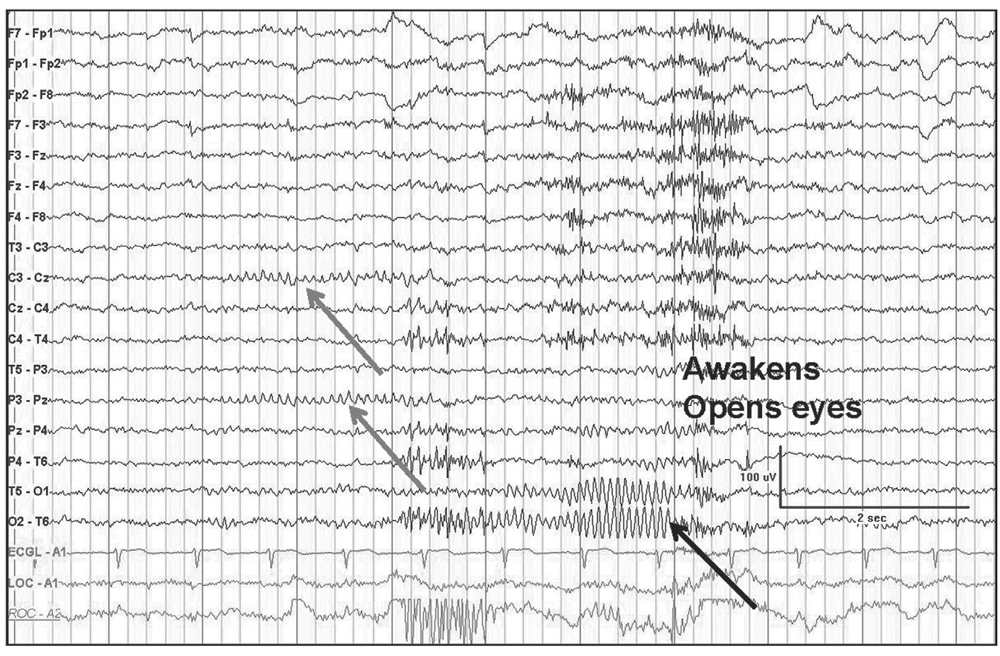
Figure 5.3: Transverse bipolar montage demonstrating a mu rhythm (gray arrows) as a “fragment” of the occipital alpha rhythm (black arrow). Not the similar frequencies but different localization, reactivity with eye closure, and mu assymmetry.
In epilepsy management, the mu rhythm has served as a reference point for treatment using biofeedback (14).
Beta
Beta rhythms represent frequencies that are more than 13 Hz. They are also referred to as “fast” frequencies. Beta is a frequency that is found in most normal adult EEG. Beta activity normally increases during drowsiness, light sleep, and with mental activation. Beta is a common frequency and is most often observed within the 18- to 25-Hz bandwidth in normal people with a voltage of less than 25 μV. Most frequencies higher than 80 Hz are beyond the detection limits of scalp EEG, with beta represented by frequencies greater than 13 Hz and less than 30 Hz. A frontal-central field is most often encountered and may even appear as a brief train that exceeds 30 Hz when sleep is achieved. Rarely, a posterior dominant rhythm may appear to be present that lies in the beta frequency bandwidth. With the faster beta frequencies, voltages beyond 25 μV in amplitude are abnormal and amplitudes greater than 30 μV are unusual. Persistently reduced hemispheric voltages of greater than 50% suggest a cortical gray matter abnormality within the hemisphere having the lower amplitude. Lesser asymmetries may simply reflect normal skull thickness differences. Vertex beta should prompt a search for cortical dysfunction affecting the frontal region. Focal central beta has been related to a mu rhythm demonstrating normal reactivity to motor or tactile stimuli. A skull defect may produce a breach rhythm that produces focal beta activity (Fig. 5.4). Benzodiazepines, barbiturates, and chloral hydrate are potent activators of generalized “fast activity.” Hypnotic agents usually occur within the 18- to 25-Hz bandwidth and may reach greater than 50 μV occupying greater than 50% of the tracing. However, enhanced beta activity alone is without specificity to interpret an EEG record as abnormal (14,22). Not unexpectedly, with the prevalence of sedatives and tranquilizer use (Fig. 5.5) in patients with psychiatric disorders, the beta frequencies may have a greater representation in this population, though it is of no clinical significance (23). Some frontal beta may appear close to 30 Hz, especially during sleep. Even higher frequencies in the gamma range and above may occur with normal physiological functions that are involved in cognition (24,25).
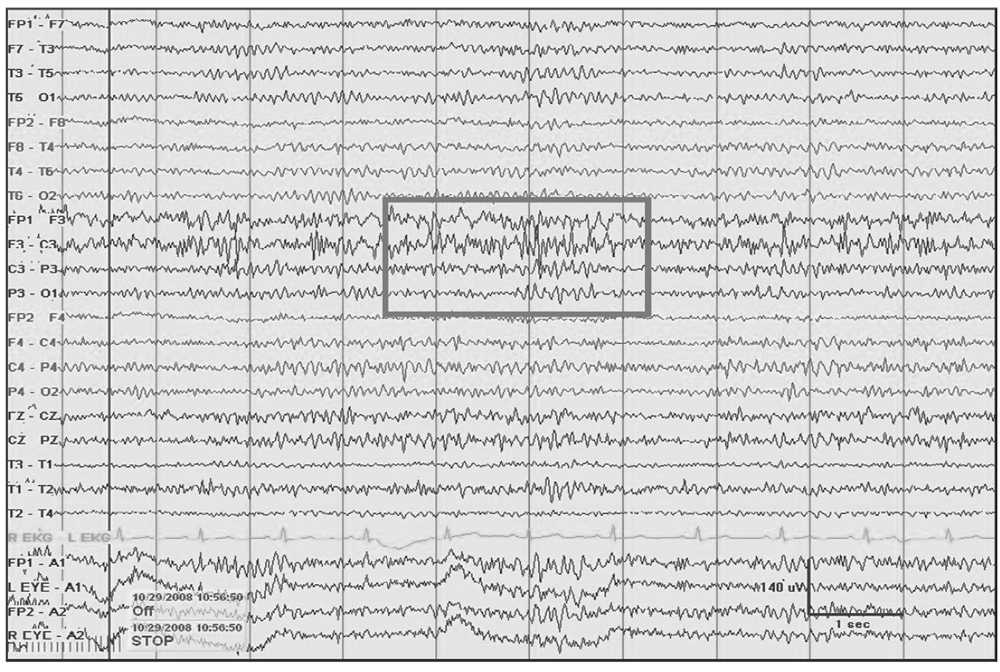
Figure 5.4: Left frontal breach rhythm (gray rectangle) with prominent beta activity at F3 electrode derivation and admixed 5- to 6-Hz theta seen at a focal region following a craniectomy for resection of a cavernous vascular malformation.
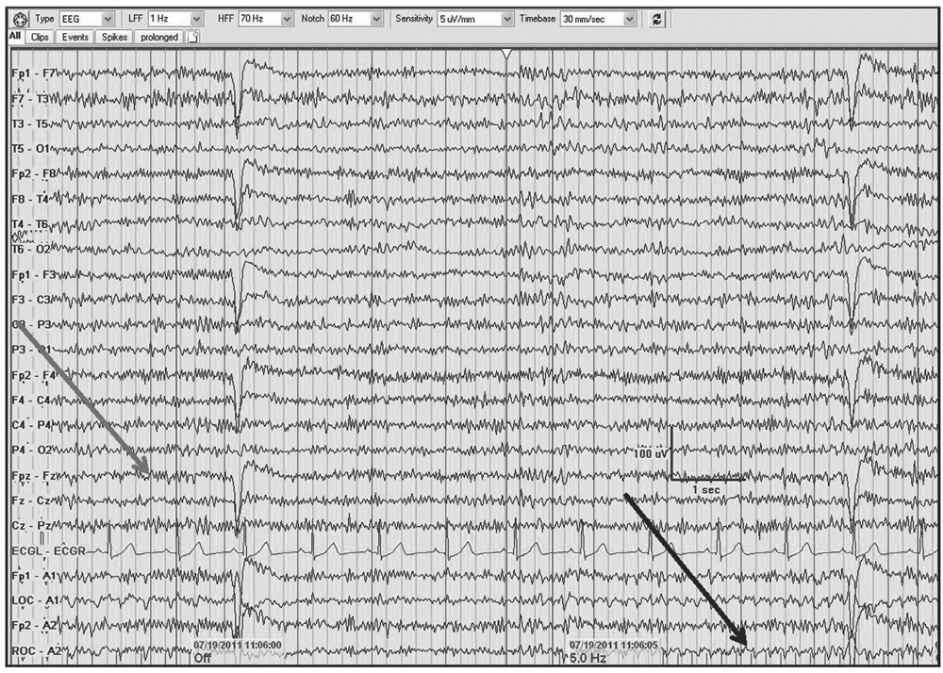
Figure 5.5: AP longitudinal bipolar montage with diffuse 20- to 25-Hz beta activity associated with alprazolam and oxycodone (gray arrow). Note the photoelectric response (black arrow) with the infraorbital electrode/eye movement monitor in association with the photic stimulation.
Theta frequency is composed of 4- to less than 8-Hz activity in the EEG. Approximately one-third of normal young adults may show intermittent 6- to 7-Hz theta rhythms during wakefulness (Fig. 5.6A). It appears as rhythmic activity that is maximal in the frontal or frontocentral head regions, typically with amplitudes that are less than 15 μV, though varying amplitude and morphologies may be encountered. The presence of anterior predominant rhythmical theta may persist into to adolescence and young adulthood. The appearance of frontal theta can be facilitated by heightened emotions, concentration, and during mental activities such as problem solving (26). Theta activity is normally enhanced by hyperventilation (HV). It may also occur in bursts during drowsiness and sleep transitioning. It is normally limited in the adult during the waking record. The appearance of theta in the EEG frequently occurs as a normal developmental feature, yet it may persist until 25 years of age (14). It was felt to be an intermediate bandwidth between alpha and delta frequencies, with continuous focal theta suggesting nonspecific abnormality (Fig. 5.6B). A long-standing recommendation in considering abnormal theta has been to consider it abnormal in awake patients if it is present in persistent focal bursts or runs. While this quantification seems helpful, its presence is more likely related to the state and age of the patient, rather than reflecting a specific abnormality. In the elderly, intermittent bitemporal 4- to 5-Hz activity or even theta with a lateralized predominance (usually left > right) may occur in about one-third of the asymptomatic normal seniors (14,27).
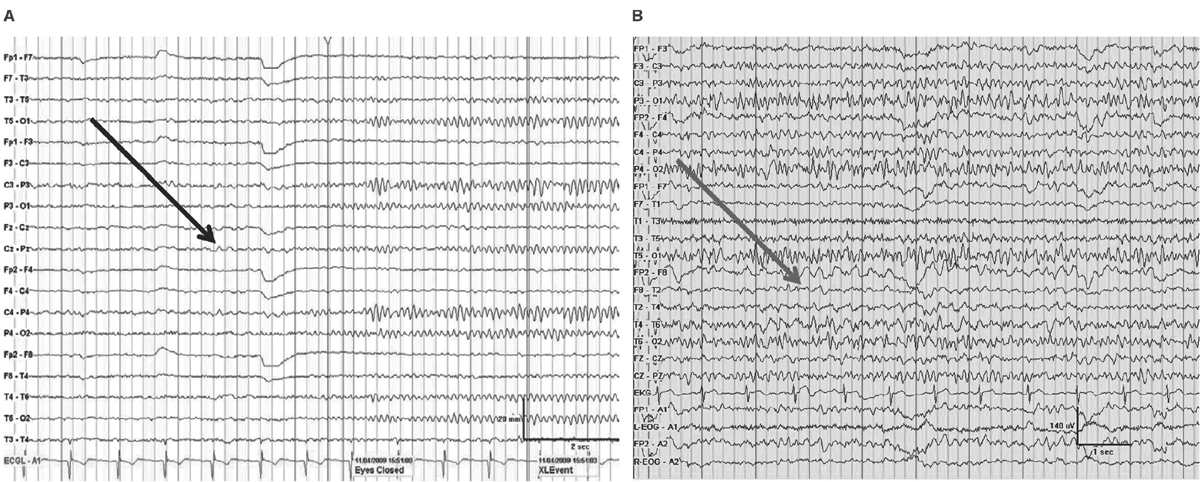
Figure 5.6: Bipolar montage demonstrating (A) normal 6- to 7-Hz theta prior to eye closure (black arrow) in an awake 22-year-old during mental concentration and (B) right temporal continuous theta (gray arrow) in a 35-year-old with right temporal lobe epilepsy.
Delta
Delta frequencies consist of activity that is less than 4 Hz. Delta may be considered normal in young children less than 10 years of age as well as in normal elderly individuals. In children, posterior slow waves of youth (PSWY) are posterior delta frequencies that are prominent during childhood persisting through young adulthood (Fig. 5.7A). Between ages 6 and 12 years, arrhythmic delta complexes may be intermixed with the alpha rhythm in the occipital head regions. They typically have a duration of 200 to 400 milliseconds and are of moderate voltage (i.e., <120% of the background). They react like alpha, with elimination during eye opening and reappearance with eye closure. Rarely, there may be a superimposition of the alpha rhythm to “fuse” with PSWY, mimicking a sharp slow-wave complex (Fig. 5.7B). The similarity in distribution, frequency, morphology, and reactivity are the clues to distinguishing PSWY amidst the alpha rhythm from an interictal epileptiform discharge (IED). In the older adults, single complexes of delta may occur in the anterior temporal regions (Fig. 5.8). The contention that these focal features are normal has been controversial. They have been associated with normal seniors and are found in greater than one-third of people greater than 60 years of age (27). Rare unsustained single complexes of left temporal delta in the elderly are considered normal findings incurred during the aging process (28). Still, the association between focal temporal slow waves and mild cognitive impairment with white matter hyperintensities on brain magnetic resonance imaging (MRI) suggests a spectrum EEG features on the normal-abnormal continuum associated with aging (29,30). Another delta frequency that may be seen in the healthy elderly is anterior dominant rhythmic delta that occurs during sleep onset. This normal finding encountered during sleep onset resembles frontal intermittent rhythmic delta activity (FIRDA) in morphology, though is not present as an abnormality during wakefulness (31).
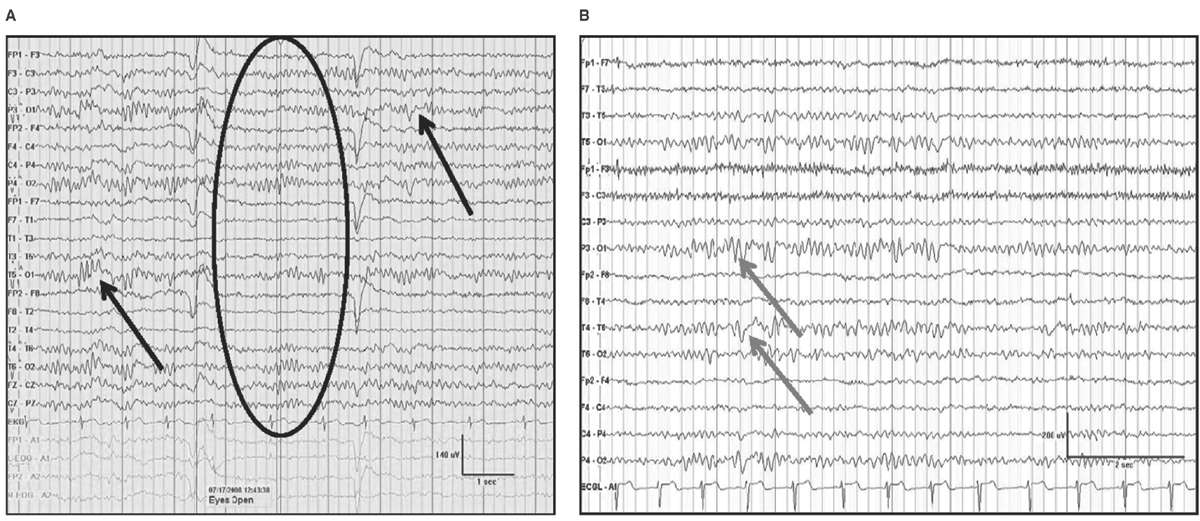
Figure 5.7: AP longitudinal bipolar montage with (A) demonstrating reactivity (black arrow) in a 20-year-old with PSWY. In (B), there is the appearance of the alpha rhythm coupled with PSWY (gray arrow) to produce the false appearance of a sharp-and-slow-wave complex.
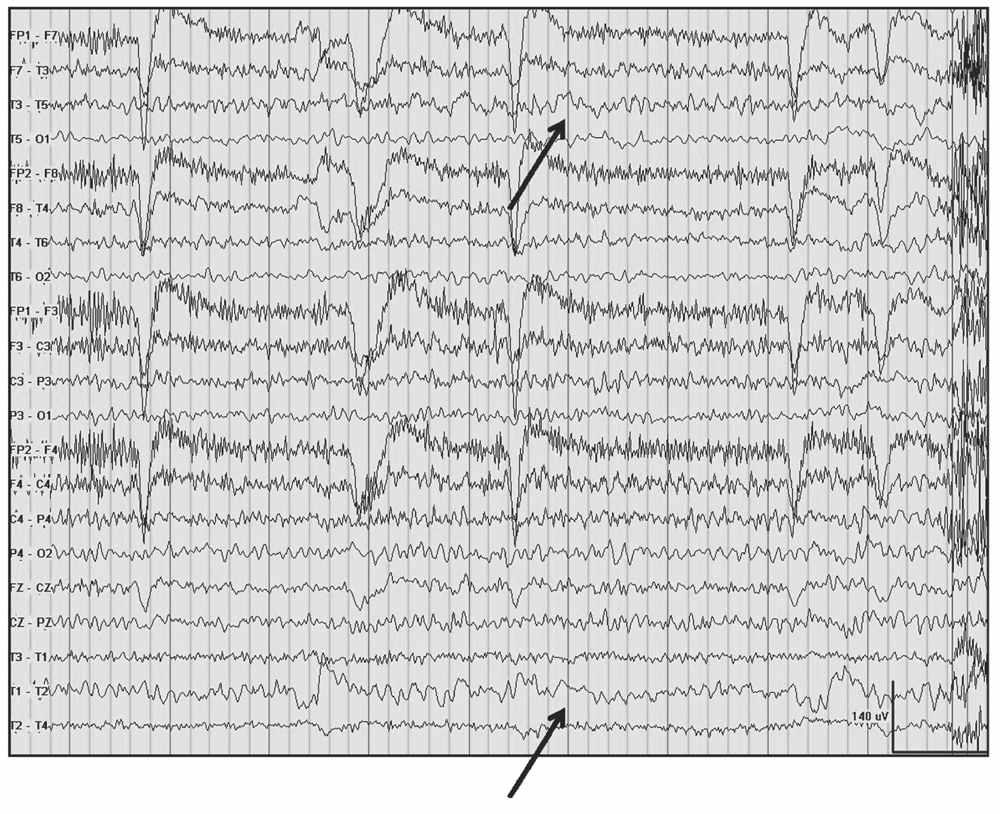
Figure 5.8: Left temporal delta (arrows) and theta awake in a 91-year-old nun admitted for evaluation of headache.
Stay updated, free articles. Join our Telegram channel

Full access? Get Clinical Tree


