Chapter 18 Myocardial Perfusion Imaging with Contrast Echocardiography
ULTRASOUND CONTRAST AGENTS
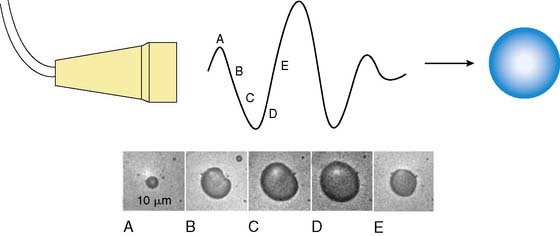
MCE is performed by combining ultrasound imaging with simultaneous intravascular injection of microbubbles that produce ultrasonic backscatter. Microbubbles undergo oscillation in an acoustic field whereby they compress and expand at the pressure peaks and nadirs, respectively (Fig. 18-1).1,2 Radial oscillation of microbubbles results in the generation of acoustic signals that greatly exceed backscatter produced solely by reflection or alteration in acoustic impedance. The ultrasound frequency required to produce backscatter depends on both the compressibility and size of the microbubble and fortuitously is within the range of frequencies routinely used for diagnostic ultrasound.2
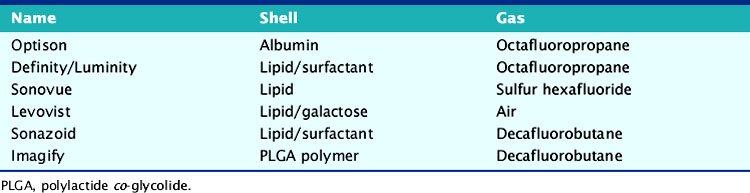
There has been substantial progress in the formulation of microbubble contrast agents that can be used to opacify the left heart after intravenous administration. These advancements have resulted from the development of stable encapsulated microbubbles with a narrow size distribution, typically between 2 and 6 μm in diameter, that are able to pass freely through pulmonary and systemic capillaries (Table 18-1). The stability and size optimization for these newer agents has occurred from the modification of the microbubble gas content and shell. Inert biologically safe gases have been used that have low diffusion coefficients and low solubility in water or blood, which reduces bubble collapse.3,4 These include octafluoropropane (C3F8), decafluorobutane (C4F10), dodecafluoropentane (C5F12) and sulfur hexafluoride (SF6). Shells are typically composed of protein (albumin), lipid surfactants, or biopolymers (e.g., lactide polymers). In addition to controlling size, the presence of a shell reduces outward diffusion and surface tension, thereby improving in vivo stability as well as shelf life. The use of air or nitrogen alone rather than high-molecular-weight gases in microbubble contrast agents is still possible, provided that the shell is relatively impermeable to low-molecular-weight gases. Strategies to decrease permeability can adversely affect the compressibility of microbubbles and, hence, their signal generation in an acoustic field.5
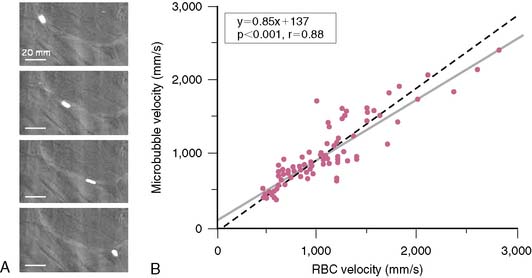
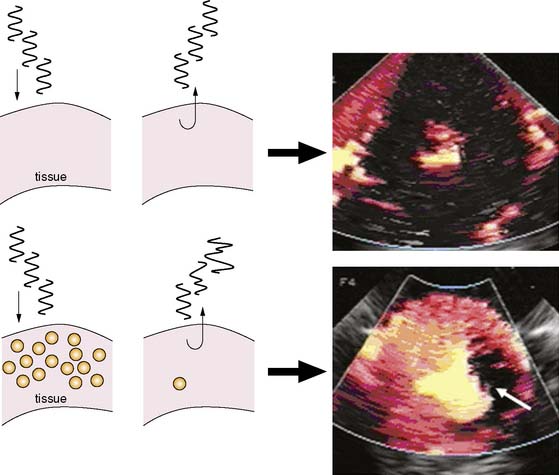
Since microbubbles can be directly visualized by microscopy, their in vivo behavior in the microcirculation can be assessed by intravital microscopy (Fig. 18-2). Studies have demonstrated that after intravenous injection, microbubbles transit the microcirculation of normal muscle beds unimpeded. These agents do not coalesce or aggregate, do not affect microvascular hemodynamics, and have a velocity profile similar to erythrocytes in arterioles, venules, and capillaries.6,7 After venous injection, any microbubbles larger than the average capillary dimension become entrapped by the pulmonary circulation. The extent of retention is directly related to the proportion of microbubbles that are larger than approximately 5 μm, which is relatively low (<1% to 2%) for most commercial microbubble agents. Moreover, entrapment of microbubbles in pulmonary capillaries or very small arterioles is transient, owing to gradual gas loss and deformability of the microbubbles, which allow their eventual release.6 As a result, venous injection at clinically relevant doses produces no significant alterations in pulmonary or hemodynamics or myocardial blood flow.7,8
Concerns regarding the safety of ultrasound contrast agents were raised with the announcement of a safety warning by the U.S. Food and Drug Administration (FDA) in 2007 that included a temporary placement of new contraindications to microbubble agents. These actions were prompted based on the report of several deaths that occurred within 30 minutes of contrast administration. These events, however, occurred mostly in critically ill patients against a background of more than 2 million doses administered in the United States. The FDA action triggered multiple large safety studies that have in aggregate examined hundreds of thousands of patients in whom ultrasound contrast agents have been administered. These studies indicate an excellent safety profile with no significant mortality risk with ultrasound contrast agents.9 Based on these findings and their own internal review, the FDA withdrew the contraindications in 2008.
Microbubble contrast agents have the potential to activate complement at their surface, similar to liposomal drugs and almost any therapy or diagnostic procedure that involves microparticle or nanoparticle administration. This response is in part responsible for clearance of microparticles. For lipid-encapsulated ultrasound contrast agents, the extent of complement activation is influenced by the net charge and presence of protective polymers such as polyethylene glycol, on the shell surface.10 This complement activation is likely responsible for reports of anaphylactoid reactions in patients receiving microbubble contrast agents, although the incidence of these reactions is very small (1 in 10,000),11 resulting in a safety profile that is favorable compared to most other contrast agents and cardiovascular diagnostic procedures.
IMAGING MICROBUBBLES IN TISSUE
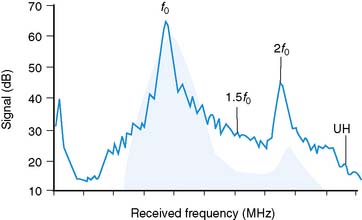
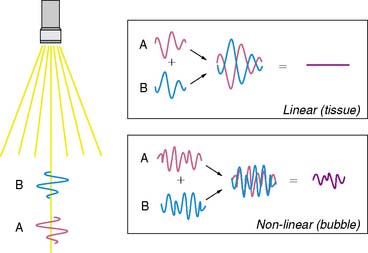
As stated earlier, the ability of microbubbles to compress and expand in the alternating pressure environment of an acoustic field forms the basis for their use as contrast agents. The magnitude of bubble vibration is dependent on the compressibility and density of the gas, the viscosity and density of the surrounding medium, the frequency and power of ultrasound applied, and initial microbubble radius.12,13 The degree of signal enhancement and signal-to-noise ratio during MCE is not, however, simply related to the degree of vibration in a monotonic fashion. When exposed to ultrasound at sufficient power and within the diagnostic frequency range for echocardiography, oscillation of microbubbles will occur in a nonlinear fashion in relation to acoustic pressure, meaning that even a small acoustic input will produce a large effect. At very high power, exaggerated microbubble oscillation will lead to microbubble disruption.2,14 Nonlinear oscillation and microbubble destruction produce a broad band of acoustic frequencies that occur outside the bandwidth of the transmission (fundamental) frequency. This broadband signal includes intensity peaks at the harmonic frequencies (multiples of the transmit frequency) and, in certain circumstances, subharmonics (even fractions of the transmit frequency) (Fig. 18-3). Because these harmonic signals emanate preferentially from microbubbles rather than tissue, the signal-to-noise ratio during MCE is improved when receiving at harmonic or subharmonic frequencies.14,15 In a similar fashion, it is also possible to improve signal-to-noise for ultrasound contrast agents by filtering for signals between the harmonic peaks where the difference between bubble and tissue signal is even greater.
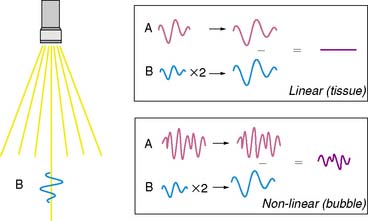
Imaging at low to intermediate acoustic powers produces nonlinear oscillation without microbubble destruction. This response produces harmonic signals at a low amplitude so that it becomes desirable to eliminate all tissue signal in order to maximize signal-to-noise ratio. Signal processing techniques have been developed for this purpose. One technique termed pulse-inversion or phase-inversion is depicted schematically in Figure 18-4.15 For each transmitted line, two successive pulses of ultrasound (A and B) are sent that are phase-inverted. Tissue produces linear signals that have equal amplitudes and 180-degree phase shifted for the two pulses. Thus summing these up results in no signal. In contradistinction, microbubbles produce nonlinear signals, and their summation does not cancel the signal, resulting in signal only from bubbles and not from tissue. Tissue signal can also be eliminated by alternating acoustic power rather than phase, termed amplitude or power modulation (Fig. 18-5).15 Successive in-phase pulses are transmitted for each line, alternating between intermediate power and half amplitude or low power. Linear signals that return from tissue are similar in phase and frequency. Accordingly, these can be eliminated by doubling the half-amplitude signal and subtracting this from the intermediate power signal. Since microbubbles produce a nonlinear signal at only the intermediate power, doubling the low-power linear signal will not result in complete cancellation of signal. Signals that are not cancelled are displayed according to amplitude, and since non-cancellation occurs even at the fundamental frequency, receive bandwidth can be broadened to include relatively stronger fundamental frequencies.
A final method for amplifying microbubble signal-to-noise relative to tissue relies on multipulse decorrelation analysis (Fig. 18-6).15 With these methods, a series of high-power pulses are transmitted for each line of ultrasound. The initial pulse(s) will return with nonlinear microbubble signal. Subsequent pulses return with less or no microbubble signal because of destruction from the initial pulse(s). The decorrelation or degree of difference between pulses is determined either by subtraction of the radiofrequency pulse (rate subtraction imaging) or by demodulation from Doppler processing (termed power Doppler imaging). The amplitude of decorrelation is displayed as pixel brightness and reflects the number of microbubbles present in tissue that were destroyed.
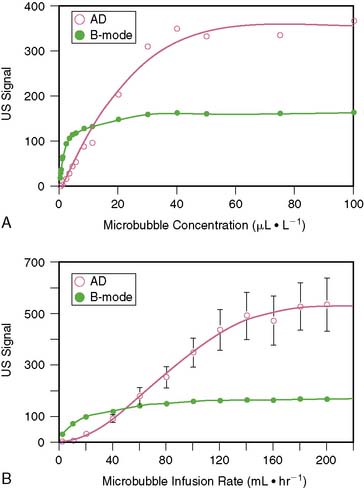
Because of the limited dynamic range of ultrasound transducers, the relation between microbubble concentration and signal intensity is linear only at low to medium concentrations (Fig. 18-7).16 The flat portion of the relation at higher concentrations is due in part to saturation by the upper limit of the dynamic range. Since ultrasound backscatter has to be displayed on a signal screen with an even smaller dynamic range (30 to 40 dB) than the received signal, some compression of the received signal must occur. Accordingly, direct assessment of digital data and imaging modalities that have a broad dynamic range (such as acoustic densitometry) are generally used during perfusion imaging when quantitative information on perfusion is desired.
QUANTIFICATION OF MYOCARDIAL BLOOD FLOW
Quantification of myocardial blood flow with MCE takes advantage of two key features of microbubbles: the rheology of microbubbles is identical to that of erythrocytes and the ability to destroy microbubbles with ultrasound. At steady state, when microbubble concentration in the blood pool is constant, the numbers of microbubbles entering or leaving any microcirculation within the ultrasound beam profile are equal; hence, the acoustic intensity from microbubbles or amount of myocardial contrast enhancement reflects myocardial blood volume (MBV).17 Microbubbles within the ultrasound beam can then be destroyed by high-power ultrasound, after which their rate of replenishment, measured by the rate of increase in acoustic signal, reflects blood velocity or transfer rate through tissue. Perfusion at the microvascular level can be derived by the product of microvascular blood velocity and MBV.17
This concept is diagrammatically represented in Figure 18-8. The elevation (or thickness) of the ultrasound beam is represented by a rectangle with a thickness of E (panel A). After microbubbles are destroyed at t0 by a pulse of ultrasound (panel A), new microbubbles will begin to replenish the ultrasound beam elevation. As the pulsing interval (PI) is increased (panels B to E), there is more time for replenishment to occur between each destructive pulse of ultrasound, and the degree of microbubble replenishment into the elevation increases. Signal intensity will progressively increase at longer PIs (panel F). The rate of rise of signal intensity depicts myocardial blood flow velocity.17 When the PI is long enough for the entire ultrasound beam elevation to be completely replenished with microbubbles (panel E)
Stay updated, free articles. Join our Telegram channel

Full access? Get Clinical Tree


