The contribution of postimplant optimization of device settings to the beneficial effect of cardiac resynchronization therapy (CRT) in heart failure is uncertain. We performed a meta-analysis to investigate the impact of CRT optimization on the improvement of left ventricular function, exercise capacity, and quality of life. We undertook a systemic review of the evidence from a search of relevant controlled clinical studies in the MEDLINE and EMBASE databases. Changes in left ventricular ejection fraction (LVEF), 6-minute walk distance, and Minnesota Living with Heart Failure score at follow-up were assessed; the primary outcome was ejection fraction. A random-effects model was used to combine weighted mean difference (WMD) and 95% confidence intervals (CIs). A metaregression was undertaken to assess the impact of potential covariates. Data were collated from 13 studies enrolling 1,431 patients (919 optimized and 669 controls). Pooled analysis demonstrated that the optimization procedure resulted in a significant increase in LVEF (WMD 2.6%, 95% CI 0.8 to 4.4, p = 0.001) as compared with a nonoptimized CRT. No improvements with the optimization of CRT were seen in 6-minute walk distance and quality of life (WMD 12 m, 95% CI 23 to 48, p = 0.49, and 3.6, 95% CI 2.2 to 9.5, p = 0.22, respectively); however, this part of the analysis was performed using limited data. Thus, these collated data suggest that the optimization of CRT leads to a significant but small improvement in LVEF in patients with heart failure. Additional, adequately powered studies are needed to evaluate the effects of this procedure on exercise tolerance and quality of life.
Cardiac resynchronization therapy (CRT) is an accepted therapeutic option in selected patients with drug-refractory heart failure (HF), which has been shown to improve left ventricular (LV) functional and structural remodeling, symptoms, and functional status. However, up to 30% to 40% of CRT-implanted patients receive no benefit from this treatment, and in some of the remainder the improvement is less than expected. Although the reasons for this are multifactorial, one of the possible contributors is thought to be nonoptimal CRT device settings. In view of this, postimplant programing adjustments in atrioventricular (AV) and interventricular (VV) timings maximizing LV filling and stroke volume might translate into favorable clinical effects. Nevertheless, previous studies have yielded inconsistent data on this issue, and the latest guidelines do not advocate CRT optimization as a routine procedure in all patients. Despite the emergence of nonechocardiographic methods, there may still be merit in individual tailoring of intracardiac pacing delays, taking into account hemodynamic response to CRT programing modifications, for which an echo-guided approach might be a reasonable option. The aim of this meta-analysis was to evaluate the impact of echocardiographic optimization of AV and VV intervals on LV function, exercise capacity, and quality of life in patients with HF.
Methods
We performed a search of the MEDLINE and EMBASE databases using the following keywords: optimization, CRT, exercise tolerance, exercise capacity, 6-minute walk, LV ejection fraction (LVEF), cardiac function, LV function, quality of life, biventricular pacing, and echocardiography. This search was then supplemented with careful examination of reference lists of identified reports for any relevant studies missed initially. The search strategy, study selection, and analysis followed Quality of Reporting of Meta-analyses standards (QUOROM) guidelines for meta-analysis.
Included studies were required to evaluate the response to CRT optimization, report information on outcome measures (postoptimization improvement in LVEF, exercise capacity assessed by 6-minute walk distance [6MWD], or quality of life), and use echocardiography as a tool for the optimization procedure and the assessment of LVEF. To avoid bias from improvement unrelated to the optimization of CRT device settings, we incorporated only controlled studies, that is, either with a formal control group or self-controlled. The search was limited to English language literature and human studies. Data including population demographics, cause of HF, New York Heart Association functional class, QRS duration, methods of optimization, time between the implantation and optimization, follow-up duration, LVEF, exercise capacity, and quality of life were extracted and entered into an electronic database.
The outcome measures for this analysis were changes in LVEF, 6MWD, and Minnesota Living with Heart Failure quality-of-life score at follow-up. Other outcome data were considered, but reporting them only in single or very few studies precluded pooled analysis. Studies presenting at least 1 of the aforementioned end points were included in the analysis.
Continuous data are expressed as mean ± SD or median (interquartile range). Categorical data are presented as percentages. Weighted mean differences (WMDs) with 95% confidence interval (CI) were assessed using a random-effects model. Forest plots were constructed to graphically describe the overall effects of optimization versus control. Begg’s funnel plot of SE versus difference in mean was applied to estimate the presence of publication bias. Symmetry of distribution was evaluated with Begg and Mazumdar rank correlation (Kendall’s τ with continuity correction, 2-tailed p). I 2 statistic was computed to evaluate heterogeneity across studies. Metaregression was used to examine the influence of possible covariates (patients’ age, baseline LVEF, ischemic origin of HF, time interval between CRT implantation and optimization, and duration of follow-up) on the outcomes measures. All calculations were carried out using Comprehensive Meta-analysis V.2 software (Biostat, Englewood, New Jersey). A 2-sided p value of <0.05 was indicative of statistical significance.
Results
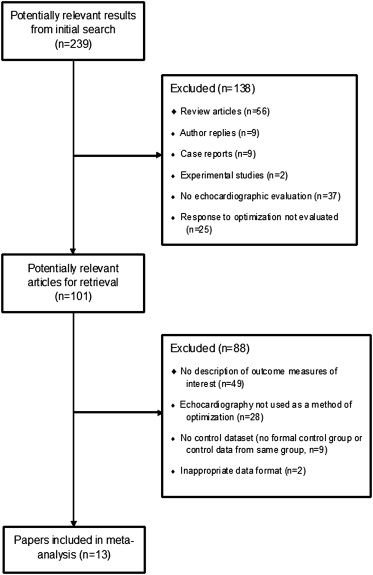
After the selection process ( Figure 1 ), we included 13 studies satisfying the inclusion criteria, involving 1,431 patients (919 optimized and 669 controls). The median duration of follow-up was 6 months (range 0 to 12) and the median time from the implantation to optimization of CRT device was 7 days (range 1 to 300). In 10 studies, both AV and VV optimal settings were programed, whereas in 3, only AV delay was optimized. The Ritter or iterative methods were the most frequently used for AV optimization (in 10 studies), whereas the LV outflow tract velocity time integral method was used for VV optimization (in 6 studies; Table 1 ).

| First Author | Year | Study Group (n) | Control Group (n) | Optimization | Method of VV Optimization | Method of AV Optimization | Time Between Implantation and Optimization (Days) | Follow-Up Duration (Mo) | Randomized | Blinded | |
|---|---|---|---|---|---|---|---|---|---|---|---|
| Study Group | Control Group | ||||||||||
| Sogaard | 2002 | 20 ∗ | 20 ∗ | AV + VV | AV | TDI TT | Ritter | 2 | 3 | No | No |
| Sawhney | 2004 | 20 | 20 | AV | None | None | LVOT VTI | 1 | 3 | Yes | Yes |
| Leon | 2005 | 340 | 216 | AV + VV | AV | LVOT VTI | Ritter | 7 | 6 | No | No |
| Boriani | 2006 | 91 | 30 | AV + VV | AV | LVOT VTI | Ritter | 7 | 6 | Yes | Yes |
| Morales | 2006 | 23 | 15 | AV | None | None | Doppler dP/dt | 102 | 6 | No | Yes |
| Vidal | 2007 | 51 | 49 | AV + VV | None | TDI TT | Iterative | 1–3 | 6 | No | No |
| Boriani | 2009 | 34 | 14 | AV + VV | AV | LVOT VTI | Ritter | 7 | 6 | Yes | Yes |
| Marsan | 2009 | 69 ∗ | 69 ∗ | AV + VV | AV | LVOT VTI | Iterative | 3 | 0 | No | No |
| Duvall | 2010 | 43 ∗ | 43 ∗ | AV + VV | AV | LVOT VTI | Mitral velocities | 300 | Not stated | No | No |
| Abraham | 2012 | 122 | 116 | AV + VV | AV | SPWMD | Ritter | 12 | 6 | Yes | Yes |
| Sonne | 2012 | 25 ∗ | 25 ∗ | AV + VV | AV | SDI | LVOT VTI | 1 | 0 | No | No |
| Shanmugam | 2013 | 50 | 22 | AV | None | None | Iterative | 93 | 5 Days | No | No |
| Xu | 2013 | 31 | 30 | AV + VV | None | LVOT VTI | Iterative | 2 | 12 | Yes | Yes |
All patients recruited to the identified studies were in the New York Heart Association functional class III and IV, with LVEF <35% and prolonged QRS. The weighted mean age was 67 years and most were men (70%). Coronary heart disease accounted for 54% of HF ( Table 2 ).
| First Author | Year | No of Patients | Age (yrs) | Men (%) | NYHA | LVEF (%) | QRS (ms) | Ischemic Origin of HF (%) |
|---|---|---|---|---|---|---|---|---|
| Sogaard | 2002 | 20 | 66 ± 8 | 85 | III–IV | 22 ± 6 | 176 ± 25 | 55 |
| Sawhney | 2004 | 40 | 59.8 ± 12.1 | 70 | III–IV | 26 ± 5 | 176 ± 22 | 45 |
| Leon | 2005 | 556 | 66 ± 11 | 59 | III–IV | 22 ± 7 | 164 ± 22 | 46 |
| Boriani | 2006 | 121 | 67 ± 9 | 83 | III–IV | 24 ± 6 | 175 ± 22 | 63 |
| Morales | 2006 | 38 | 69 ± 2 | 63 | III–IV | 25 ± 1 | 163 ± 4 | 34 |
| Vidal | 2007 | 100 | 70 ± 8 | 81 | III–IV | 24 ± 7 | 175 ± 26 | 47 |
| Boriani | 2009 | 48 | 68 ± 9 | 81 | III–IV | 21 ± 6 | 176 ± 15 | 71 |
| Marsan | 2009 | 69 | 66 ± 10 | 84 | III–IV | 23 ± 8 | 163 ± 32 | 59 |
| Duvall | 2010 | 43 | 65 ± 12 | 66 | III–IV | 26 ± 8 | 151 ± 29 | 39 |
| Abraham | 2012 | 238 | 67 ± 10 | 78 | III–IV | 23 ± 7 | 156 ± 20 | 78 |
| Sonne | 2012 | 25 | 67 ± 11 | 56 | III–IV | 23 ± 7 | 160 (122–198) | 56 |
| Shanmugam | 2013 | 72 | 73 ± 12,5 | 71 | III–IV | 29 ± 8 | 160 ± 29 | 56 |
| Xu | 2013 | 61 | 66 ± 9 | 83 | III–IV | 25 ± 9 | 181 ± 28 | 35 |
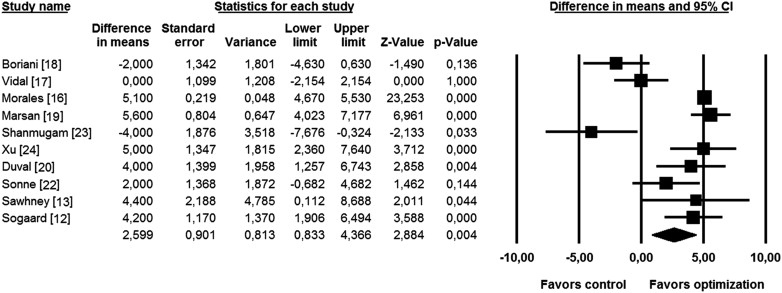
Significant improvement in LVEF resulting from CRT optimization was seen in 6 of 10 studies comprising relevant information on this parameter. The effect was neutral in 1 study and insignificant in 1 study favoring optimization and in 1 study favoring controls. Overall, the WMD in LVEF between the optimized and control groups was 2.6% (95% CI 0.8 to 4.4, p = 0.001; Figure 2 ). Funnel plot analysis revealed no significant publication bias (Kendall’s τ = 0.22, p = 0.37).

The subanalysis evaluating the effect of adding VV optimization to already optimized AV interval, performed in the set of 5 studies, also demonstrated a significant increase in LVEF (WMD 2.9%, 95% CI 0.8 to 4.4, p = 0.03; Figure 3 ). Collating 3 studies with AV optimization only showed no significant improvement in LVEF in the optimized group (WMD 2.0%, 95% CI −1.1 to 4.7, p = 0.49; Figure 4 ).


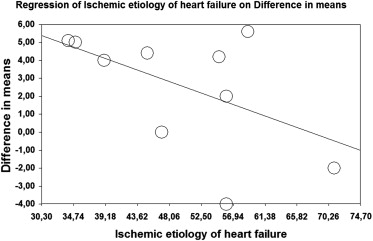
A mixed-effects metaregression of all 10 studies reporting LVEF demonstrated that increase in LVEF was independent of patients’ age (p = 0.86), baseline LVEF (p = 0.92), time interval between implantation and optimization (p = 0.65), and follow-up duration (p = 0.50). However, response was negatively associated with HF of ischemic origin (percentage of ischemic patients as a moderator variable, p = 0.04; Figure 5 ). The influence of ischemic origin of HF on LVEF improvement was not shown in the metaregression performed in 5 studies evaluating the effect of VV optimization (p = 0.27).

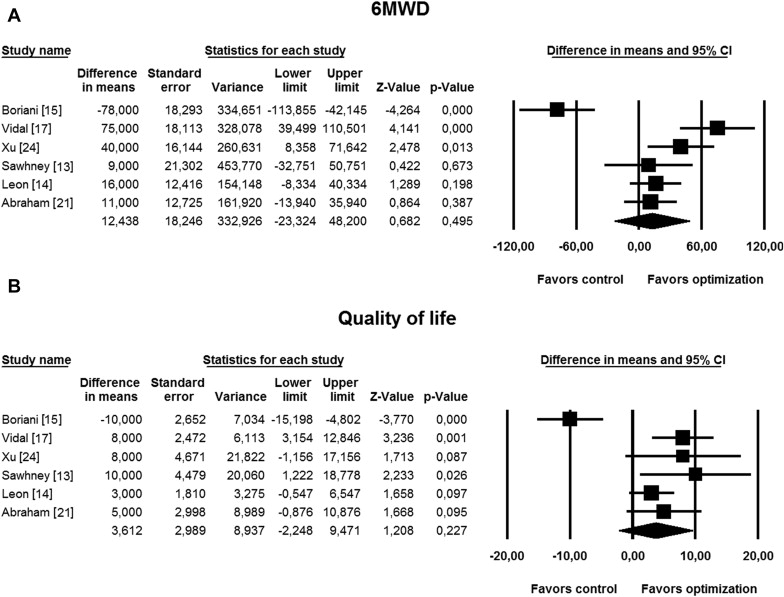
Pooled analysis including 6 studies providing data on 6MWD and quality of life exhibited no significant improvements in these parameters with CRT optimization (WMD 12 m, 95% CI −23 to 48, p = 0.49 for 6MWD and 3.6, 95% CI −2.2 to 9.5, p = 0.22 for quality of life; Figure 6 ). Likewise, no statistical significance was found when 3 studies evaluating VV optimization were analyzed together (WMD −15 m, 95% CI −66 to 36, p = 0.56 for 6MWD and −0.6, 95% CI −9.3 to 8.1, p = 0.88 for quality of life). Funnel plot analysis showed no significant publication bias (Kendall’s τ = −0.67, p = 0.30 for 6MWD and τ = 0.27, p = 0.45 for quality of life).


