Disease
Indications
Ischemic heart disease
Diagnosis of patients with intermediate pretest probability who have an uninterpretable ECG or who are unable to exercise. Vasodilator perfusion CMRI or dobutamine CMRI should be used.
Assessment of myocardial viability after myocardial infarction and before revascularization to determine likelihood of functional recovery. DE-MRI should be used.
Cardiac failure
Accurate quantification of left ventricular function.
Assessment of specific causes of cardiac failure (e.g., infiltrative cardiomyopathy, dilated cardiomyopathy, or myocarditis).
Arrhythmogenic right ventricular dysplasia/ cardiomyopathy
Quantification of right ventricular function, chamber size, and regional wall-motion abnormalities.
Detection of fatty or fibrosis infiltration/replacement.
Coronary artery disease
Evaluation of coronary anomalies.
Possible assessment of coronary artery stenosis in expert centers.
Valvular heart disease
Quantification of valvular and paravalvular regurgitation and stenosis when echocardiography images are limited.
Cardiac mass
Tissue characterization of cardiac mass and anatomical evaluation of mass in relation to surrounding cardiac structures for surgical planning.
Pericardial disease
Evaluation of pericardial pathology and underlying constrictive physiology.
Congenital heart disease
Initial diagnosis and follow-up after repair.
Ventricular function assessment and shunt quantification.
Evaluation of extracardiac conduits.
Surgical or percutaneous interventional planning.
Aortic disease
Comprehensive evaluation of the entire thoracoabdominal region. May be performed with or without gadolinium contrast agents.
Other vascular diseases
Comprehensive evaluation of peripheral vascular disease or mesenteric and renal arterial disease. May be performed with or without gadolinium contrast agents.
Miscellaneous
Pulmonary venous mapping for atrial fibrillation ablation.
Quantification of myocardial iron content. T2* imaging should be used.
Cardiomyopathies
Cardiomyopathies are defined as diseases of the myocardium associated with cardiac dysfunction. This family of diseases can be subdivided into ischemic cardiomyopathy (due to CAD) and nonischemic cardiomyopathy (not due to CAD). Cardiomyopathies were originally classified by the World Health Organization in 1980; this classification system was then updated in 1996 [22]. A newer classification scheme has also been recently introduced by the European Society of Cardiology [23]. When CAD, hypertension, congenital heart disease, and significant underlying valvular disease are not the cause of ventricular dysfunction, the remaining subtypes include hypertrophic cardiomyopathy (HCM), dilated cardiomyopathy, ARVD/C, restrictive cardiomyopathy, and unclassified cardiomyopathy.
Ischemic Cardiomyopathy (Coronary Artery Disease)
Coronary artery disease is the leading cause of death worldwide [24]. Coronary angiography is traditionally regarded as the gold standard for the evaluation of significant CAD. Nevertheless, coronary angiography is an invasive procedure that involves radiation and can have uncommon, but potentially serious, complications [25]. Computed tomographic angiography (CTA) is also being increasingly used in the evaluation of CAD. Although highly sensitive and specific, CTA still requires iodinated contrast agents and radiation exposure. Therefore, careful patient selection and preparation is needed to ensure that CTA yields high-quality diagnostic data while minimizing radiation exposure [2]. Other established methods for the assessment of CAD include stress echocardiography [26] and single-photon emission CT (SPECT) [27].
In a single session, CMRI can accurately evaluate LV systolic function, myocardial perfusion, and myocardial viability, therefore offering a “1-stop shop” for the comprehensive evaluation of underlying CAD. In addition, CMRI can also provide prognostic information, and a negative CMRI result predicts low short- to medium-term event rates [28–30].
Myocardial Perfusion
Since the early 1990s, investigators have used CMRI for the evaluation of myocardial perfusion [31]. Positron emission tomography (PET) and SPECT are currently considered the standards for myocardial perfusion imaging in the evaluation of patients with suspected CAD, as both of these methods have a high sensitivity (89 and 88 %, respectively) and specificity (86 and 74 %, respectively) for detecting such disease [32]. However, nuclear examinations have certain limitations, including attenuation artifacts in SPECT, the use of ionizing radiation, and relatively limited resolution. In a vasodilator CMRI perfusion study, the in-plane resolution is at least 3 × 3 mm, allowing visualization of perfusion defects in both the endocardium and epicardium. In a canine model, Lee and colleagues [33] detected a linear relationship between the relative regional flows derived from CMRI and those derived from microspheres; the correlation between both 99mTc-sestamibi and 201Tl relative regional flows and microsphere relative regional flows plateaued with increasing flow. Most CMRI centers now assess myocardial viability by performing DE-MRI after the stress-rest myocardial perfusion study. This enables the clinician to distinguish perfusion defects that occur during stress and rest, suggesting critical ischemia (where the same area is viable), versus the fixed-perfusion defects during stress and rest that represent myocardial scarring (coincide with the presence of DE-MRI) [34].
According to the “ischemic cascade” theory, when a significant coronary artery stenosis is present, a perfusion abnormality will occur before diastolic dysfunction and regional wall-motion abnormalities arise; these developments are followed by electrographic ST-segment changes and, finally, the onset of chest pain [35]. Vasodilators such as adenosine and regadenoson act on the A2A receptor. They increase myocardial blood flow (MBF) in normal coronary arteries by causing smooth muscle relaxation and vascular dilation; however, coronary arteries that have a significant stenosis show little or no increase in blood flow on exposure to these vasodilators. The resulting flow heterogeneity produces a steal phenomenon [36], which manifests as a reversible perfusion defect that occurs during stress perfusion and resolves during rest perfusion if critical coronary stenosis is not present.
When thallium or sestamibi is used in SPECT, signal intensity in the myocardium depends on both myocardial tissue perfusion and cell viability, as cells must be viable to extract the agent into the intracellular space. Therefore, in necrotic myocardium, the signal intensity will remain low regardless of whether or not blood flow has been restored to the region. Most of the Gd-chelates used in the United States are extracellular agents [37]; therefore, they rapidly diffuse from the intravascular space to the interstitial space. When these standard extracellular contrast agents are used, about half of the compound leaks out into the interstitial space during the first pass. Consequently, the myocardial signal intensity depends on the tissue blood volume, perfusion, the extravascular compartment, and the degree of capillary permeability. Despite these limitations, MRI measurements of myocardial perfusion correlate well with microsphere measurements, which are currently the gold standard in perfusion assessment [38].
Figure 13.1 shows the perfusion protocol used at the St. Luke’s Hospital/Texas Heart Institute. During peak stress (approximately 1 min after administration of a 400-mcg intravenous bolus of regadenoson or 3 min after administration of a 140 mcg/kg/min intravenous infusion of adenosine) [36], Gd is injected through a peripheral vein at a rate of 4–6 mL/s; the dosage commonly ranges from 0.05 to 0.1 mmol/kg [39–41]. The dose of Gd should be kept low to maintain a linear relationship between image intensity and contrast concentration [42]. Furthermore, if the Gd dose is too high, T2* effects could predominate, interfering with perfusion analysis. Figure 13.2 shows a CMRI perfusion study in which adenosine was used as the vasodilator, along with the corresponding angiographic image.
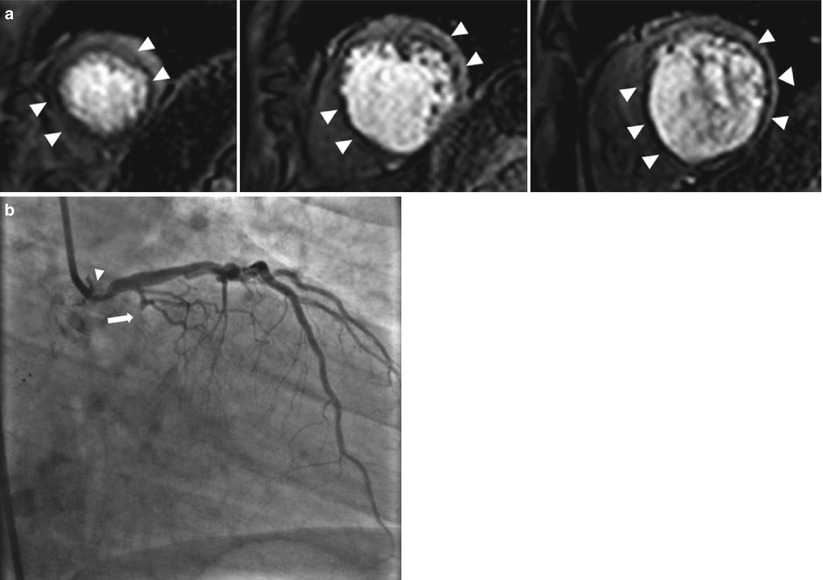
Fig. 13.1
Vasodilator myocardial perfusion protocol used at the Texas Heart Institute. This scheme illustrates the steps used to perform a myocardial perfusion study using regadenoson as the vasodilator. The study acquires functional, perfusion, and delayed-enhancement data in a single session and usually takes about 50 min to complete. BH breath-hold, EPI echo-planar imaging, Gd–chelate gadolinium-chelate, LVFx left ventricular function, Q–flow flow quantification, SSFP steady-state free precession
Fig. 13.2
Vasodilator stress perfusion cardiac magnetic resonance image and the corresponding invasive angiogram. Images are from a 68-year-old man who presented with chest pain. (a) Stress perfusion study using adenosine revealed reversible hypoperfusion involving the left anterior descending (arrowheads) and left circumflex territories (arrowheads) (rest perfusion not shown). From left to right: the apical-, mid- and basal-third of the left ventricle. (b) Invasive angiography revealed a significant left main lesion (arrow) and an occluded left circumflex artery (arrowhead)
Because Gd is a T1-shortening agent, the T1-weighted gradient-recalled echo (GRE) sequence is the one most commonly used in clinical practice and described in the literature. With this technique, an inversion recovery or a saturation recovery pre-pulse is applied first to provide T1 weighting. Other sequences, including the hybrid GRE-echo planar imaging and balanced SSFP sequences, have also been investigated. Although the latter 2 sequences have fast imaging speeds and high signal-to-noise and contrast-to-noise ratios [43–45], they are more prone to motion artifacts than is the GRE sequence. In the short-axis orientation, at least three slices covering the basal, mid, and apical thirds of the left ventricle are acquired during stress and rest perfusion. Despite the fact that the 3 LV slices are acquired in different cardiac phases, there appear to be no variations in coronary and MBF over the cardiac cycle. More slices can be covered if a faster imaging sequence is used or if 2 R-R intervals are used instead of 1 R-R interval.
Typically, the in-plane spatial resolution with a 1.5 T MRI scanner is approximately 2–3 × 2–3 mm, allowing detection of subendocardial hypoperfusion. Recently, though, the 3 T MRI scanner has been gaining popularity, primarily because it has a higher signal-to-noise ratio than the 1.5 T device. In addition, use of the 3 T MRI scanner in conjunction with new acceleration techniques, such as the broad-use linear acquisition speed-up technique (k-t BLAST) and sensitivity encoding (k-t SENSE), can reduce imaging time, improve LV coverage, and/or further improve spatial resolution [46–48].
Evaluation of CMRI perfusion data is commonly performed qualitatively. A perfusion abnormality is characterized by a black or dark gray area of myocardium at the peak bolus; the signal reduction should also persist longer than the first pass of Gd through the LV cavity [41]. In a recent meta-analysis of the diagnostic performance of vasodilator perfusion MR in detecting CAD, this method was determined to have a sensitivity of 89 % (95 % confidence interval [CI], 88–91 %) and a specificity of 80 % (95 % CI, 78–83 %) [49]. The reference standard was a ≥50 % diameter stenosis on coronary angiography, and all data were analyzed at the patient level. Limitations of this meta-analysis included the use of coronary angiography as the standard—so that the functional significance of the stenosis was not evaluated—and the variability in the Gd dose used in different studies.
The Magnetic Resonance Imaging for Myocardial Perfusion Assessment in Coronary artery disease Trial (MR-IMPACT), published in 2008, was a multicenter, multivendor trial that compared the diagnostic performance of perfusion CMRI with that of SPECT and coronary angiography (≥50 % stenosis) [40]. The study cohort comprised 234 patients, divided into five groups; each group received a different Gd dose. In the group that received the optimal Gd dose, 0.1 mmol/kg, the diagnostic performance of perfusion CMRI was similar to that of SPECT, as evaluated by receiver-operating characteristic (ROC) analysis. However, when the entire SPECT study population was considered, the diagnostic performance of perfusion CMRI at the 0.1 mmol/kg Gd dose was better than that of SPECT for the evaluation of 1- to 3-vessel disease. No difference in diagnostic performance was noted, though, if the comparison was made between perfusion CMRI and electrocardiography (ECG)-gated SPECT only. The MR-IMPACT II study, a similar but larger study with 515 patients, compared both the sensitivity and the specificity of perfusion CMRI versus SPECT in CAD detection [41]. Perfusion CMRI had a higher sensitivity than SPECT (0.67 vs 0.59, respectively) but a lower specificity (0.61 vs 0.72, respectively). The results of these two studies suggest that perfusion CMRI is a safe alternative to SPECT.
In a recently reported study, more than 600 patients with suspected angina underwent both vasodilator perfusion CMRI and ECG-gated SPECT, followed by invasive angiography [50]. The sensitivity, specificity, positive predictive value, and negative predictive values were 86.5, 83.4, 77.2 and 90.5 %, respectively, for CMRI and 66.5, 82.6, 71.4, and 79.1 % for ECG-gated SPECT. The sensitivity and negative predictive values were significantly better for CMRI than for SPECT (P < 0.0001). As Fig. 13.3 shows, CMRI also performed better than SPECT in various other categories, as indicated by ROC analysis.
Fig. 13.3
Receiver operating characteristic (ROC) curves for cardiovascular magnetic resonance (CMR) and single-photon emission computed tomography (SPECT) by population and coronary heart disease definition. ROC curves shown for (a) all patients, using an angiographic cutoff of ≥50 % for the left main stem (LMS) and ≥70 % for the left anterior descending (LAD), left circumflex (LCx), and right coronary arteries (RCA); (b) all patients, using an angiographic cutoff of ≥50 % for the LMS, LAD, LCx, and RCA; (c) patients with single-vessel disease, using an angiographic cutoff of ≥50 % for the LMS and ≥70 % for the LAD, LCx, and RCA; and (d) patients with multivessel (2- or 3-vessel) disease, using an angiographic cutoff of ≥50 % for the LMS and ≥70 % for the LAD, LCx, and RCA (From Greenwood et al. [50]. Reprinted with permission from Elsevier Limited)
The use of semi-quantitative analysis, rather than qualitative analysis, could make the assessment of perfusion abnormalities a more objective process [8, 51]. Indices that could be measured for this purpose include the peak signal intensity, up-slope, time to peak signal, mean transit time, and area under the curve. Of these, the up-slope is the most commonly used parameter. Furthermore, the stress and rest up-slope values can be normalized with the blood pool during stress and rest (Fig. 13.4). In animal studies, these semi-quantitative indices have correlated well with flow measured by microspheres [52].
Fig. 13.4
Semiquantitative cardiac magnetic resonance imaging (MRI) myocardial perfusion analysis. The indices used for semiquantitative analysis of cardiac MRI myocardial perfusion data include time to peak (A), maximum signal intensity (B), and up-slope (a) (calculated as B/A). The myocardial perfusion reserve index is obtained by dividing the up-slope during stress by the up-slope at rest, using values normalized by the left ventricular (LV) blood pool up-slope
Furthermore, MBF can be quantified in mL/min/g in perfusion CMRI. For background information regarding the absolute quantification of MBF, readers are referred to several excellent previously published review articles [8, 11, 43, 53]. Models have been developed that use the myocardial and LV blood pool time-intensity curve to estimate absolute MBF. One method for MBF quantification is the Fermi function deconvolution (Fig. 13.5), in which the maximum amplitude of the transfer function reflects the absolute MBF. Therefore, perfusion can be calculated by “deconvoluting” the arterial input function from the transfer function. The arterial input function may be obtained by using the dual-bolus technique [54]. In a recent study in which a 3 T scanner was used to assess healthy volunteers during CMRI, the MBFs at rest and during stress on CMRI were 1.0 ± 0.8 and 3.0 ± 1.6 mL/min/g, respectively; these values correlated well with those obtained by 13N-ammonia PET, which were 0.8 ± 0.2 for the MBF at rest and 3.0 ± 1.1 mL/min/g during stress [55].
Fig. 13.5
Calculation of absolute myocardial blood flow by using Fermi function deconvolution. Briefly, f * g = h, where (f) represents the arterial input function (middle figure), represents convolution, (g) represents the transfer function (right figure), and (h) represents the output signal measured from myocardial enhancement (left figure). The maximum amplitude of the transfer function reflects the absolute myocardial blood flow. In this example, the arterial input function was obtained by using the dual-bolus technique. A.U. arbitrary units (From Lee and Johnson [302]. Reprinted with permission from Elsevier Limited)
Myocardial Viability
Left ventricular function is among the most important prognosticators in patients with CAD. Therefore, assessment of myocardial viability before revascularization is a conceptually sound and logical approach for evaluating myocardial dysfunction, because ventricular function should improve after revascularization in patients with viable myocardium [56, 57]. In the setting of ischemic cardiomyopathy with significant CAD and LV systolic dysfunction, data suggest that revascularization for patients with myocardial viability confers a survival benefit [58–60]. In a meta-analysis of >3,000 patients, 201thallium SPECT, dobutamine echocardiography, and F-18 fluorodeoxyglucose PET were used to assess myocardial viability; patients with viable myocardium who underwent revascularization had a significant survival advantage when compared to similar patients who underwent medical therapy (annual mortality rate, 3.2 and 16 %, respectively; P < 0.0001), but in patients with no evidence of myocardial viability, no difference in mortality was observed in those who underwent revascularization versus medical therapy (although there was a trend toward increased mortality in the revascularization group) [58]. A more recent meta-analysis of myocardial viability assessment, as determined by dobutamine stress echocardiography, SPECT, and PET, also showed that revascularization in patients with viable myocardium consistently provided a survival advantage when compared to medical therapy alone [61]. In addition, successful revascularization has been shown to improve global and regional systolic function [62] and LV remodeling [62], and it has also been shown to reduce the occurrence of adverse outcomes such as myocardial infarction (MI), heart failure, and unstable angina [63].
A variety of CMRI methods can be used to assess myocardial viability. The DE-MRI technique is relatively easy to perform, is reproducible, and provides high spatial resolution. Myocardial viability can also be evaluated by using CMRI spectroscopy, an ion transport agent (e.g., manganese), necrosis-specific agents (e.g., gadophorins), or a low dose of dobutamine, which determines contractile reserve.
In healthy myocardium, cell membranes are intact, so extracellular Gd agents cannot enter the intracellular space, which forms approximately 80–85 % of the imaging voxel. In irreversible myocardial injury, myocardial cell membranes become disrupted, allowing Gd to enter the intracellular space. As a result, the Gd concentration and the volume of distribution increase (Fig. 13.6) [64]. When the DE-MRI sequence is performed, a certain amount of time is allowed to pass after the R wave of the electrocardiogram before an 180° inversion pulse is applied. T1 relaxation will then occur. The MRI operator will input the inversion time (i.e., the time required for normal myocardium to reach the “null” point), after which data acquisition is begun. Areas with irreversible injury (i.e., myocardial scar) will appear bright with high signal intensity; this is referred to as hyperenhancement. In contrast, normal, viable myocardium will have low signal intensity and will appear dark [64, 65]. The typical in-plane resolution of DE-MRI is 1.5–2 × 1.5–2 × 6–8 mm on a 1.5 T MRI scanner; this resolution is easily 20× higher than that of SPECT. When used to determine infarct size in an animal model, DE-MRI showed excellent agreement with tetrazolium chloride staining, the gold standard [66] (Fig. 13.7). In a seminal study by Kim and colleagues [67], DE-MRI was able to identify dysfunctional but viable myocardium and predict functional recovery after coronary revascularization. In that study, approximately 80 % of the dysfunctional segments with fully viable myocardium showed improvement in functionality after revascularization, whereas only 10 % of the segments with 51–75 % hyperenhancement/scar showed functional recovery (Fig. 13.8). The above-mentioned findings have been confirmed by other studies [68, 69].
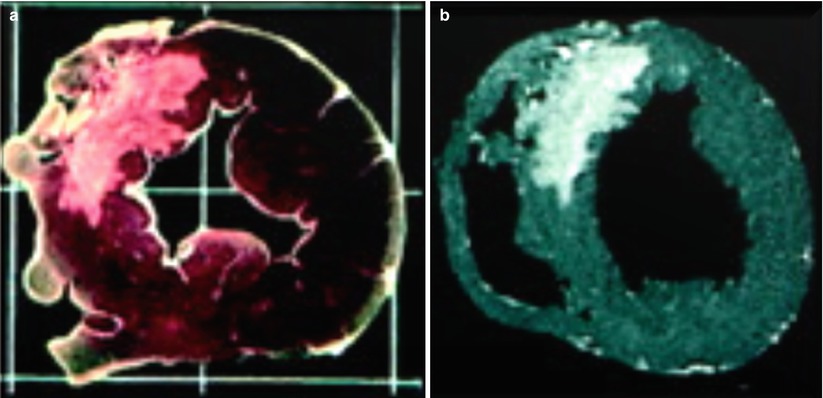
Fig. 13.6
Mechanism of delayed-enhancement magnetic resonance imaging. Gadolinium-chelates are extracellular agents; they do not cross intact cell membranes. Thus, the volume of distribution in normal myocardium is small (left panel). During acute myocardial infarction with cell membrane rupture, gadolinium molecules are able to diffuse into what was previously intracellular space (middle panel). Consequently, the volume of distribution increases, and when an appropriate imaging sequence is used, hyperenhancement is seen. In chronic myocardial infarction (right panel), the collagen matrix increases, resulting in an increase in the gadolinium concentration. Gd gadolinium, Na sodium, K potassium (From Mahrholdt et al. [64]. Reprinted with permission from Oxford University Press)
Fig. 13.7
Comparison of tetrazolium chloride (TTC) staining and ex vivo delayed-enhancement magnetic resonance imaging (DE-MRI) for determining myocardial infarct size. Images obtained by TTC staining (left figure) and ex vivo DE-MRI (right figure; acquired with a spatial resolution of 0.5 × 0.5 × 0.5 mm) show that these methods correlate extremely well when used to assess the size of a myocardial infarct. The infarct is located in the anteroseptum (From Kim et al. [66]. Modified with permission from Wolters Kluwer Health)
Fig. 13.8
Relationship between the degree of delayed enhancement (DE) and myocardial functional improvement after revascularization. In segments with no DE, the probability of functional recovery is high, even when akinesia or dyskinesia is present. However, in segments with substantial scarring (≥51 %), the chance of functional recovery progressively decreases (From Kim et al. [67]. Reproduced with permission from Massachusetts Medical Society)
Typically, 0.1–0.2 mmol/kg of Gd is administered as a contrast agent for DE-MRI. Data are usually acquired after 10–15 min of Gd administration, allowing adequate wash-in and wash-out of the contrast agent from the extracellular space of the myocardium. The input of the inversion time is critical to achieve adequate “nulling” of the myocardium. The correct inversion time can be found by using the inversion-time scout sequence, available from all major MRI vendors. Because of the introduction of the phase-sensitive inversion sequence for DE-MRI, choosing the exact nulling time has become less important [70]. The grading of DE-MRI is usually qualitative and is determined by the transmural extent of DE: 0 = fully viable, thin subendocardial = 1 to 25 %, dense subendocardial = 26 to 50 %, near-transmural = 51 to 75 %, and transmural = 76 to 100 % [67].
Regarding the study by Kim and colleagues [67], it is important to note that even in dysfunctional myocardium with no scarring, contractility improved in only approximately 78 % of segments. Some of the limitations of viability assessment have been elegantly summarized in a recent article by Schinkel and colleagues [61]. The usefulness of viability assessment may be limited for the following reasons: (1) a large amount of scar tissue adjacent to viable myocardium could limit functional recovery [71]; (2) in a severely dilated heart that has undergone significant remodeling, improvement may not be possible, despite the presence of viable myocardium [72]; (3) hibernating myocardium, in which metabolism has been significantly downregulated, may no longer respond to revascularization; (4) revascularization may have been incomplete or may have failed, or new myocardial injury may have occurred during revascularization; and (5) imaging must be performed at the correct time, because it could be as long as 1 year before functional recovery is seen [73].
Follow-up CMRI studies performed after revascularization consistently show only moderate functional recovery of segments that had 25–76 % DE [67, 69, 74]. In these segments, LD dobutamine CMRI is better able to predict functional recovery [74, 75]. In a recent study by Glaveckaite and colleagues [74], LD dobutamine performed better than DE-MRI at predicting functional recovery in segments with 26–75 % DE (P = 0.043), as shown by ROC analysis. However, the combination of DE-MRI and LD dobutamine was not found to provide more information than LD dobutamine alone. In general, DE-MRI offered similar, if not better, sensitivity than LD dobutamine MRI did in predicting functional recovery; however, LD dobutamine MRI offered better specificity than DE-MRI did. Finally, the investigators also found that the predictive value of DE-MRI did not increase when the thickness of the viable myocardium in each segment was also considered [74].
During an acute MI, the “no-reflow” phenomenon may be visualized with coronary angiography. This phenomenon results from obstructions in the microcirculatory system, which includes vessels <200 μm in diameter [76]. This microvascular obstruction (MO) can be imaged by DE-MRI after Gd administration (Fig. 13.9) and can be detected during an acute MI, especially an ST-segment–elevation MI (STEMI), with or without percutaneous intervention. Such obstruction is especially common when the patient is elderly, the thrombus burden is large, the baseline coronary flow is poor, or reperfusion is delayed. When visualized with DE-MRI, MO is seen as regions of low signal intensity surrounded by hyperenhancement. Although DE-MRI is used for this purpose, there is no consensus regarding the optimal imaging sequence to use for MO or the appropriate timing of imaging after Gd administration. For example, some studies suggest that images should be acquired a few minutes after Gd administration (early) [77, 78], whereas others suggest the use of a standard imaging time of 10–15 min after Gd administration (late) [77–81]. Other imaging methods include a first-pass perfusion sequence [78, 80–82] and cine SSFP imaging [83]. In 1 study, the median mass of MO was found to be greatest on first-pass perfusion, followed by early and late DE-MRI (4.7, 2.3, and 0.2 g, respectively) [78].
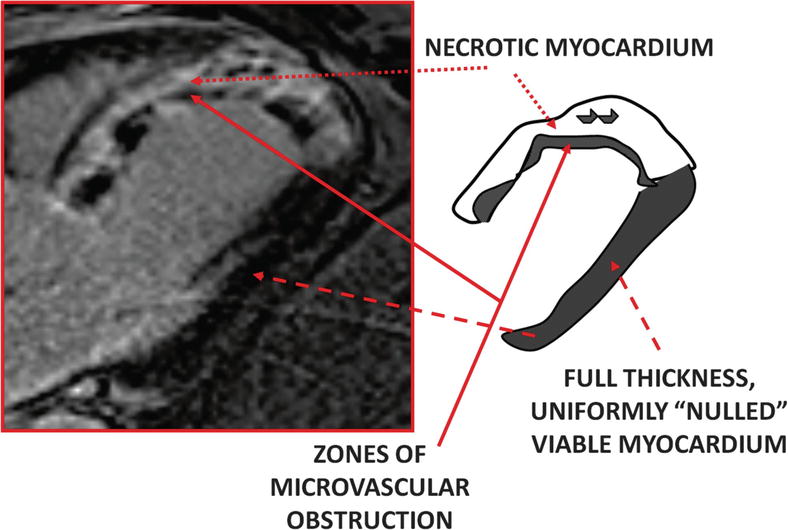
Fig. 13.9
Delayed-enhancement magnetic resonance imaging (DE-MRI) of microvascular obstruction. This image is from a patient who presented with acute myocardial infarction of the left anterior descending artery 10 h after onset. Percutaneous intervention was performed immediately; however, DE-MRI performed on the third hospital day revealed near-transmural to transmural myocardial infarction. The image, taken in the left ventricular outflow tract orientation 15 min after gadolinium-chelate administration, shows myocardial infarction in the entire anteroseptum and extending into the apex
Microvascular obstruction is common after an acute MI, even after successful reperfusion, and patients with MO have a larger infarct size than those without MO [79, 80, 82, 84]. In addition, Kaplan-Meier analysis has indicated that survival is worse in patients with MO [79, 80, 84]. The presence of late/persistent MO is a significant prognosticator for major adverse cardiovascular events [79, 80], indicating that more aggressive therapy and vigilant clinical follow-up are needed for patients who have MO.
Data from multiple studies suggest that besides playing a major role in the assessment of myocardial viability, DE indicates a worse prognosis in patients with ischemic or nonischemic cardiomyopathy. In a study of 857 patients, the presence of DE was an independent predictor of death/cardiac transplantation in the patients with and without CAD (Fig. 13.10) [28]. Similarly, in a cohort of patients with suspected CAD who underwent DE-MRI, significant survival differences were found between the patients with DE and those without DE [85]. In addition, the presence of DE had the highest hazard ratio (HR) when compared to other traditional clinical factors in predicting cardiac mortality and major adverse cardiac events; patients whose percentage of DE was in the lowest tertile had a 7-fold increase in major adverse cardiac events. In a recent multicenter observational study, more than 1,500 patients underwent routine CMRI, which included DE-MRI and LV ejection fraction (LVEF) measurements. In this study, significant predictors of all-cause mortality included older age, the presence of CAD, and a greater number of DE segments [86]. In addition, patients with preserved LV systolic function (LVEF ≥50 %) who had >4 segments with DE had significantly poorer survival than patients who had ≤4 DE segments. The authors of the above-mentioned studies have provided two possible explanations as to why DE is associated with poorer outcomes in patients with CAD: first, myocardial scarring could act as a substrate for ventricular tachyarrhythmia [87, 88], and second, the presence of DE could be a marker of significant underlying atherosclerosis [85].
Fig. 13.10
Transplant-free survival, stratified by delayed enhancement (DE) status (+/−) and ejection fraction (EF). Kaplan-Meier transplant-free survival analysis was performed for four patient groups: (1) DE absent and EF ≥50 %, (2) DE absent and EF <50 %, (3) DE present and EF ≥50 %, and (4) DE absent and EF <50 %. Traditionally, patients with a preserved ejection fraction were regarded as having a good prognosis. In this analysis, however, patients who had DE and preserved left ventricular systolic function (i.e., EF ≥50 %) had similar outcomes to those who had no DE and a left ventricular ejection fraction of <50 % (blue and yellow lines, respectively). Patients with DE and a left ventricular ejection fraction <50 % had the worst prognosis (From Cheong et al. [28]. Modified with permission from Wolters Kluwer Health)
Two recent articles described the use of DE-MRI for patient risk assessment to determine the appropriate use of implantable cardioverter-defibrillator (ICD) therapy. In the study by Klem and colleagues [89], 137 patients underwent CMRI, and 104 of these patients had an ICD placed. The investigators found a significant increase in the primary endpoint event rate (all-cause death, sudden cardiac death [SCD], or ICD discharge) when the amount of DE was >5 % of the LV mass; however, the event rate then plateaued with further increases in DE. In addition, DE of >5 % was the only significant independent predictor of SCD or ICD discharge, with an HR of 4.8 (95 % CI, 1.7–13.7; P = 0.0004). The authors then used an LVEF cut-off of 30 % to assess the effect of DE % on the event rates of SCD and ICD discharge; they obtained the following results: (1) LVEF >30 %, DE ≤5 %, 3-year event rate = 6 %; (2) LVEF >30 %, DE <5 %, 3-year event rate = 25 %; (3) LVEF ≤30 %, DE ≤5 %, 3-year event rate = 11 %; and (4) LVEF ≤30 %, DE >5 %, 3-year event rate = 35 %. These results suggest that even in patients with a low LVEF (≤30 %), the presence or absence of significant DE could affect the occurrence of these adverse outcomes. A similar trend was also seen in all-cause mortality. The second study to assess the use of DE-MRI for risk stratification followed up 257 patients after ICD implantation; both the percentage of DE (HR, 1.8; 95 % CI, 1.1–2.8; P = 0.02) and the number of transmural segments (HR, 1.4; 95 % CI, 1.2–1.7; P = 0.001) were independent predictors of the need for ICD therapy in this study [90].
Area-at-risk Assessment
Area-at-risk (AAR) is defined as the region of myocardium that becomes ischemic during an acute coronary occlusion [91]. The T2-weighted imaging used in CMRI is sensitive to water-bound protons, and it has been postulated that this method can be used to detect myocardial edema, regardless of whether the edema is caused by inflammation or coronary occlusion [92]. From data collected by T2-weighted imaging and DE-MRI, the following parameters can be computed: (A) AAR = myocardial edema volume / volume LV mass; (B) percentage of infarct size = volume infarct / volume LV mass; (C) myocardial salvage = (A) – (B); and (D) myocardial salvage index = (C) / (A) (Fig. 13.11) [93]. In a study by Ugander and colleagues [94], measurements of the AAR myocardium after coronary occlusion taken by T2 mapping were in good agreement with those taken by the reference standard of microsphere blood flow assessment (R2 = 0.96) in a canine model. In several publications, T2-weighted imaging has been used to assess myocardial edema or myocardial salvage during acute coronary syndrome [93, 95–98].
Fig. 13.11
Diagram depicting how the area-at-risk is measured. (a) Representation of a T2-weighted image of myocardial edema (black arrowhead) in the interventricular septum, indicating area-at-risk. (b) The corresponding delayed-enhancement (DE) magnetic resonance imaging results, showing the presence of a subendocardial scar (black arrows). Note that the area of DE is less than the area of myocardial edema. (c) The salvaged myocardium (b–c) is indicated by the grey area (white arrowheads)
To define the prevalence and significance of myocardial edema in patients with non-STEMI, Raman and colleagues [97] analyzed data from 88 patients who had non-STEMI and adequate CMRI studies before coronary angiography. These data included results from triple inversion T2-weighted edema imaging and DE-MRI. The treating physicians were blinded to the CMRI results. All CMRI data were analyzed in a semi-quantitative fashion. Revascularization was required for significantly more patients with myocardial edema than for patients without edema (88 % vs 26 %, respectively; P <0.0001). When compared to patients without myocardial edema, those with myocardial edema had a higher risk of having a cardiovascular event or dying within 6 months after the index event (HR, 4.5; 95 % CI, 1.0–20.0; P = 0.05).
Eitel and colleagues [93] analyzed the CMRI results of more than 200 patients with STEMI to determine the prognostic significance of the myocardial salvage index in reperfused STEMI. For each patient, CMRI was performed within 4 days of the index event. The analyzed parameters included myocardial edema, infarct size, myocardial salvage index, and standard LV functional parameters. Higher myocardial salvage index values correlated with shorter symptom-to-percutaneous intervention times (i.e., symptom-to-balloon time). In multivariable regression analysis, only the myocardial salvage index was an independent and significant predictor of the study endpoint, which was death, reinfarction, or new congestive cardiac failure within 6 months of the index event (HR, 0.93; 95 % CI, 0.91–0.96; P <0.001). This means that major adverse cardiovascular events are less likely to occur in patients with a higher myocardial salvage index value than in patients with a lower value. In a second publication, Eitel and colleagues [99] provided the results of a follow-up study of the above-mentioned patients (median follow-up period, 18 months). The investigators found that the incidence of major adverse cardiovascular events or death was significantly lower in patients with a median myocardial salvage index of ≥48.3, which indicates a larger degree of myocardial salvage (P <0.0001 for both comparisons). In this study, the percentage of DE was the most significant predictor of major adverse cardiac events—specifically, a composite of death, reinfarction, and new congestive heart failure (HR, 1.06; 95 CI%, 1.03–1.09; P <0.001). Although the myocardial salvage index was not found to be a significant predictor of major adverse cardiac events, it was a significant independent predictor of death (HR, 0.93; 95 CI%, 0.91–0.96, P <0.001). In contrast, traditional prognosticators, such as age, diabetes, and percentage of DE, were not significant predictors of death. In addition, infarct size and myocardial salvage were noted to have a strong inverse correlation (r = −0.86; P <0.001).
In a study of 137 patients with acutely reperfused STEMI, the myocardial salvage index was determined to be the most significant predictor of both early ST-segment resolution (B coefficient = 0.61; P <0.0001) and adverse remodeling, defined as a ≥15 % increase in LV systolic volume on the 4-month follow-up CMRI (odds ratio, 0.64; 95 % CI, 0.49–0.84; P = 0.001) [100].
Larose and colleagues [98] studied 101 patients with acute STEMI who underwent CMRI 12 h after primary percutaneous intervention and 6 months after the index event. The patients were followed up for 2 years. Data from CMRI were used to quantitatively examine LV function and assess DE-MRI of the entire left ventricle; first-pass perfusion and T2-weighted images were obtained in the apical, mid, and basal left ventricle. The myocardial salvage index was also computed. All of the above-mentioned variables were significant predictors of LV systolic dysfunction at 6 months on univariate analysis, but the percentage of DE measured during the acute STEMI was the best independent predictor in multivariable analysis (odds ratio, 1.33; 95 % CI, 1.09–1.78; P = 0.002).
The use of DE-MRI for prognostication has been well established in multiple publications [28, 85, 86]. In the assessment of novel myocardial perfusion strategies, the myocardial salvage index could prove to be a better prognosticator than the percentage of DE because the final infarct size depends on various factors, including the collateral blood flow, duration of ischemia, and extent of AAR. There is a close association between DE size and AAR; the myocardial salvage index corrects the infarct size to the amount of AAR [100]. The myocardial salvage index could be useful in assessing the safety and efficacy of new reperfusion strategies.
The technical limitations of T2-weighted imaging are well summarized by Wince and colleagues [101]. One such limitation is that the contrast-to-noise ratio is low between edematous and normal myocardium in conventional T2-weighted imaging. Also, wall-motion abnormalities associated with acute myocardial injury can lead to “slow blood flow,” creating a high signal that can be mistaken for edema. In addition, incomplete dark-blood preparation due to reduced cardiac motion and misregistration between the preparation and imaging phase in hypokinetic myocardium can result in a higher signal intensity than that in normal myocardium. Finally, in most studies, the area of edema is arbitrarily defined as a region with a signal intensity that is >2 standard deviations above that of a remote region. Improved imaging sequences [102, 103] and quantitative T2 measurements [104] may overcome some of these limitations.
Nonischemic Cardiomyopathy
Cardiovascular MRI has emerged as the gold standard for the assessment of nonischemic cardiomyopathy [1–3]. Surface 2-dimensional (2D) echocardiography remains the first-line, noninvasive imaging modality used for patients who present with cardiomyopathy. However, 2D echocardiography has a few potential limitations. First, patient body habitus could affect image quality, especially in patients who are obese or who have chronic obstructive pulmonary disease. Second, the apex may not be readily visible (i.e., in patients with apical ballooning). Third, 2D echocardiography has limitations regarding the accurate assessment of the right ventricle, which is of great importance when one is assessing diseases such as ARVD/C. Fourth, 2D echocardiography relies on geometric assumptions for chamber and mass quantification. Fifth, 2D echocardiography has a limited ability to characterize certain tissues, including fat, fibrosis, and scar.
The following sections provide a brief summary of the role CMRI plays in the diagnosis of various cardiomyopathies commonly encountered in day-to-day clinical practice.
Imaging Techniques
Cine Imaging
Steady-state free-precession cine imaging is the most widely used imaging sequence for functional assessment by means of CMRI, especially for the right ventricle. Parallel imaging can also be used in conjunction with SSFP imaging to reduce the imaging time and enhance patient comfort, to improve the spatial resolution, or both; these benefits come at the expense of a slightly reduced signal-to-noise ratio.
Spin Echo
Tissue characterization is commonly performed with the turbo/fast spin echo sequence, using T1- or T2-weighting. A double inversion recovery preparation scheme is commonly used to suppress the blood signal. Briefly, an initial nonselective 180° pulse is applied to the entire imaging volume. Then, a second 180° pulse is applied to the slice of interest immediately after the first 180° pulse to restore the longitudinal magnetization; note that magnetization outside the slice of interest will remain inverted. The acquisition sequence is started after an inversion time that corresponds to the time when blood from outside the imaging slice crosses zero during recovery after the 180° inversion pulse; therefore, the blood will generate no signal. With the application of another inversion pulse to suppress the fat signal, a triple inversion recovery preparation scheme will have been achieved.
For the detection of myocardial edema, the T2-weighted spin echo sequence is especially useful when long T2 water-bound protons are used as the contrast-generating mechanism, resulting in high signal intensity in edematous tissue [92]. To evaluate fatty infiltration or replacement, as would be needed for the assessment of ARVD/C, a fat saturation sequence is employed. Examples of these sequences include short inversion-time inversion recovery (STIR), spectral presaturation with inversion recovery (SPIR), spectral attenuated inversion recovery (SPAIR), and the principle of selective excitation technique (ProSet).
Spin echo images have certain limitations. For example, the contrast-to-noise ratio between normal and abnormal myocardium is low; the image quality is affected by background field inhomogeneity; and in areas of reduced myocardial contraction, slow blood flow could result in a bright signal that could be mistaken for myocardial edema. The presence of a significant arrhythmia can also affect image quality. In addition, through-plane motion can cause a loss of the posterior/inferior wall signal, and the use of phase array coils can cause signal intensity variability.
Dixon Technique
Another method of imaging fat (and water) is the Dixon technique [105]. This chemical-shift–based water-fat separation technique was originally described by Dixon in 1984 [106]. Protons in water and fat have different resonance frequencies, and phase shifts occur because of these frequency differences. As a result, fat and water can be separated by using the improved multi-echo Dixon technique, which is less susceptible to background magnetic field inhomogeneity than are traditional fat-suppression techniques. This method can be incorporated into contrast-enhanced or cine imaging to achieve a high signal-to-noise ratio with a shorter imaging time, especially when parallel imaging is used [107]. Some clinical applications of the multi-echo Dixon technique include detecting fatty infiltrates in MI, imaging cardiac tumors (such as lipomas), and evaluating ARVD/C (Fig. 13.12) [105].
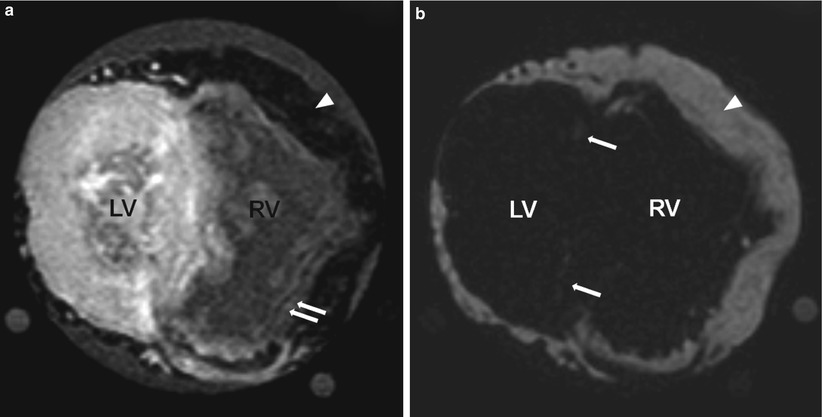
Fig. 13.12
An explanted heart imaged by using cardiac magnetic resonance imaging (MRI) with the Dixon method. The heart was from a 23-year-old man who had cardiomyopathy and a histologic diagnosis of arrhythmogenic right ventricular dysplasia. The explanted heart was imaged by using a T1-weighted sequence with the Dixon method; (a) is the water image and (b) is the fat image. The signal intensity for fat is low in the water image and high in the fat image. Arrowheads in both images indicate epicardial fat. Double arrows in (a) indicate the presence of fat in the right ventricle (RV). Single arrows in (b) indicate fat in the left ventricle (LV). The image spatial resolution is 1 × 1 × 2 mm
Delayed-enhancement MRI
The DE-MRI sequence is commonly performed approximately 10–15 min after Gd enhancement. Different types of nonischemic cardiomyopathy can produce different enhancement patterns, such as mid-myocardial, subepicardial, and transmural (Fig. 13.13). A DE pattern alone may not be specific enough to diagnose a disease, but when considered in conjunction with the patient’s clinical presentation, symptoms, and extravascular findings (e.g., hilar adenopathy in sarcoidosis), DE-MRI findings can help physicians arrive at the correct clinical diagnosis.
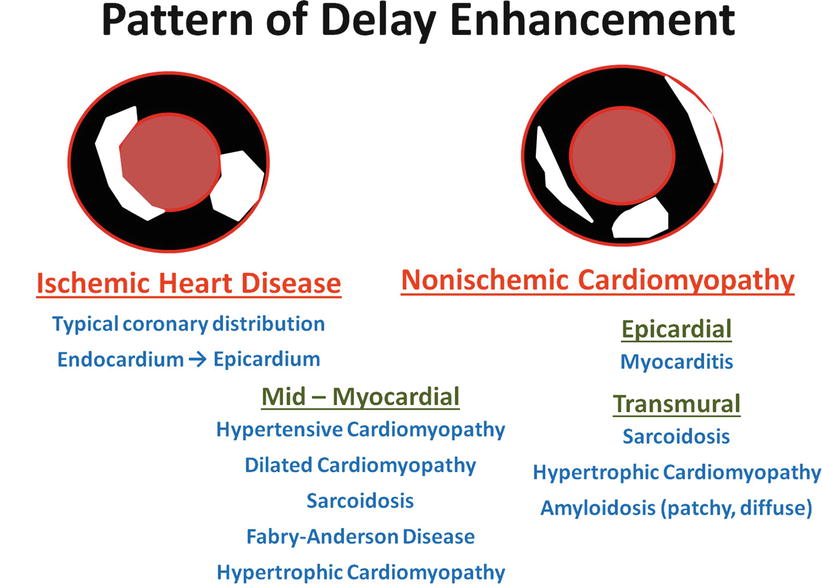
Fig. 13.13
Differential patterns of delayed enhancement (DE) in ischemic and nonischemic cardiomyopathies. In patients with coronary artery disease, DE is usually present in the endocardium of the involved coronary territories and, depending on the degree of myocardial injury, may extend toward the epicardium. In patients with nonischemic cardiomyopathy, the pattern of DE is less specific; it may be subendocardial, mid-myocardial, or subepicardial, and overlap is often seen in different disease processes. Nonetheless, when this information is combined with the appropriate clinical information and with morphologic and extravascular findings (such as asymmetric hypertrophy and hilar adenopathy), clinicians are frequently able to arrive at the correct diagnosis. When images are acquired by using DE-MRI, normal myocardium is dark and DE is bright
T1 Imaging
In certain pathological conditions, such as CAD, infiltrative diseases (e.g., amyloidosis), and cardiac hypertrophy (e.g., systemic hypertension, HCM), fibroblasts proliferate and extracellular collagen deposition and fibrosis increase with structural and biomedical remodeling [108]. In a rat model, myocardial fibrosis has been associated with ventricular remodeling, increased myocardial stiffness, and a reduction in systolic function [109]. Fibrosis can be arrhythmogenic because it can lead to electrical conduction disturbances. In humans, the interstitial/extracellular space accounts for approximately 20–25 % of the total heart volume [110]. With fibrosis, the extracellular space increases. Endomyocardial biopsy is the gold standard for evaluating myocardial fibrosis; however, it is an invasive procedure with known morbidity and mortality hazards. Furthermore, such a biopsy could result in sampling error.
In CMRI, there is T1 shortening after Gd administration. The signal change is related to the extent of the extracellular space. When irreversible injury is present, the intracellular spaces will be directly exposed to Gd. As a result, there will be an apparent increase in the extracellular space and volume of distribution, increasing the signal strength after Gd administration when an appropriate imaging sequence is used (e.g., DE-MRI). Similarly, in an infiltrative cardiomyopathy, such as amyloidosis, the expansion of extracellular space could result from fibrosis or amyloid protein accumulation [111]. T1 mapping provides a more objective assessment of the extracellular space and, therefore, of fibrosis [112]. The extracellular volume fraction (ECF) can be obtained by using the formula (ΔR1 Myocardium/ΔR1 Blood) × (1-hematocrit), where R1 is the reciprocal of T1 (T1 is the longitudinal relaxation time constant) and ΔR1 represents the difference between R1 before and after contrast [113].
T2 Imaging
Both inflammation (as occurs in myocarditis) and ischemia-reperfusion injury (as occurs in acute coronary syndrome) can lead to myocardial edema [114]. In the initial stages of edema, an Na+/K+ pump dysfunction leads to the intracellular accumulation of Na+, resulting in an influx of water due to an increase in osmotic pressure. With a prolonged insult, capillary membrane damage leads to interstitial edema due to intravascular water leakage. Interstitial edema can cause systolic and diastolic dysfunction and can promote myocardial stiffness and fibrosis [115]. Discriminating between intra- and extracellular myocardial edema by means of noninvasive imaging is difficult.
The T2-weighted imaging sequence is used clinically to detect myocardial edema, which produces a high signal intensity with this approach. Recently, some improved versions of T2-weighted imaging have been described. For example, the T2-prepared SSFP sequence has been shown to have fewer artifacts and higher accuracy than the traditional fast spin echo sequence [103], and a hybrid sequence has been described that combines the advantages of SSFP and turbo spin echo imaging [102]. In addition, quantitative T2 mapping to detect myocardial edema has been shown to increase objectivity and improve accuracy while also addressing the potential limitations of traditional spin echo imaging sequences [104].
T2* Imaging
Serum ferritin is commonly measured to determine body iron stores; however, it is not a good indicator of the myocardial iron level. Hepatic iron overloading leads to a reduction in signal intensity, and the T2 value is reduced when iron is present. Initially, the spin echo T2 sequence was used to quantify tissue iron content, but the gradient-echo T2* sequence has shown greater sensitivity to iron deposition [116]. Using the gradient-echo sequences to measure T2* has the advantage of a shorter acquisition time; therefore, it is possible to produce a motionless image by using a single breath-hold with ECG-gating. Furthermore, the gradient-echo sequence is more sensitive to the paramagnetic effect of iron because it does not require the 180° refocusing pulse used in spin echo sequences to correct for field inhomogeneities [117]. However, the quality of bright-blood gradient-echo images can be affected by noise, motion, and blood artifacts [118]. In bright-blood images, the blood signal spills into the myocardium, potentially affecting T2* quantification. To reduce blood-signal contamination of the myocardium, a double inversion recovery prepulse sequence can be applied to suppress the blood signal, giving rise to a black blood image when a gradient-echo sequence is used [119]. With this method, the myocardium will appear more homogeneous and have greater border definition than it does when the traditional bright-blood sequence is used. He and colleagues [117, 118] used this optimized black-blood preparation gradient-echo sequence so that the T2* value could be obtained by using a monoexponential model fit (SI = ke−TE/T2*; where SI = signal intensity, k = constant, and TE = echo time). In contrast, in certain cases, the bright-blood T2* value could be better estimated by using either the truncation model or the offset model [118, 119]. These measurements were usually made in a full-thickness region of interest that was placed in the mid-ventricular septal region to avoid susceptibility artifact [118].
In 12 hearts obtained from siderotic cardiomyopathy patients after death or cardiac transplantation for end-stage heart failure, midventricular septal iron concentrations and CMRI measurements of R2* (calculated as 1/T2*) were both highly representative of mean global myocardial iron [120]. The same study also confirmed that iron deposition is higher in the epicardium than in the endocardium; therefore, for T2* measurements, a large, full-thickness section of the mid-septum should be chosen as the region of interest.
Nonischemic Cardiomyopathies
Myocarditis
Myocarditis is defined as inflammation of the myocardium. The presentation of myocarditis can vary from nonspecific symptoms to acute hemodynamic instability and death [121]. It has been reported that in some patients myocarditis can progress to dilated cardiomyopathy [122] or ARVD/C [123]. Myocarditis can be caused by an infection (viral, bacterial, or fungal) or can occur secondary to hypersensitivity or immunological conditions.
In patients with suspected myocarditis, CMRI can be used to evaluate global and regional function; wall thickness and mass; pericardial effusion; myocardial edema, which can be detected by characterizing the tissue in T2-weighted images; increases in volume of distribution caused by hyperemia and capillary leak, which can be detected by early Gd enhancement (the global relative early enhancement ratio, gRE); and myocardial necrosis and fibrosis, which can be detected by using DE. Table 13.2 outlines the proposed Lake Louise Consensus Criteria for using CMRI for diagnosing myocarditis [92].
Table 13.2
Lake Louise consensus criteria for the diagnosis of myocarditis by cardiovascular magnetic resonance imaging
The presence of two of the three following imaging criteria support the diagnosis of myocarditis in clinically suspected cases: |
1. Global or regional signal-intensity (SI) increase in T2-weighted imagesa. |
2. Increased global early enhancement ratio between myocardium and skeletal muscle in gadolinium-enhanced T1-weighted imagesb. |
3. One or more typical DE-MRI lesions that do not fit a coronary distribution. |
Consider repeating CMRI in 1–2 weeks if one of the following applies: |
1. Strong clinical suspicion of myocarditis but none of the above-mentioned criteria is present. |
2. Only 1 criterion is present. |
Supportive findings: pericardial effusion or left ventricular dysfunction. |
In a study of 25 patients with clinically diagnosed myocarditis, the sensitivity, specificity, and diagnostic accuracy were determined for three CMRI sequences: (1) the values for the T2 signal intensity ratio between myocardium and skeletal muscle were 84, 74, and 79 %, respectively; (2) the values for GRE were 80, 68, and 75 %, respectively; and (3) the values for DE-MRI were 44, 100, and 71 %, respectively. When positive results were obtained by any two of the three sequences in a single patient, the values were 76, 96, and 85 %, respectively [124]. In another study of 42 patients with myocarditis, the T2 signal intensity ratio was elevated in 57 % of the patients, the GRE was elevated in 31 % of the patients, and DE was present in 64 % of the patients. Furthermore, two of these three criteria were present in 76 % of the patients [125]. The fact that not all patients with myocarditis have DE probably reflects the inability of DE-MRI to reveal diffuse myocardial changes. In DE-MRI, myocarditic lesions typically affect the lateral free wall and the inferior wall, epicardially or mid-myocardially [124, 126], although multifocal or diffuse distribution has also been reported (Fig. 13.14) [92]. Patients with myocarditis have also been shown to have increases in myocardial ECF by T1 imaging [127].
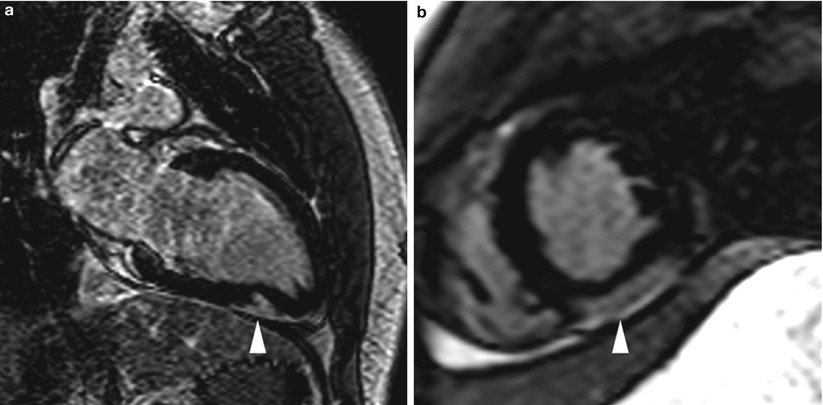
Fig. 13.14
Images from an 18-year-old man who presented with acute chest pain, ST-segment elevation on electrocardiogram, and a mild troponin level increase. Coronary angiography revealed widely patent and normal-appearing coronary arteries. Cardiac magnetic resonance imaging was subsequently performed and showed delayed enhancement (arrowhead) in the distal inferior wall (mid-myocardial and epicardial), suggesting a diagnosis of acute myocarditis. Images were acquired in (a) the two-chamber orientation and (b) the mid short-axis orientation
In a group of 87 patients with active myocarditis who underwent CMRI and endomyocardial biopsy, the most common findings were parvovirus B19 (56 % of patients), human herpesvirus 6 (18 % of patients), and a combination of both viruses (17 % of patients) [128]. Coxsackie B virus and Epstein-Barr virus were infrequently diagnosed (1 % of patients for each virus). Delayed enhancement was seen in the epicardium of the lateral wall in patients who were found to have parvovirus B19; these patients tended to have a relatively benign clinical course on follow-up evaluation. In contrast, DE was commonly found in the anteroseptal region, intramurally, in patients with human herpesvirus 6; the clinical course of these patients was more variable than that of patients with parvovirus B19. For patients affected by both viruses, DE was present in a large area of the anteroseptum, predominantly mid-myocardially. On follow-up examination, these patients were found to have symptoms of persistent congestive cardiac failure and no significant improvement in LVEF. Significant predictors of an impaired LVEF included the presence of DE in the septum, the amount of DE, the end-diastolic volume at presentation, and combined infection with parvovirus B19 and human herpesvirus 6.
Published studies of the use of CMRI for the diagnosis of myocarditis have several limitations. The study cohorts are generally small, and most of the studies involve single-center experiences. Also, different studies use different imaging sequences and diagnostic criteria. Moreover, only a limited number of reports mention histological confirmation of the diagnosis [92].
Arrhythmogenic Right Ventricular Dysplasia/Cardiomyopathy
Arrhythmogenic RV dysplasia/cardiomyopathy is a heritable form of cardiomyopathy characterized by fibrofatty replacement that primarily affects the right ventricle. At a later stage, the left ventricle can also be affected, thereby worsening the prognosis. The disease is thought to be caused by dysfunctional desmosomes [129]. In 2010, the original 1994 Task Force criteria for the diagnosis of ARVD/C were modified [130]. The diagnosis is fulfilled by the presence of 2 major criteria, or 1 major plus 2 minor criteria, or 4 minor criteria from different categories. These categories include global or regional dysfunction and structural alterations, tissue characterization of RV myocardium, repolarization abnormalities, depolarization/conduction abnormalities, arrhythmias, and family history. The major and minor CMRI criteria proposed in the updated recommendations include regional RV wall-motion abnormality and either impaired RV function or increased indexed end-diastolic volume (Table 13.3) [130, 131], whereas the major and minor criteria previously recommended included global dilation of the right ventricle, reduced RV ejection fraction, regional wall-motion abnormalities (including localized RV aneurysms), and segmental RV dilation.
Table 13.3
Revised 2010 task-force criteria for the diagnosis of arrhythmogenic right ventricular dysplasia/cardiomyopathy by cardiovascular magnetic resonance imaging
Major | Minor |
|---|---|
Regional RV akinesia or dyskinesia or dyssynchronous RV contraction | Regional RV akinesia or dyskinesia or dyssynchronous RV contraction |
and one of the following: | and one of the following: |
Indexed end-diastolic volume to body surface area ≥110 mL/m2 (male) or ≥100 mL/m2 (female), | Indexed end-diastolic volume to body surface area ≥100 but <110 mL/m2 (male) or ≥90 but <100 mL/m2 (female), |
or RV ejection fraction ≤40 % | or RV ejection fraction >40 but ≤45 % |
With the use of a state-of-the-art SSFP sequence, CMRI is inherently suited for the detailed evaluation of wall-motion abnormalities and global RV function, and this method has high temporal resolution and relatively high spatial resolution in comparison with other noninvasive imaging modalities [1]. Quantitative values obtained by means of CMRI are useful for both diagnosis and follow-up evaluation. Imaging of the right ventricle remains challenging because of the limited wall-thickness. The presence of significant ventricular ectopy and tachyarrhythmia also affects accurate ECG-gating. In the proposed 2010 criteria, tissue characterization of the RV free wall is accomplished by endomyocardial biopsy (which is considered the gold standard), not by CMRI [130]. However, as described in the section “Imaging techniques” of this chapter, several CMRI sequences are designed specifically to evaluate fatty and fibrous replacement of the right ventricle. The presence of fat in the right ventricle is not itself specific for ARVD/C, because this finding is commonly associated with aging [132].
To evaluate the presence of fat in the RV myocardium, the typical imaging protocol includes T1– and T2-weighted turbo spin echo sequences, with and without fat saturation; images are acquired in both the axial-oblique orientation (parallel to the RV free wall) and the transverse/axial orientation. With the routine use of phased-array surface MRI coils for cardiac imaging, rather than the body coil, the anterior coils can be used alone in order to avoid wrap-around artifacts. In addition, to minimize signal interference and improve image quality, a saturation band can be applied to the anterior chest wall. Fatty infiltration occurs predominately at the epicardial border and extends toward the endocardium in finger-like projections [133]. The LV free wall and the interventricular septum can also be affected. In addition to the technique described above, the multi-echo Dixon technique has also been used to evaluate fatty infiltration [105].
For the accurate quantitative analysis of LV and RV function, high-spatial-resolution cine imaging is performed in the axial-oblique and short-axis orientations by using the state-of-the-art SSFP sequence, which provides high contrast between blood and myocardium. The areas frequently affected by ARVD/C include the RV inflow tract, RV outflow tract, and RV apex; these regions are known as the “triangle of dysplasia” [134]. Patients with ARVD/C may also have heavy trabeculation and dilation of the RV outflow tract (in comparison to the LV outflow tract) [135]; these findings are shown well by SSFP imaging. In patients with ARVD/C, the RV free wall can be thinned and can have a bulging or scalloped appearance, suggesting aneurysmal dilation. In a study of familial ARVD/C, 38 family members of patients who had been diagnosed with ARVD/C and a desmosome mutation underwent genetic testing and CMRI. Of the 25 family members who also had a desmosome mutation, 15 (60 %) of them had RV free wall crinkling that worsened during systole, known as the “accordion” sign, and 8 (32 %) of them reported having cardiac symptoms [136].
When the RV myocardium is imaged, DE-MRI is performed approximately 10–15 min after 0.1–0.2 mmol/kg of Gd is administered [137]. Because the right ventricle is a thin-walled structure, we at our institution commonly acquire DE-MRI images both in systole (the shortest trigger-delay the scanner would allow) and in traditional mid-diastole to optimize visualization of the RV myocardium; in our experience, acquiring the image during systole does not result in significant motion artifact. In addition, because the RV myocardium is much thinner than the LV myocardium, the spatial resolution of the DE-MRI sequence has to be optimized for the evaluation of fibrosis replacement in order to reduce partial volume effects; this potentially increases the imaging time and breathing artifact. The inversion time that should be used for the DE-MRI sequence is the same for both the left and right ventricles [138]. In a study by Tandri and colleagues [137], the presence of DE was highly correlated with the existence of fibrofatty changes in endomyocardial biopsies and inducible ventricular tachycardia, as revealed by electrophysiologic testing. In addition, an increasing amount of DE was found to be correlated with a reduction in the RV ejection fraction and an increase in the RV end-diastolic volume. Figure 13.15 shows the results for a patient with ARVD/C.
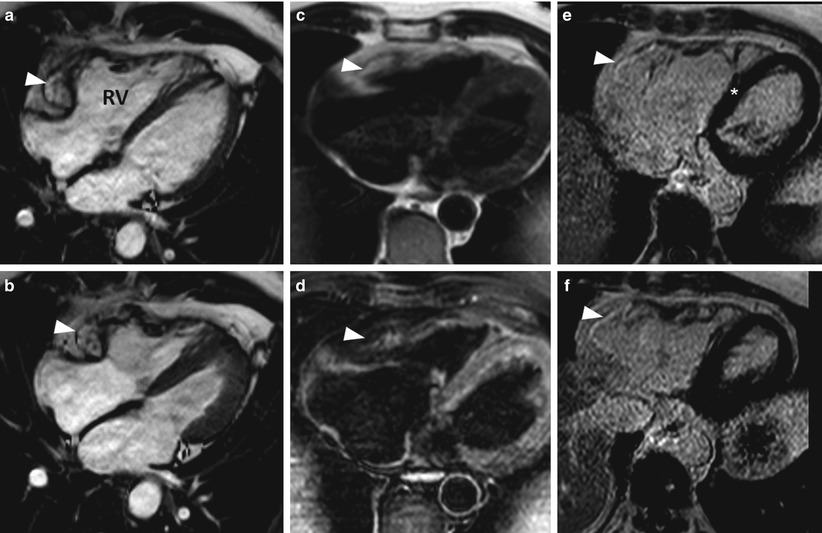
Fig. 13.15
Images from a 58-year-old man with ventricular tachycardia. Images taken during (a) end-diastole and (b) end-systole show aneurysmal dilation (arrowheads) in the basal third of the right ventricle (RV). A fat saturation sequence was used to identify fat in the right ventricular myocardium. Double-inversion turbo spin echo images of the right ventricle (c) without and (d) with fat saturation sequence show signal reduction in the right ventricular myocardium after the fat saturation sequence was applied (arrowhead). Delayed-enhancement magnetic resonance imaging showed hyperenhancement in the area where the aneurysmal dilation was present in the right ventricle (e and f show this dilation at two different levels of the ventricle), indicating fibrous replacement (arrowheads). There was moderate right ventricular systolic dysfunction, indicated by a global ejection fraction of approximately 33 %. The imaging results suggested a diagnosis of arrhythmogenic right ventricular dysplasia
Hypertrophic Cardiomyopathy
Hypertrophic cardiomyopathy is a genetic disorder of the myocardium that affects 1 in 500 people and is the most common cause of sudden death in youth [139]. Surface echocardiography is the first-line imaging modality for HCM because it is patient friendly and provides information about both systolic and diastolic function and the degree of LV outflow tract (LVOT) obstruction at rest and during provocation maneuvers. However, CMRI can often provide a more precise evaluation of the extent and distribution of hypertrophy. In addition, CMRI with a combination of phase-contrast imaging and ventricular volumetric assessment can be used to ascertain other important aspects of HCM such as LVOT obstruction and the degree of associated mitral regurgitation. Recent reports indicate that DE-MRI can also provide important prognostic information concerning patients with HCM.
Hypertrophic cardiomyopathy is typically diagnosed when the patient has unexplained hypertrophy and an LV wall thickness of ≥15 mm with nondilated ventricular chambers [140]. One advantage of CMRI in the context of HCM diagnosis is the ability to image in any plane with no foreshortening or echo dropout, which is especially helpful for visualizing the LV apex. Furthermore, CMRI can accurately quantify LV mass without requiring any geometric assumptions [1, 3]. In a study that compared the diagnostic abilities of CMRI and echocardiography in HCM patients, echocardiography underestimated the maximal LV wall thickness in 10 % of the patients when compared to CMRI (24 ± 3 mm vs 32 ± 1 mm, respectively), and CMRI measurements of the basal anterolateral wall were higher than those taken by echocardiography (17 ± 8 vs 13 ± 6 mm, respectively) [141]. In a study of 333 consecutive HCM patients, CMRI showed that 77 % of the patients had hypertrophy in both the basal anterior wall and the adjacent basal septum [142]. In addition, 12 % of patients had hypertrophy localized in the apex, inferoseptum, or anterolateral wall; this hypertrophy was underestimated or not detected by echocardiography [142]. There are several variants of HCM: asymmetric septal HCM, with and without obstruction; symmetric/concentric HCM; apical HCM (Yamaguchi’s disease); mid-ventricular HCM; mass-like HCM; and noncontiguous HCM [143].
Our institution was among the first to describe the use of DE-MRI in the evaluation of HCM [144]. Delayed enhancement is present in 75–80 % of patients with HCM. Potential causes of HCM include plexiform fibrosis, expanded interstitial spaces, and replacement fibrosis due to underlying ischemia (Fig. 13.16) [64, 145–147]. The presence of DE has been shown to correlate with increased wall thickness [142, 148, 149] and regional wall-motion abnormalities [148]. From the CMRI findings in a small series of HCM patients, researchers determined that although patterns of DE distribution can be seen at almost any location that does not follow a coronary artery distribution (such as subendocardial, mid-myocardial, transmural, and multifocal DE patterns), certain DE patterns, such as RV septal and transseptal, are associated with a high risk of sudden death [145].
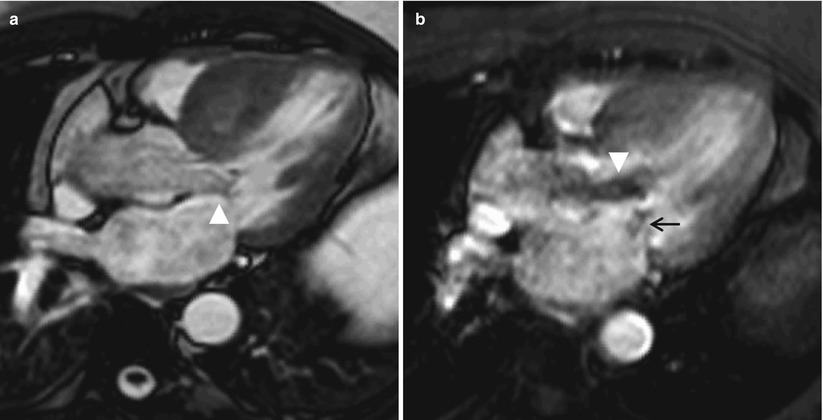
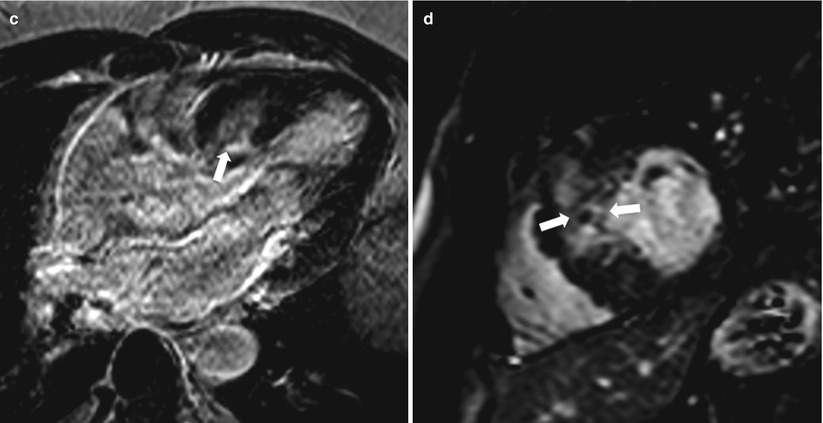
Fig. 13.16
Images from a 58-year-old man who had hypertrophic cardiomyopathy. (a) Image acquired by cine gradient echo steady-state free precession in the left ventricular outflow orientation showing systolic anterior motion of the anterior mitral valve leaflet (arrowhead). Note that the ventricular septum is hypertrophied; the maximum thickness during end-diastole was 3.1 cm (not shown). (b) Corresponding image acquired by using gradient echo planar imaging in the same orientation. The image shows turbulence (arrowhead), which indicates outflow tract obstruction. In addition, eccentric mitral regurgitation can be seen (small black arrow). (c) Delayed-enhancement (DE) magnetic resonance imaging (MRI) in the left ventricular outflow tract orientation showing DE in the septum, where most of the hypertrophy was located (arrow). (d) DE-MRI in the mid-ventricular short-axis orientation showing diffuse DE in the mid-interventricular septum (arrows)
In several recent studies, DE-MRI was used to evaluate the risk of future clinical events and mortality in patients with HCM. The annual mortality rate for these patients was reported to be 1–5 % [150]. In a study that followed up 217 consecutive HCM patients for 3.1 ± 1.7 years, 63 % of the patients were found to have DE [149]. Multivariable analysis showed that for every 5 % increase in the amount of DE, there was a 15 % increase in the risk of reaching the combined primary endpoint of cardiovascular death, unplanned cardiovascular hospital admission, sustained ventricular tachycardia or ventricular fibrillation, or appropriate ICD discharge (HR, 1.15; 95 % CI, 1.01–1.30; P = 0.03). In addition, the researchers also determined that the probability of having congestive heart failure increases as the amount of DE increases. Another study followed up 220 HCM patients (60 % were asymptomatic, 11 % had chest pain, 21 % had New York Heart Association functional class I/II symptoms, and 8 % had class III symptoms) for a mean period of 3 years. For these patients, the presence of any DE was an independent prognosticator of cardiac death, which included SCD, congestive heart failure, and aborted SCD (HR, 4.81; P = 0.035), whereas the presence of one or two traditional clinical predictors of SCD was not clinically significant [151].
In a study that used CMRI and Holter electrocardiographic monitoring, HCM patients with DE were shown to have significantly more premature ventricular complexes, couplets, and nonsustained ventricular tachycardia than HCM patients without DE, and the presence of DE in these patients was an independent predictor of nonsustained ventricular tachycardia (relative risk, 7.3) [152]. Rubinshtein and colleagues [153] followed up 424 HCM patients for 43 ± 14 months. The 239 (56 %) patients with DE on CMRI had more episodes of nonsustained ventricular tachycardia and a higher frequency of ventricular extrasystoles per 24-h period than did the HCM patients without DE. During the study period, SCD occurred in four patients, and appropriate ICD discharge occurred in four other patients; all eight of these events occurred in patients with DE. Nevertheless, the positive predictive value of DE for SCD or ICD discharge in HCM patients with DE was low (3.3 %). In these cases, myocardial fibrosis could be acting as a substrate that promotes reentrant ventricular tachyarrhythmia. Prospective trials are still needed to determine whether using DE-MRI to risk-stratify HCM patients and to determine whether they need ICD implantation would better promote patient survival than using established traditional risk factors, especially as approximately 75–80 % of patients with HCM are reported to have some degree of DE. The presence of DE/fibrosis could contribute to an increase in myocardial stiffness, leading to diastolic dysfunction and symptoms of heart failure, even in patients with normal systolic function. The amount of DE and the rate of DE increase between two CMRI examinations have both been shown to correlate with a worsening New York Heart Association functional class in HCM patients [154].
Hypertrophic cardiomyopathy patients with severe symptoms that are refractory to medical therapy, as well as dynamic LVOT obstruction, associated septal hypertrophy, and systolic anterior motion of the mitral valve leaflet, can be considered for a surgical myectomy or, possibly, alcohol septal ablation (ASA) [140]. Figure 13.17 shows the DE-MRI results 2 days after ASA. Delayed-enhancement CMRI is inherently suited to evaluating the extent of ASA. If imaged early, patients with ASA are invariably found to have MO. At the same time, patients can be assessed for the presence or absence of a residual LVOT gradient and systolic anterior motion of the anterior mitral valve leaflet. In a study that compared the long-term outcomes of 91 consecutive HCM patients who underwent ASA with the outcomes of 40 HCM patients who underwent a traditional septal myectomy (mean follow-up period, 5.4 years), the patients who underwent ASA were found to have lower 1-, 5-, and 8-year survival rates. Furthermore, in multivariable analysis, ASA was found to be an independent predictor of the composite endpoint of cardiac death and aborted SCD (HR, 6.1; 95 % CI, 1.4–27.1; P = 0.02) [155]. In a similar study, however, Sorajja and colleagues [156] found no apparent differences in the survival rate among patients who underwent ASA, individuals in a comparable general population, or age- and gender-matched patients who underwent a myectomy.
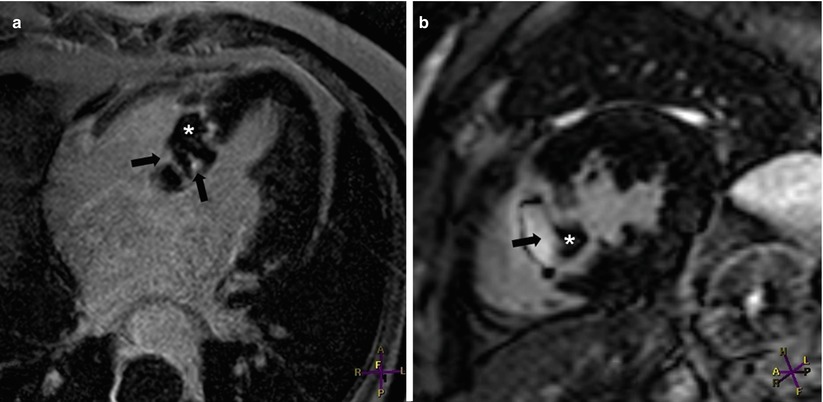
Fig. 13.17
Images from a 53-year-old woman who had symptomatic asymmetric hypertrophic cardiomyopathy. Two days after alcohol septal ablation, delayed enhancement (DE)-magnetic resonance imaging was performed in (a) the four-chamber orientation and (b) the mid-left ventricular short-axis orientation. The alcohol ablation caused transmural DE (black arrows) in the basal half of the interventricular septum. The “islands” of low signal intensity (white asterisks) represent microvascular obstruction
Sarcoidosis
Sarcoidosis is an inflammatory disease characterized by the formation of noncaseating granulomas, which can form in multiple organs. The prevalence of cardiac sarcoidosis varies among reports but could be as high as 50 % in the United States [157, 158]. In 13–50 % of cases, sarcoidosis-related death may be cardiac in origin [159, 160], and SCD may account for to 65 % of the deaths that result from cardiac sarcoidosis [161].
Cardiac MRI can be used to detect several morphological abnormalities present in patients with cardiac sarcoidosis [162]. During acute inflammation, T2-weighted double-inversion spin echo images reveal focal areas of high signal intensity, with and without myocardial thickening. Cine CMRI can be used to detect regional wall-motion abnormalities in locations that have sarcoid infiltration. In advanced cases, focal myocardial thinning and even focal aneurysmal dilation have been detected, especially in the basal septum. In patients with pulmonary involvement, pulmonary hypertension can occur; the associated CMRI findings can include enlarged pulmonary arteries, RV dilation, and hypertrophy. Furthermore, the findings of mediastinal and hilar adenopathy in axial spin and gradient-echo images may suggest pulmonary sarcoidosis.
Many authors have described the use of DE-MRI for evaluating patients with suspected or confirmed cardiac sarcoidosis [163–167]. This condition has a predilection for the interventricular septum, especially the basal septum [163, 167]; however, DE may be present in almost any myocardial segment [165]. Delayed enhancement may be mid-myocardial, perhaps extending into the subepicardium or subendocardium, or may be transmural, possibly extending into the adjacent right ventricle. In addition, DE may be multifocal (Fig. 13.18) [163, 165, 167].
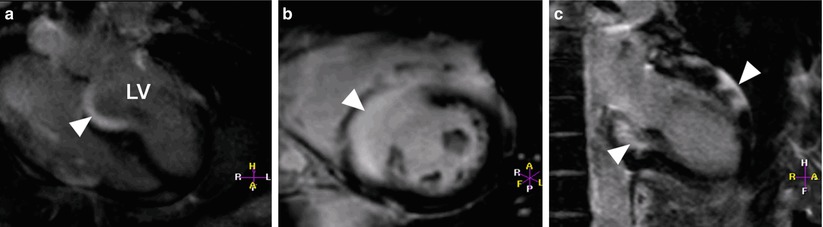
Fig. 13.18
Images from a 23-year-old woman who had pulmonary sarcoidosis and presented with ventricular tachycardia. Angiography, performed 1 week earlier, showed no evidence of coronary artery obstruction. Aneurysmal dilation was seen in the basal interventricular septum when images were acquired in (a) the four-chamber orientation and (b) the mid left ventricular short-axis orientation. Near-transmural delayed enhancement (DE) (arrowheads) can be seen in both (a) and (b). The image acquired in the two-chamber orientation (c) revealed DE extending to the inferior wall and involving the anterior epicardial wall. LV left ventricle
Using the guidelines provided by the Japanese Ministry of Health and Welfare as the standard for diagnosing cardiac sarcoidosis, the sensitivity and specificity of CMRI in the diagnosis of this condition were found to be 100 and 78 % (n = 58), respectively, by Smedema and colleagues [165] and 75 and 77 % (n = 21), respectively, by Ohira and colleagues [164]. Patients in both studies had documented extravascular sarcoidosis, and they presented for evaluation of suspected cardiac sarcoidosis. The study by Smedema and colleagues did not require endomyocardial biopsy, and the criteria for diagnosis of cardiac sarcoidosis by CMRI included a combination of wall-motion abnormalities and DE. In the study by Ohira and colleagues, only two patients underwent endomyocardial biopsy, and the criteria for diagnosing cardiac sarcoidosis by CMRI included an increased signal intensity in T2-weighted imaging and/or the presence of DE. In another study in which DE-MRI was used to evaluate ten patients with cardiac sarcoidosis (diagnosed by either clinical criteria [nine patients] or biopsy [one patient]), the sensitivity of DE-MRI was 100 %; four of the ten patients also had regional wall-motion abnormalities. In addition, these patients underwent 201Tl and 67Ga scintigraphy; the detection rates for these techniques were only 50 and 20 %, respectively [166]. All the above-mentioned studies had the same limitations: a small sample size and few histologically confirmed cases of cardiac sarcoidosis.
Patel and colleagues [167] evaluated the ability of DE-MRI to identify cardiac involvement in 81 patients with biopsy-confirmed extracardiac sarcoidosis (biopsy specimens were all obtained from the RV side of the interventricular septum). Endomyocardial biopsy or autopsy results for 15 patients (19 %) revealed histologic evidence of cardiac sarcoidosis in four patients, all of whom also had DE. Of the remaining 11 patients whose pathology findings were negative for cardiac sarcoidosis, six patients (55 %) had DE. The DE was present in the left ventricle, not in the right ventricle, highlighting the possibility that a sampling error might have occurred during the biopsy. In patients with DE, the event rate (all-cause mortality, symptomatic bradycardia, or ventricular tachyarrhythmia) and the cardiac death rate were, respectively, 9 and 11.5 times higher than in patients without DE [167]. Because of the limited number of adverse events, larger prospective studies should be conducted to confirm whether CMRI and DE-MRI could be used to risk-stratify patients with cardiac sarcoidosis.
Left Ventricular Noncompaction
Left ventricular noncompaction (LVNC) is characterized by excessive and prominent trabeculations with deep recesses that communicate with the ventricular cavity but not with the coronary circulation [168]. This condition is denoted by many different names, including spongiform cardiomyopathy, honeycombed myocardium, LV hypertrabeculation, and isolated LV abnormal trabeculation. It may have been mentioned as early as the 1920s [169], and it is increasingly being described in the current literature, probably because of technological advances in noninvasive imaging modalities.
The exact etiology of LVNC is unknown. Many authors regard LVNC to be a developmental abnormality. Usually, during the second month of embryogenesis, the trabecular meshwork that constitutes the fetal myocardium undergoes intrauterine compaction. In LVNC, however, this compaction is believed to be arrested, resulting in the characteristic thin, compacted epicardial layer with an overlying noncompacted layer of trabeculations [170]. During normal embryogenesis, the trabecular layer of the developing LV myocardium is known to compact from the base to the apex, from the epicardium to the endocardium, and from the septal wall to the lateral wall [171]; this process explains the typical location of LVNC, as shown by CMRI (see below). Some authors have proposed that LVNC may be due to impaired myocardial growth, may represent an adaptation to different hemodynamic conditions, or may result from metabolic defects [172]. Although the American Heart Association classifies LVNC as a primary, genetically determined cardiomyopathy [173], the World Health Organization and the European Society of Cardiology regard LVNC as an unclassified cardiomyopathy [22, 23].
Left ventricular noncompaction is commonly associated with congenital heart disease. In a series of 202 patients who fulfilled the imaging criteria for LVNC, 24 patients also had congenital heart disease. Of these 24 patients, 11 had LVOT abnormalities (uni- or bicuspid aortic valve, aortic coarctation, aortic hypoplasia, or subaortic stenosis), 6 had Ebstein anomaly, and 2 had tetralogy of Fallot. Conversely, when the authors reviewed the records of patients with different congenital heart diseases at the same institution, they found that LVNC was most prevalent in patients with Ebstein anomaly (15 %; 6 of 40 patients), followed by coarctation of the aorta (3 %; 2 of 60 patients) and tetralogy of Fallot (2 %; 3 of 129 patients) [174]. The current discussion will be limited to patients who have LVNC without associated cardiac abnormalities.
Despite the increased diagnosis of LVNC by state-of-the-art noninvasive imaging, there is currently no consensus regarding the criteria to use for diagnosing LVNC by CMRI [175–177] or echocardiography [168, 178–180]. Because of the inherently high contrast-to-noise ratio, the state-of-the-art imaging sequence SSFP can be used to visualize the myocardial trabeculation and the blood pool present in LVNC patients. This approach offers high spatial and temporal resolution (Fig. 13.19). Furthermore, because no geometric assumptions are necessary, this sequence can produce accurate and reproducible LV quantitative data, including LV volumes and cardiac mass. Two echocardiographic reports have indicated that LVNC commonly involves the apical segment (the entire apex was regarded as 1 segment) [168, 181]. Furthermore, in correctly performed CMRI, there should be no ventricular foreshortening; this is particularly important in the detection of LV thrombus, a well-described complication in symptomatic LVNC with impaired LV systolic function. Black-blood imaging with the double-inversion recovery sequence can help detect abnormal areas with increased trabeculations by revealing slow flow. Although surface echocardiography is the first-line noninvasive imaging modality, CMRI more completely delineates the extent of trabeculation in patients with LVNC [182]. In addition, some findings that can mimic LVNC can be easily distinguished by CMRI; examples include false tendons, abnormal insertion of papillary muscles, and aberrant bands.
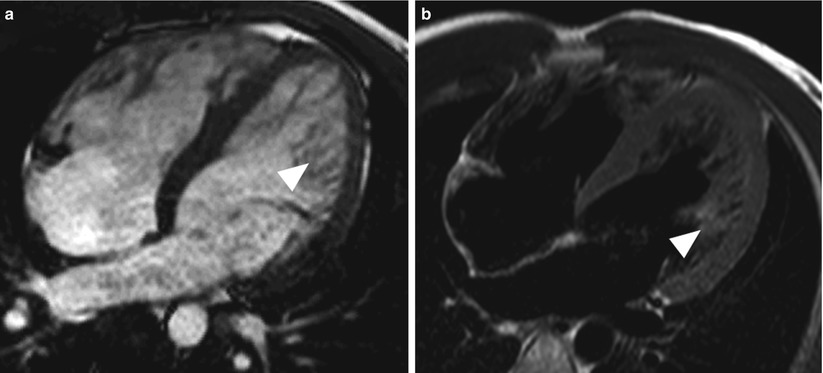
Fig. 13.19
Images from a 28-year-old man who had left ventricular noncompaction. A significant increase in trabeculation in the distal third of the left ventricle (arrowhead) can be seen in (a) a cine gradient echo image acquired by steady-state free precession in the four-chamber orientation and (b) the corresponding double-inversion recovery T2-weighted spin-echo image
Table 13.4 summarizes the criteria commonly used for the diagnosis of noncompaction by means of surface echocardiography [168, 178, 180], and Table 13.5 presents the criteria used in recent publications to diagnose LVNC by means of CMRI [175–177]. In a CMRI study of healthy volunteers between 20 and 80 years old, the mean trabecular:compacted layer ratio during end-diastole was shown to be less than 1 in all cardiac segments except 16 (the apical lateral wall, 1.19) [183].
Table 13.4
Surface echocardiographic criteria commonly used to diagnose left ventricular noncompaction
Chin et al. [178] | Jenni et al. [168] | Stollberger et al. [180] |
|---|---|---|
Ratio of X/Y ≤0.5, where X is the distance between the epicardial surface and the trough of the trabeculation and Y is the distance between the peak of trabeculation and the epicardial surface. Measurements taken during end-diastole at the level of the mitral valve and the papillary muscles (parasternal long-axis view) and at the apex (apical 4-chamber or subxiphoid views). | Markedly thickened LV wall that has two layers (NC and C). NC/C ratio of >2 at end-systole in the parasternal short-axis view (basal, mid, and apical). Color Doppler evidence of deep intertrabecular recesses filled with blood. Hypokinesia of the affected/ adjacent segments. Prominent trabecular meshwork in the LV apex or midventricular segments of the inferior and lateral wall. More than three trabeculations present, as defined by Stollberger and colleagues [180]. No other cardiac abnormalities present. | Three trabeculations protruding from the left ventricle, apically to the papillary muscles, visible in one imaging plane. Color Doppler evidence of deep intertrabecular recesses filled with blood. |
Table 13.5
Cardiovascular magnetic resonance criteria used to diagnose left ventricular noncompaction
Petersen et al. [175] | Jacquier et al. [176] | Grothoff et al. [177] |
|---|---|---|
NC/C ratio of >2.3 during end-diastolea Images acquired in three views: vertical long-axis, horizontal long-axis, and parasternal long-axis The apex (segment 17) is excluded from analysis because the myocardium is thinner at this level and prominent trabeculation is commonly seen in the apex of normal subjects | Trabeculated mass >20 % of global LV massb Papillary muscles are included in the myocardial mass measurement (compacted mass) Trabeculation is defined as myocardium protruding from the LV wall into the LV cavity Trabeculated mass = global LV mass (mass including papillary muscles and trabeculation) – compacted mass | Percentage of noncompacted myocardial mass >25 %c Total noncompacted myocardial mass index >15 g/m2 c NC/C ratio ≥3 in at least 1 of the following segments: 1–3 or 7–16c NC/C ratio ≥2 in segments 4–6c |
Using CMRI, Petersen and colleagues [175] noted that trabeculations occur most frequently in the apex and in the distal third of the left ventricle, followed by the mid-anterior, lateral, and inferior walls. Similarly, Grothoff and colleagues [177] noted that trabeculations are most frequently located at the apex and in the distal third of the left ventricle, followed by the mid-inferior, lateral, and mid-anterior walls. The basal septum is usually not involved.
Many investigators have observed DE in LVNC patients [184–189], although the location and extent of DE varies by report; DE can be subendocardial, mid-myocardial, subepicardial, transmural, or a combination of these, and it can affect both normal segments of the heart and areas with noncompaction [186, 188, 189]. There appears to be no association between DE and noncompaction of the LV segment [189]. In a case report regarding a patient who underwent cardiac transplantation because of LVNC with severe congestive cardiac failure, the near-transmural DE seen in the interventricular septum (free of trabeculations) corresponded to the presence of fibrosis, as shown by histologic analysis. Furthermore, diffuse DE was seen in the free wall of the left ventricle and in the associated noncompacted area; histologic examination revealed fibrosis in the trabeculated areas and mucoid degeneration in the endocardium [190]. In an original article by Jenni and colleagues [168], the hearts of seven LVNC patients were studied anatomically, either postmortem or after heart transplantation; none of the seven patients had other cardiac abnormalities. Histologic examination revealed ischemic lesions in the thickened endocardium and in the prominent trabeculations. Interstitial fibrosis was also detected in six of the seven patients.
The exact mechanism of DE in LVNC is largely unknown. In LVNC patients, diminished coronary flow reserve has been observed in noncompacted and compacted segments on PET evaluation, suggesting microvascular dysfunction [191]. Similar observations have been made in children with LVNC [192]. The reduction in flow reserve and the altered myocardial perfusion could be due to failure of the coronary microcirculation to grow in conjunction with the increasing LV mass [185]. The above-mentioned mechanisms could potentially contribute to myocardial ischemia and, ultimately, scarring. Microvascular dysfunction could lead to contractile impairment.
In a study by Kohli and associates [193], echocardiographic results from patients with LV systolic dysfunction were compared with results from 60 healthy volunteers (30 white and 30 black). Five of the volunteers (4 black and 1 white) fulfilled 1 or more of the echocardiographic criteria for LVNC (as listed in Table 13.4), raising the question of whether the imaging criteria for LVNC are too sensitive. A similar observation was made in a recent CMRI study of 323 participants in the Multi-Ethnic Study of Atherosclerosis who had no history of LVNC, cardiac disease, or hypertension and who showed no DE on CMRI examination [194]. Of these 323 participants, 140 (43 %) had a noncompaction:compaction (NC:C) ratio of >2.3 in at least 1 region, and 20 (6 %) had an NC:C ratio of >2.3 in >2 regions. An NC:C ratio of >2.3 was most frequently located in the apical anterior, apical septal, and apical lateral wall.
Cardiac Amyloidosis
Cardiac amyloidosis refers to the extracellular deposition of low-molecular-weight, insoluble amyloid fibrils in a β-pleated sheet configuration [195]. There are three common subtypes of amyloidosis: (1) AL amyloidosis, or primary amyloidosis, which is characterized by the accumulation of monoclonal immunoglobulin light chains and has the worst prognosis; (2) ATTR amyloidosis, which can be caused by either a transthyretin gene mutation, leading to hereditary amyloidosis, or by wild-type transthyretin deposits, resulting in senile systemic amyloidosis; and (3) systemic AA amyloidosis, which involves amyloid fibrils that arise from serum amyloid A protein and can complicate chronic inflammatory diseases [195].
The noninvasive-imaging findings that are commonly produced by surface echocardiography in patients with cardiac amyloidosis—such as biventricular hypertrophy, normal or small ventricular size, bi-atrial enlargement, and septal thickening [196]—can also be optimally evaluated by CMRI. A CMRI study by Fattori and colleagues [197] showed that the interatrial septum, right atrial free wall, and RV free wall were significantly thicker in patients with cardiac amyloidosis than in patients with HCM. In addition, approximately half of the patients with cardiac amyloidosis also had pericardial and or pleural effusions.
In a study by Maceira and associates [111], 30 patients who had histologically proven amyloidosis with cardiac involvement, diagnosed predominantly by echocardiographic criteria, were all assessed by late Gd enhancement CMRI. Twenty (69 %) of these patients had global and diffuse subendocardial DE after Gd-chelate administration that was evident in the right and left ventricles. This pattern of subendocardial DE has also been observed in other studies [198–200]. In Maceira’s study [111], the Gd washout from the myocardium and the blood was also faster than normal, probably because of the increased extracellular space and the increased distribution of Gd into the total amyloid load (the use of 0.1 mmol/kg of Gd could also have contributed to this finding). Therefore, the DE-MRI sequence produced similar myocardial and blood T1 values in patients with amyloidosis, so the blood pool had a persistently low signal intensity, similar to that of the myocardium [111]. At our institution, we have noted that in patients who are subsequently confirmed to have cardiac amyloidosis, the “nulling-time” in the DE-MRI sequence necessary to suppress the myocardial signal is difficult to achieve, resulting in widespread patchy enhancement in the entire myocardium (Fig. 13.20). This finding is consistent with an increase in extracellular space due to amyloid protein deposition in the heart, rather than true myocardial fibrosis [198]. The same observation has been reported by other investigators [198, 201]. In a study of patients with amyloidosis, CMRI was performed in a subset of patients who had histologically proven cardiac sarcoidosis. Abnormal DE was found in 34 of the 35 patients (97 %); 21 of these patients (60 %) had global transmural DE, and 8 (23 %) had global subendocardial DE [198]. The location of DE matched the distribution of interstitial amyloid in the histologic specimens.
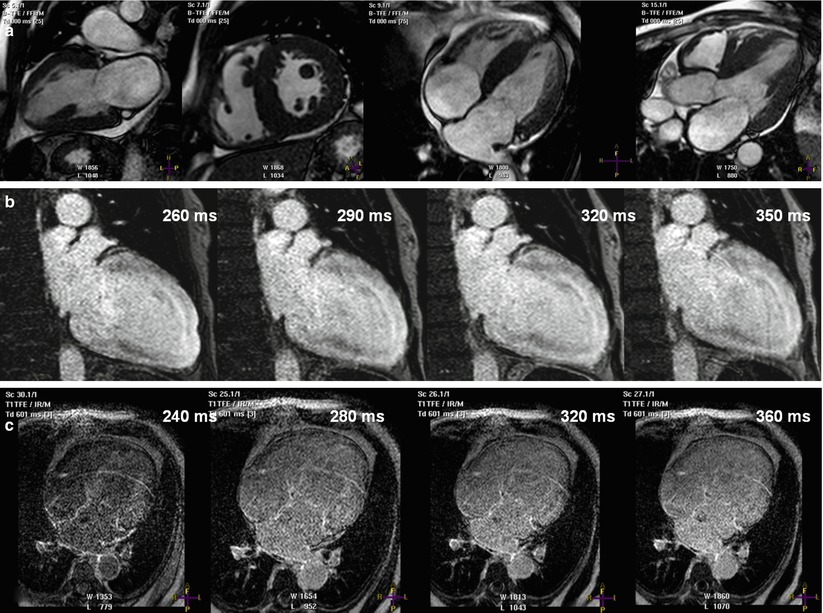
Fig. 13.20
Images from a 68-year-old man who presented with malaise, biventricular failure, and a history of multiple myeloma. The top row (a) shows still frames acquired by using steady-state free precession in various orientations. They show left ventricular hypertrophy and, possibly, mild right ventricular hypertrophy. The middle row (b) shows images acquired by using delayed-enhancement magnetic resonance imaging (DE-MRI) in the two-chamber orientation. In these images, the left ventricular myocardium was never well “nulled” at the different inversion times (shown in the right upper corner). Similarly, the myocardium was never well nulled in the images on the bottom row (c), which were acquired by using DE-MRI in the four-chamber orientation. Twelve-lead electrocardiography revealed low voltage in both the chest and limb leads (not shown). Subsequent fat-pad biopsy confirmed the diagnosis of amyloidosis
Endomyocardial biopsy is considered the gold standard for the diagnosis of cardiac amyloidosis [202]. A series of 33 consecutive patients who had congestive heart failure with a restrictive filling pattern underwent endomyocardial biopsy and a comprehensive CMRI examination [199]. The biopsy confirmed the diagnosis of cardiac amyloidosis in 15 of the patients. In this study, the typical DE pattern for cardiac amyloidosis was circumferential subendocardial with various degrees of extension into the adjacent myocardium. Using endomyocardial biopsy as the standard, the sensitivity, specificity, positive predictive value, and negative predictive value of DE-MRI were calculated to be 80, 95, 92, and 85 %, respectively [199]. In a recent study by Austin and colleagues [203], a subset of patients with suspected cardiac amyloidosis (38 of 47 patients) underwent endomyocardial biopsy and complete CMRI study, including DE-MRI. The diagnostic utility of DE was compared with that of low-voltage ECG (Carroll’s ECG criteria), abnormal deceleration time on Doppler echocardiography (≤150 ms), and the combination of ECG and deceleration-time criteria. The presence of DE had the highest diagnostic accuracy of the noninvasive imaging parameters tested. The sensitivity, specificity, positive predictive value, and negative predictive value of DE-MRI, using endomyocardial biopsy as the standard, were 88, 90, 88, and 90 %, respectively. These results are in agreement with those published by Vogelsberg and colleagues [199].
Besides using DE-MRI to evaluate suspected cardiac amyloidosis, various investigators have also relied on measured T1 times and estimates of ECF due to extracellular space expansion to diagnose cardiac amyloidosis [111, 200, 204, 205]. Krombach and colleagues [200], using a 1.5 T MRI scanner, found that a patient with biopsy-proven cardiac amyloidosis had substantially higher myocardial T1 times (1,387 ± 63 ms) than did a group of individuals without known myocardial disease (1,083 ± 33 ms). In another study, the T1 times were longer in 19 consecutive patients with cardiac amyloidosis than in ten healthy control subjects (1,340 ± 81 vs 1,146 ± 71 ms; P <0.0001) [200]. A T1 time of 1,273 ms was determined to be the best discriminatory value for diagnosing cardiac amyloidosis by ROC analysis, with a sensitivity of 84 % and a specificity of 100 %. Using a 3 T MRI scanner, Mongeon and colleagues [204] quantified myocardial ECF in 14 patients with biopsy-proven cardiac amyloidosis. The median ECF in amyloid patients was 0.49, whereas the median ECF in healthy subjects was 0.24 (P = 0.0001). The increase in myocardial ECF (reflecting the expansion of the extracellular matrix) is due to either amyloid protein accumulation in the interstitial space or fibrosis, both of which can lead to an increase in Gd uptake [111, 204]. In patients with cardiac amyloidosis, obtaining high-quality DE images could prove to be technically challenging because of the rapid myocardial uptake of Gd and the associated difficulty of selecting the correct inversion time for accurate “nulling” of the myocardium. The measurement of myocardial ECF could overcome this difficulty and provide an objective means to quantify the degree of amyloid deposition, fibrosis, or both. Another possible use of the ECF measurement could be disease monitoring after the treatment for amyloidosis has been administered.
Several recent studies have indicated that DE could be an adverse prognosticator for cardiac amyloidosis [203, 206, 207]. In a study by Ruberg and colleagues [206], which involved 28 patients with systemic AL amyloidosis, 19 patients were found to have DE. Although the presence of DE did not predict mortality (during the median follow-up time of 29 months), the amount of DE, expressed as a percentage of the LV mass, was the strongest independent predictor of the B-type natriuretic peptide level when compared to other LV quantitative factors. In another group of patients with AL amyloidosis, 23 (79 %) of the 29 patients who underwent CMRI had DE [207]. After 26 ± 13 months of follow-up, 14 of those 23 DE-positive patients had died, whereas none of the patients without DE had died (P = 0.0061). Potential mechanisms proposed by the authors to account for these adverse outcomes in patients with AL amyloidosis included systolic and diastolic dysfunction, underlying myocardial ischemia with perivascular and interstitial deposition of amyloid proteins, and endothelial dysfunction [207]. Like Ruberg and colleagues, Maceira and associates [208] did not identify DE as a significant predictor of mortality (only a trend was seen); however, the difference between the T1 values of the subepicardium and subendocardium, as measured 2 min after Gd administration, was able to predict mortality with 85 % accuracy when a threshold value of 23 ms was used. The close T1 values between the subepicardium and subendocardium probably reflect the underlying myocardial amyloid burden.
Takotsubo (Stress) Cardiomyopathy
Takotsubo cardiomyopathy (TCM), also known as stress cardiomyopathy, has been increasingly recognized as a differential diagnosis of acute coronary syndrome. Patients typically present with chest pain, ECG changes, and mild elevation of cardiac enzymes; these changes are often precipitated by emotional stress in the absence of significant CAD [209–211]. Classically, there is a “balloon-like wall-motion” abnormality that predominately involves the LV apex and the distal left ventricle [212]. However, different subtypes have been described, including “reverse TCM,” in which the base of the left ventricle has a wall-motion abnormality and the apex is hyperdynamic; the mid-LV variant, in which the base and apex of the left ventricle are spared; and the localized variant, which affects various segments of the left ventricle [209, 213]. Furthermore, although the left ventricle is usually affected, involvement of the right ventricle has also been well described [214–217]. The Mayo Clinic’s diagnostic criteria for TCM, as suggested by Hurst and colleagues [209], are outlined here with modifications: (1) transient wall-motion abnormalities of the LV apex and mid segment that involve more than a single vascular bed (although, as detailed above, wall-motion abnormalities can occur elsewhere), (2) absence of CAD or angiographic evidence of plaque rupture, (3) new ECG changes and elevation of myocardial biomarker levels, and (4) absence of pheochromocytoma and myocarditis.
Various CMRI sequences are helpful in the assessment of TCM. The cine SSFP sequence allows excellent morphological evaluation of both the left and right ventricles, especially the apices, and accurate quantitative assessment of biventricular function. The spin echo sequence with fat saturation can be used to evaluate myocardial edema. In addition, DE-MRI detection of myocardial fibrosis and necrosis is especially important in the differential diagnosis of acute coronary syndrome and TCM.
Eitel and colleagues [217] conducted 1 of the largest studies of TCM, which included 256 patients, 239 (93 %) of whom had CMRI data available. Two hundred seven patients (81 %) were postmenopausal women, 225 patients (88 %) presented with symptoms consistent with acute coronary syndrome, and 182 patients (71 %) had experienced a significant stressful event within the 48 h before presentation. Classical apical ballooning was detected by CMRI in 197 patients (82 %); in 81 patients, both the left and right ventricles were involved. In this study, patients with both RV and LV involvement (suggesting more extensive disease) were older, were hospitalized longer, and had lower LVEFs than patients without RV involvement (43.1 % vs 45.3 %; P <0.001). These findings are similar to those reported by other authors [214, 216]. Eitel and colleagues also detected evidence of myocardial edema in 162 of the 199 patients (81 %) who had dedicated imaging sequences performed; the location of myocardial edema was similar to the distribution of wall-motion abnormalities in the left ventricle. Furthermore, when the signal intensity threshold was limited to between 3 and 5 standard deviations, 22 patients (9 %) were shown to have focal or patchy DE, but the DE was not identified in follow-up CMRI examinations. Patients who were DE-positive tended to have higher cardiac troponin levels at presentation, although no significant difference was noted in the quantitative functional values between the DE-positive and DE-negative groups. Associated CMRI findings included pleural effusion (more often in patients with biventricular involvement), pericardial effusion (more often in patients with myocardial edema), and ventricular thrombus (in four patients) [217].
Myocardial edema has been observed in patients with TCM [217–222]. In T2-weighted images acquired by CMRI, the majority of TCM patients appear to have an increase in signal intensity with a transmural distribution that corresponds to the location of wall-motion abnormalities [217, 219, 221]. In the study by Eitel and colleagues [217], 158 patients (62 %) underwent follow-up CMRI (median follow-up period, approximately 3 months). A significant reduction in the T2 ratio (signal intensity of myocardium/signal intensity of skeletal muscle) was noted, indicating an improvement in myocardial edema. Similarly, Neil and colleagues [220] observed a reduction in T2 signal intensity at the 3-month follow-up CMRI study; however, the signal intensity in patients with TCM was still higher than the signal levels in healthy control subjects. In contrast to the other authors referenced above, Neil and colleagues noted that although the T2 signal intensity was greater at the apex than at the base (P <0.0001) in patients with typical TCM, these patients still had a higher T2-signal intensity at the base than did age-matched control subjects [220]. Various mechanisms have been proposed to explain the presence of myocardial edema in TCM patients, including inflammation, transient ischemia, and increased wall stress. In addition, high intraventricular pressure could cause a perfusion abnormality that could subsequently lead to edema [217]. Figure 13.21 shows typical findings from a TCM patient.
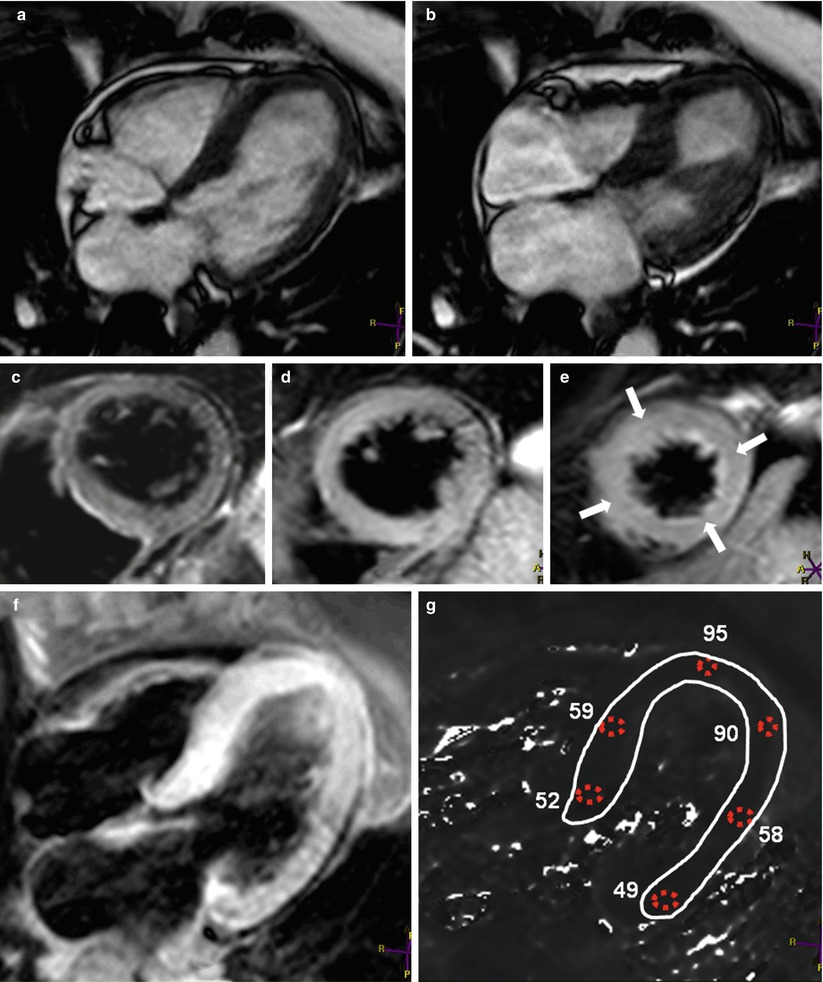
Fig. 13.21


Images from a 48-year-old woman who had acute chest pain. The images were acquired by using steady-state free-precession cine imaging in (a) end-diastole and (b) end-systole. Note that only the basal 2/3rds of the left ventricle are contracting during systole, which is typical for classical apical ballooning syndrome, also known as Takotsubo syndrome. Double inversion T2-weighted spin echo images are shown of the basal third (c), the middle third (d), and the distal third (e) of the left ventricle. Note the increased signal intensity in the distal third of the left ventricle (arrows). Dedicated T2-mapping was carried out in the four-chamber orientation (f). Results of the T2 analysis are shown in (g). The T2 values in the distal left ventricle were higher than the patient’s normal myocardial T2 values, which were between 40 and 60 ms. These results confirm the visual assessment and correspond to the wall-motion abnormality. Delayed-enhancement magnetic resonance imaging results were normal (not shown)
Stay updated, free articles. Join our Telegram channel
Full access? Get Clinical Tree
