Fig. 12.1
Comparison of coronary stents versus medical management (Adapted from Stergiopoulos and Brown [10] with permission from American Medical Association)
Fig. 12.2
Randomized medicine, angioplasty or surgery study (MASS) 5 year follow-up (Adapted from Hueb et al. [11] with permission from Lippincott Williams & Wilkins)
However, in randomized trials, PCI guided by Fractional Flow Reserve (FFR) using intracoronary pressure wires demonstrated improved survival over patients with PCI guided by arteriographic stenosis severity, Fig. 12.3 [15–19]. Decreased adverse procedure related events accounted for the major difference in survival between the groups with FFR and arteriogram guided PCI with little difference in later adverse events.
Fig. 12.3
Randomized trials of stents versus medical treatment. (a) The COURAGE Trial, (b) The FAME 1 Trial (Adapted from Gould [20])
These data suggest an additional reason for parallel survival curves in the randomized medical versus revascularization trials – suboptimal patient selection for revascularization based on arteriographic severity instead of functional severity measured by FFR. Consistent with this suggestion, a substantial literature documents the failure of anatomic severity on arteriogram to reflect or predict functional severity of coronary artery disease in patients [20–31].
Coronary Function (Flow) Versus Anatomy on Arteriogram
In experimental models of coronary artery stenosis, anatomic stenosis severity parallels functional severity measured as coronary flow reserve Fig. 12.4 [32–43]. However, in humans there is poor or no relation between anatomic severity and coronary flow reserve Fig. 12.4 due to heterogeneous diffuse disease and/or arterial remodeling [20–29], illustrated in Fig. 12.5.
Fig. 12.4
Relation of coronary flow reserve to percent diameter stenosis in experimental animals and in patients. (a) Experimental studies, (b) Clinical studies (Adapted from Gould [20])
Fig. 12.5
Schematic illustrating effect of diffuse disease and arterial remodeling on the relation of coronary flow reserve (CFR) to percent stenosis (Adapted from Gould [20])
Since flow is a function of arterial radius raised to the fourth power, Fig. 12.6 illustrates the marked changes in coronary flow reserve with small changes in anatomic diameter that cannot be measured accurately on an invasive arteriogram. The CT angiogram has much poorer resolution than an invasive arteriogram thereby being even more inadequate for assessing stenosis severity, as also documented in the literature [20, 23, 25, 31]. Thus, the inadequacy of anatomic severity fails to indicate functional severity is due to three fundamental unalterable reasons: poor resolution, diffuse disease and arterial remodeling [20].
Fig. 12.6
Cine X-ray of percent stenosis in a phantom to arteriogram appearance and expected coronary flow reserve based on a fluid dynamic model and animal experiments (Adapted from Gould [20])
What About Stress Tests for Coronary Function?
In the traditional paradigm above, stress testing provides the only “functional” assessment of disease severity. However, stress testing was a part of the arteriogram driven paradigm in the randomized trials failing to show survival benefit of revascularization compared to medical management. Moreover, several other facts challenge the value of current traditional stress testing in managing CAD.
SPECT stress perfusion imaging correlates poorly with FFR, the best documented guide for selecting patients for PCI, with discordance in 58 % of patients [44], illustrated in Fig. 12.7. The SPARC report showed that SPECT perfusion imaging had an impact on patient management in only 22 % of cases undergoing stress SPECT perfusion imaging, Fig. 12.8 [45]. Of elective Medicare PCI procedures, 55 % were done with no prior stress tests [46].
Fig. 12.7
Relation between FFR and defect detected by SPECT imaging in multivessel disease (Adapted from Melikian et al. [44] with permission from Elsevier)
Fig. 12.8
SPARC – Study of perfusion and anatomy imaging roles in CAD (Adapted from Hachamovitch et al. [45] with permission from Elsevier)
One reason for these limitations and reported low impact of SPECT stress perfusion imaging is attenuation artifact and depth dependent poor resolution illustrated in Fig. 12.9. For this 20 cm Jaszczak phantom filled with activity, there is a 50 % loss of activity recovery in the central region due to attenuation. The only cold spot or negative defect clearly identifiable is 3 cm diameter with no activity in it as a solid plastic sphere. By comparison, the same phantom imaged by positron emission tomography (PET) with attenuation correction and much better uniform resolution show correct activity recovery uniformly throughout the phantom and shows even the smallest defects.
Fig. 12.9
Effects of resolution and attenuation correction on cold defect imaging by SPECT and PET
Quantitative Coronary Function – Positron Emission Tomography
The consequence of its superior technology is illustrated by several examples commonly seen in our PET center, here shown in single views. Figure 12.10 is from a 58 year old woman with atypical but significant chest discomfort, normal ECG and SPECT perfusion imaging tests, told she had no CAD. Dipyridamole PET showed a severe defect (blue) in the distribution of a large diagonal coronary artery. PCI of this severe stenosis relieved her symptoms and normalized follow-up PET images. Figure 12.11 is from a 43 year old woman with atypical chest discomfort, abnormal ECG and SPECT perfusion imaging tests for whom a coronary arteriogram was recommended. Dipyridamole PET showed normal perfusion with no stenosis thereby demonstrating that the standard stress tests were false positives.
Fig. 12.10
Case example of false negative stress SPECT being wrong with correct conclusion by PET
Fig. 12.11
Case example of false positive stress SPECT being wrong with correct conclusion by PET
Figure 12.12 shows three patients requesting second opinions: The first had chest pain, a positive stress test and reportedly a “severe” origin stenosis of the Left Circumflex coronary artery on arteriogram referred for bypass surgery since PCI if the origin stenosis was deemed high risk. The PET images showed normal stress perfusion with no significant stenosis and normal coronary flow reserve; the lip divider of the LAD-LCx branch point appeared to have been interpreted as a severe stenosis.
Fig. 12.12
Second opinions based on PET for three separate patients
The second case in Fig. 12.12 had progressive mild angina, a prior LIMA to the LAD and a PET scan showing a severe stress defect in the LAD distribution with myocardial steal indicating occlusion or severe stenosis with collateralization. The PET was confirmed by coronary arteriogram and PCI was done. The third case of Fig. 12.12 is a woman who had a myocardial infarction by enzymes without ST elevation; arteriogram showed a small occluded collateralized first diagonal and reportedly “severe” LAD stenosis for which a second procedure was recommended. PET showed a mild stress defect in the first diagonal distribution and excellent coronary flow reserve of 3.4 with no stress defect in the LAD distribution. The second procedure was cancelled with excellent event free course on medical treatment 8 years later.
Fractional Flow Reserve and Beyond
Invasive FFR and non-invasive PET are demonstrated powerful technologies for assessing physiologic severity of CAD as the guide to revascularization. Which is “best”, are they complimentary or competitive?
While physiologic severity of stenosis by invasive FFR is done in the United States, it raises a complex issue. In Europe where the randomized FFR trials originated, stents and revascularization procedures are a cost that reduces remaining resources needed for other uses. Therefore, FFR to reduce the number of stent procedures has an economic incentive as well as better outcomes than procedures based on the angiogram.
In the United States, stents and revascularization procedures are a revenue source that contributes to income for the hospital in which the procedures are performed. Therefore, in the United States, measuring FFR increases cost with a reasonable probability that the measured FFR does not indicate a stent or revascularization procedure, thereby reducing incoming revenue. Consequently, there is a strong economic disincentive to rely on frequent FFR measurements to guide revascularization decisions.
The FFR randomized trials of FFR versus arteriogram guided PCI have had major conceptual effect on invasive cardiology. However, it has had limited practical effect in the USA for economic and emotional reasons as explicitly expressed by an invasive cardiologist in a formal peer reviewed published survey as follows:
“Although cardiologists might believe they are benefiting their stable patients with CAD by performing PCI, this belief appears to be based on emotional and psychological factors rather than on evidence of clinical benefit.” “The only thing that would really change is if there had been an imaging study—and it would have changed it, not by how you responded to the catheterization, but by not doing the catheterization at all” [47].
Invasive FFR Versus Non-invasive Coronary Flow Reserve and Stress Flow
Despite its major conceptual value in moving cardiology toward physiologically guided revascularization, a limitation of FFR as the principle guide to revascularization procedures in USA may be coronary flow physiology itself. FFR is a pressure derived surrogate for relative coronary flow reserve [20, 41]. It does not reflect absolute flow in cc/min/gm that determines ischemia. In experimental studies, low in cc/min/gm is the primary fundamental determinant of myocardial function and ischemia, not pressure, as illustrated in Fig. 12.13 [48].
Fig. 12.13
Experimental documentation that low coronary pressure does not cause myocardial ischemia if coronary flow is maintained (Adapted from Gould et al. [25])
Moreover, the discordance of FFR and Coronary Flow Reserve (CFR) reflects this same physiologic truth [49–51]. FFR may be low indicating a pressure gradient across a stenosis but CFR may be preserved with adequate flow capacity to prevent ischemia. This discordance between FFR and CFR occurs in 20 % of patients having FFR less than 0.8 but with CFR over 2.0 due to focal stenosis with no diffuse or small vessel disease in other arteries, thereby preserving high reference CFR, Fig. 12.14, orange area [49]. Therefore, for the broadest range of patients, the essential primary information for physiologically guided revascularization resides in both absolute stress perfusion in cc/min/gm and Coronary Flow Reserve.
Fig. 12.14
Schematic of discordance of FFR and coronary flow reserve (CFR) in clinical studies (Adapted from Johnson et al. [49])
Quantitative Myocardial Perfusion in cc/mi/gm and Coronary Flow Reserve
Coronary Flow Reserve requires measuring quantitative myocardial perfusion in cc/min/gm, currently best established by positron emission tomography in 250 unique papers incorporating 14,962 cases in the literature over 25 years. In the largest of these reports, 2,000 subjects, stress flow and CFR was categorized into three groups as follows:
(i)
Young healthy volunteers with average whole heart stress flow of 2.89 ± 0.5 cc/min/gm and CFR 4.17 ± 0.8 [52].
(ii)
Patients in whom stress perfusion in cc/min/gm and CFR were measured at the moment of angina and/or ECG changes during dipyridamole stress, Fig. 12.15 [50]. The low flow threshold causing ischemia manifest as angina and significant ECG changes is stress flow of 0.9 cc/min/gm and CFR of 1.7. The area under the curve (AUC) for the correlation of ischemia with this stress flow threshold is 0.98. A subset of these patients had myocardial steal with CFR below 1.0 indicating collateralization.
Fig. 12.15
Stress absolute myocardial perfusion in cc/min/gm and coronary flow reserve at the moment of angina and significant ECG changes during dipyridamole stress PET perfusion imaging (Adapted from Johnson and Gould [50])
(iii)
All other patients with risk factors, known CAD or diagnostic questions not fitting either of the above categories. This not-ischemic, not-normal group had whole heart CFR of 2.7 ± 0.9 indicating significant diffuse disease in addition to whatever localized stress defect was present due to localized flow limiting stenosis [51].
Therefore, non-invasive quantitative PET perfusion imaging provides definitive physiologic definition of disease severity in relation to proven low flow ischemic threshold as the basis for revascularization procedures while excluding unnecessary procedures in patients with adequate flow capacity above the low flow ischemic threshold.
Figure 12.16 illustrates how PET measures absolute myocardial perfusion [52]. Using our “simple model” validated experimentally [53], an early image of first pass arterial concentration is acquired in the first 2 min starting with iv injection of rubidium-82, the most widely used generator produced radionuclide. The myocardial image is acquired over the subsequent 5 min. The arterial input is determined by placing a small region of interest (ROI) over the arterial source of highest activity, usually the ascending aorta or left atrium. The arterial input and myocardial uptake are automatically entered into a flow model that corrects for partial volume loss and flow dependent radionuclide extraction for each pixel of each 90° or quartile view of the heart.
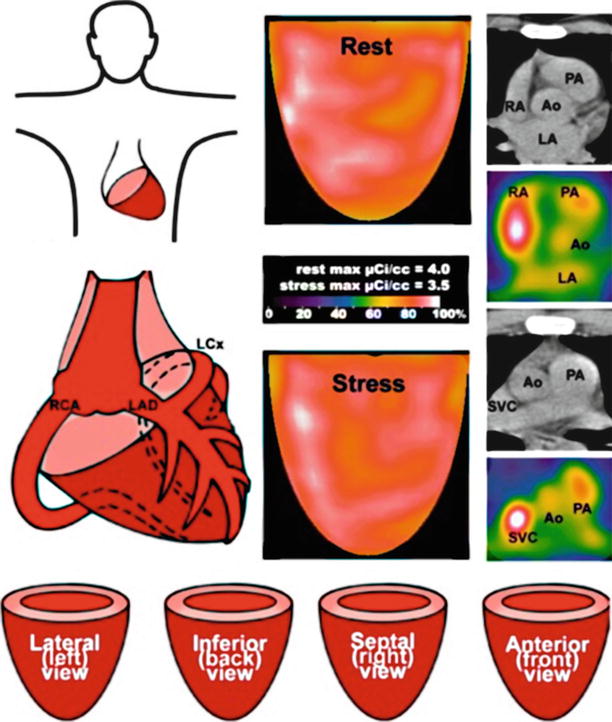
Fig. 12.16
Method for determining myocardial perfusion in cc/min/gm by PET in patients (Adapted from Sdringola et al. [52])
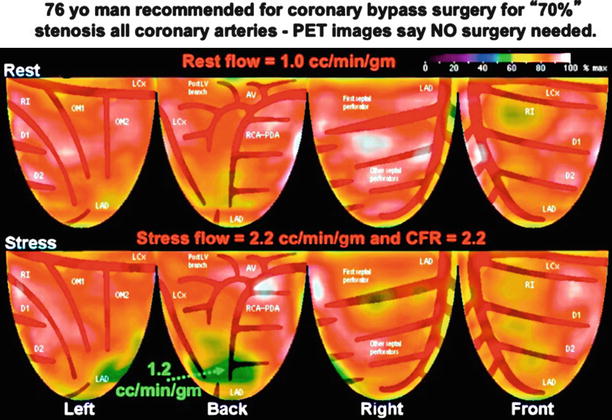
Figure 12.17 illustrates a clinical case in which quantitative perfusion resolved the question of “balanced” three vessel CAD in a 76 year old man as a second opinion on recommended bypass surgery for reported “70 %” stenosis of the three major coronary arteries on the arteriogram shown. The lower left inset shows an x-ray phantom of stenosis of known dimensions and the lower right inset shows another patient with a true severe flow limiting 80 % diameter stenosis for comparison to this patient’s arteriogram. PET showed excellent stress flow of 2.2 cc/min/gm and CFR of 2.2, both well above the ischemic threshold, confirming diffuse CAD but not flow limiting stenosis suitable for revascularization, Fig. 12.18. The small distal inferior green stress induced defect is characteristic of diffuse disease.
Fig. 12.17
Example of a second opinion case with disparity between visually estimated arteriogram severity, precise phantom cine view of known percent stenosis and a separate patient with proven severe stenosis. The PET scan for this case is shown in Fig. 12.18
Coronary Flow Map as Basis for Revascularization Decisions
Rest perfusion, stress perfusion and CFR are all three important for assessing disease severity. The rest images show myocardial scar or very low perfusion of hibernating myocardium or low flow due to low pressure rate product (PRP) as seen with beta blockers. Low stress flow thresholds of 0.9 cc/min/gm and CFR of 1.7 identify patients with myocardial ischemia. Reduced but adequate flow capacity with no ischemia may be due to adequate CFR associated with low rest flow despite limited stress flow in cc/min/gm, as commonly seen with beta blockers. Similarly, reduced but adequate flow capacity with no ischemia may be due to adequate stress flow in cc/min/gm despite low CFR caused by high resting flow.
Therefore, quantifying severity of coronary artery disease requires integrated analysis of both CFR and stress flow in cc/min/gm compared to low flow thresholds causing ischemia, illustrated conceptually in Fig. 12.19 [51]. Each pixel of the heart map of absolute CFR and stress flow in cc/min/gm is plotted on a graph color coded for the above ranges of flows – high flow of normal volunteers (red), intermediate flows divided into an upper (orange) and lower half (yellow), severe but not at ischemic threshold reflecting angina or ECG changes but not both (green), ischemic threshold or below (blue) or scar (black). Each color coded pixel is then mapped back to the heart image for a diagnostically definitive regional map of coronary flow capacity and size integrated with the ischemic threshold for potential revascularization.
Fig. 12.19
Schematic for integrated analysis of maximum stress flow in cc/min/gm and coronary flow reserve for assessing disease severity (From Gould et al. [25])
Figure 12.20 [51] illustrates the original PET relative rest-stress images, rest and stress flow, CFR, the stress flow-CFR scatter plot for each pixel and the coronary arteriogram. Relative uptake images show a small, distal septal non-transmural myocardial infarction (2 % of LV <60 % of maximum at rest) with a large stress-induced defect (20 % of LV <60 % at stress). Absolute flow images show a large area of reduced stress flow (50 % of the LV <2 cc/min/gm) and CFR (18 % of the LV with CFR < 2) in the septal and anterior quadrants. The scatter plot of CFR versus absolute stress flow demonstrates 14 % of the LV with moderately to severely reduced coronary flow capacity consistent with ischemia.
Fig. 12.20
Case example of primary relative rest-stress PET images and the coronary flow capacity map integrating stress flow in cc/min/gm with coronary flow reserve and ischemic flow threshold (blue) compared with the arteriogram. (a) Relative uptake images, (b) Myocardial perfusion in cc/min/gm and Coronary Flow Reserve (CFR), (c) Plot of stress perfusion versus CFR to color code each pixel for Coronary Flow Capacity. (d) Coronary Flow Capacity Map with superimposed coronary arterial distribution (From Johnson and Gould [51])
The coronary flow map with superimposed and labeled arterial distributions localizes ischemic regions to the distribution of the second diagonal branch (D2) with a non-transmural scar (hashed grid) in the mid-to-distal septal quadrant. Invasive angiography demonstrates diffuse but non-obstructive disease in the left anterior descending (LAD) artery with a distal fractional flow reserve (FFR) of 0.83 (orange arrowhead) during intravenous adenosine infusion and no focal gradient on pullback. However, the saphenous vein graft (SVG, upper right inset in solid white box) to D2 (dual-headed, solid, dark blue arrow) is closed and D2 (large, dark blue arrowheads) fills by collaterals (small red arrows) from the LAD (lower right inset in dashed white box). Dual-headed, solid arrows compare regions on the flow map to corresponding regions on the angiogram.
The coronary flow map in Fig. 12.20 allows effortless distinction between a distal septal non-transmural myocardial infarction and occlusion of the SVG to a diagonal branch compared to the relative uptake and absolute flow maps that make this inference more difficult. FFR confirmed preserved flow capacity in the distribution of the LAD itself, while collaterals sufficient to avoid myocardial steal during hyperemia supply the D2 branch whose vein graft had occluded.
Coronary Flow Maps – The Range of CAD: Stenosis, Diffuse, Mixed
Figure 12.21 shows the range of coronary flow maps in a normal volunteer, in different patients with mild or moderate diffuse without localized stenosis and in a patient with a severe proximal LAD stenosis with stress flow and CFR below the ischemic threshold appropriate fro revascularization. In Fig. 12.22 of another patient with mild chest pain, the coronary flow capacity maps show the size as well as severity of severe flow limiting stenosis in color coded percent of the heart image before and after stenting of severe Right Coronary stenosis. After a successful stent, diffuse CAD remains that reduces coronary flow capacity diffusely mildly to moderately in the color coded ranges and percent of the heart for each range of flows. Figures 12.23, 12.24, 12.25, and 12.26 [54] illustrate detailed perfusion “anatomy” provided by PET a guide to specific regions needing revascularization.
Fig. 12.21
Coronary flow capacity maps for four separate subjects – (i) healthy young volunteer (ii) patient with early diffuse coronary atherosclerosis that minimally limits coronary flow capacity (iii) patient with mild diffuse CAD that reduces coronary flow capacity more but not to ischemic threshold (iv) patient with segmental stenosis that reduces flow capacity to below ischemic threshold (blue) with surrounding areas with good flow capacity
Fig. 12.22
Case example of coronary flow map with a severe large stress induced defect leading to arteriogram and stent with follow-up coronary flow map showing residual diffuse disease that mildly reduces coronary flow reserve throughout the heart (Adapted from Gould et al. [25])
Fig. 12.23
Examples of myocardial perfusion PET images with flow limiting stenosis in arterial distribution of the LAD and or its diagonal branches
Fig. 12.24
Examples of myocardial perfusion PET images with flow limiting stenosis in diagonal branches of the LAD or Ramus Intermedius coronary arteries
Fig. 12.25
Examples of myocardial perfusion PET images with flow limiting stenosis in arterial distribution of the Left Circumflex coronary artery or its Obtuse Marginal branches
Fig. 12.26
Examples of myocardial perfusion PET images with flow limiting stenosis in arterial distribution of the inferior or posterior coronary circulation
Flow Guided Management of CAD
Figures 12.27 and 12.28 summarize PET guided management of CAD by medical treatment with re-vascularization as indicated by quantitative myocardial perfusion. Survival curves in the left panel are from our non-randomized pilot study of intense lifestyle-pharmacologic treatment with PET guided revascularization as needed [55]. The right panel shows better survival for PCI based on FFR as a relative surrogate for relative coronary flow reserve compared to PCI based on the arteriogram [17].