Location of aortic valve calcium (AVC) can be better visualized on contrast-enhanced multidetector row computed tomography. The present evaluation examined whether AVC severity and its location could influence paravalvular aortic regurgitation (AR) after transcatheter aortic valve implantation. A total of 79 patients (age 80 ± 7 years, 49% men) with preprocedural multidetector row computed tomography were included. Volumetric AVC quantification and its location were assessed. Transesophageal echocardiography was performed to assess the presence and site of AR after transcatheter aortic valve implantation. Receiver operating characteristic curves were generated to evaluate the usefulness of AVC in determining paravalvular AR at a specific site. Postprocedural AR of grade 1 or more was observed in 63 patients. In most patients (n = 56, 71%), AR was of paravalvular origin. Calcium at the aortic wall of each valve cusp had the largest area under the curve (0.93, p <0.001) in predicting paravalvular AR at the aortic wall site compared to calcium at the valvular edge or body (area under the curve 0.58 and 0.67, respectively). Calcium at the valvular commissure was better than calcium at the valvular edge (area under the curve 0.94 vs 0.71) in predicting paravavular AR originating from the corresponding commissure. In conclusion, contrast-enhanced multidetector row computed tomography can be performed to quantify AVC. Both AVC severity and its exact location are important in determining paravalvular AR after transcatheter aortic valve implantation.
Multidetector row computed tomography (MDCT) allows visualization of the precise location of aortic valve calcium (AVC). The present evaluation aimed to determine whether the severity and location of AVC would influence the occurrence and location of paravalvular aortic regurgitation (AR) after transcatheter aortic valve implantation (TAVI).
Methods
A total of 79 patients with symptomatic, severe aortic stenosis (AS) who underwent MDCT before TAVI were included. The patients with bicuspid aortic valves or failing bioprosthetic valves (valve-in-valve) and those who did not eventually receive TAVI were excluded. An Edwards-Sapien device (Edwards Lifesciences, Irvine, California) was implanted in all patients using either the transfemoral or transapical approach.
According to the institutional protocol, all patients underwent a detailed clinical evaluation and preoperative transthoracic echocardiography to examine AS severity, valve morphology, and left ventricular (LV) function. Preoperative multidetector row computed tomographic scans were also performed to assess the aortic valve and aortic root and the extent and distribution of AVC. Transesophageal echocardiography (TEE) was performed intraprocedurally and to evaluate the function of the prosthesis immediately after valve deployment, including the assessment of the AR location, if present. The clinical, echocardiographic, and multidetector row computed tomographic data were prospectively collected in an electronic patient dossier (EPD Vision, version 8.3.3.6, Leiden, The Netherlands) and retrospectively analyzed.
The patients underwent imaging preoperatively using a commercially available ultrasound system (Vingmed Vivid-7, General Electric Vingmed, Horten, Norway). A complete 2-dimensional, color, pulsed, and continuous-wave Doppler echocardiographic examination was performed. The LV end-diastolic volume and end-systolic volume were measured (indexed to the body surface area), and the LV ejection fraction was derived using biplane Simpson’s method. Aortic valve morphology was evaluated using the parasternal short-axis view, and the valve area was determined by the continuity equation. The peak and mean transaortic pressure gradients were calculated. AR was assessed using color Doppler after optimizing the gain and Nyquist limit, and its severity was assessed.
All patients underwent preoperative evaluation of the aortic valve and aortic root with either a 64-detector or 320-detector row computed tomography scanner (Aquilion 64 and Aquilion ONE, respectively, Toshiba Medical Systems, Otawara, Japan). The acquisition protocols of the multidetector row computed tomographic data for the Aquilion 64 and Aquilion ONE have been previously described. Before each scan, the patients with a heart rate greater than the threshold of 65 beats/min received oral β blockers (50 to 100 mg metoprolol), unless contraindicated. All multidetector row computed tomographic scans were acquired during midinspiratory breath-hold. To synchronize the arrival of the contrast media, bolus arrival was detected using a real-time bolus tracking technique with a threshold of +180 Hounsfield units. All the multidetector row computed tomographic data sets were recorded and stored for postprocessing.
The assessment of AVC was performed using the diastolic images, at 75% of the RR interval of the contrast-enhanced multidetector row computed tomographic scans. The region of interest on the aortic valve, from which AVC quantification was performed, included (from proximal to distal) the LV outflow tract, aortic annulus, valvular cusps, and the adjacent aortic walls (until the level before the appearance of coronary ostium distally on the double oblique transverse view). Mitral annular calcification and atherosclerosis of the upper aortic root (distal to the coronary ostia level) were excluded from AVC quantification. AVC was measured quantitatively using a novel automated data postprocessing software (3mensio Valve, version 4.1.sp2, 3mensio Medical Imaging BV, Bilthoven, The Netherlands). An empiric threshold of ≥800 Hounsfield units was used to detect areas of calcium in the region of interest, because the luminal contrast enhancement ranged from 250 to 760 Hounsfield units. As previously reported, calcium quantification using the Agatston score requires a nonlinear weighting factor in its derivation and thus has been shown to exhibit greater variability than the volumetric quantification of calcium. Accordingly, we quantified AVC in cubic millimeters instead of using the Agatston score.
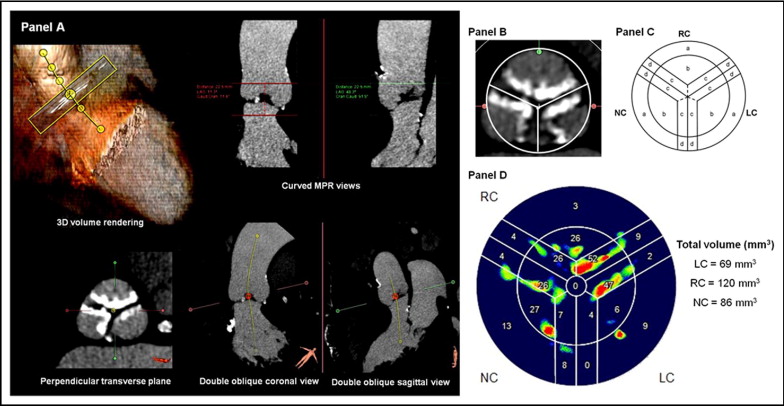
First, from the 3 multiplanar reformation (MPR) planes and the 3-dimensional reconstruction, the aortic root was automatically segmented and a center line crossing the aortic lumen displayed ( Figure 1 ) . The center line and the perpendicular MPR plane were manually adjusted to improve accuracy using the aortic cusps as a guide, whereby the 2 orthogonal MPR planes would bisect the long axis of the aortic cusps in parallel, and a third perpendicular transverse plane would bisect the 3 aortic cusps. The true transverse plane should be seen to bisect the aortic cusps equally, permitting visualization of the insertion points of all 3 aortic cusps at the level of the aortic annulus. Subsequently, by adjusting the level of the transverse plane, the center line should sit in the center of the 3 aortic cusps at the level of aortic sinus ( Figure 1 ). Next, the software automatically displayed the true short axis of the aortic valve in the transverse MPR view ( Figure 1 ). Then, the additional 2 orthogonal curved MPR views were used to define the region of interest (from the LV outflow tract level to the level before the appearance of the coronary ostium). The software then automatically provided AVC quantification and the exact location of calcium ( Figure 1 ). Six locations of calcium were identified on each cusp ( Figure 1 ), and the respective AVC could be quantified in cubic millimeters ( Figure 1 ).
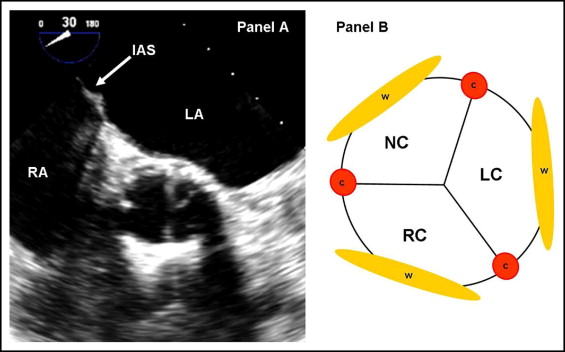
Immediately after prosthesis deployment, the short- and long-axis views of TEE were used to assess the presence of AR and its severity and sites (origins of leak). The severity of AR was assessed qualitatively using color Doppler flow imaging and the maximal jet width at its origin from the prosthesis. AR was graded as follows: 0, absent; 1, trace and mild; 2, mild-to-moderate; 3, moderate-to-severe; and 4, severe. In addition, AR was classified as paravalvular or intravalvular, or both. To determine the exact site of origin of paravalvular AR, a short-axis view (30° to 60°) at the level of the proximal (ventricular) end of the implanted prosthesis was used. Accordingly, 6 sites of paravalvular AR were identified using the interatrial septum as a landmark, which helped to identify the noncoronary cusp ( Figure 2 ) .
Continuous variables are presented as the mean ± SD or SEM and categorical variables as percentages. Comparisons between patients with and without paravalvular AR after TAVI were performed using unpaired Student’s t tests (for continuous variables) and the chi-square or Fisher exact test (for categorical variables). To relate the locations of AVC with the sites of paravalvular AR after TAVI using TEE, the locations of AVC with their respective sites of paravalvular AR were matched. Receiver operating characteristic curves were subsequently generated to evaluate the predictive value of the AVC volume in determining paravalvular AR at a specific site. All statistical analyses were performed with the Statistical Package for Social Sciences, version 16.0 (SPSS, Chicago, Illinois). A p value <0.05 was considered statistically significant.
Results
The baseline clinical and echocardiographic characteristics of the study population are presented in Tables 1 and 2 . The transfemoral approach was performed in 36 patients (46%), and the transapical approach in 43. In terms of prosthesis size, 62 patients (78%) received a 26-mm valve and 37 a 23-mm valve. The baseline measurements of the total volume of AVC and volume of calcium on each location of the aortic cusp are listed in Table 3 . Because the valvular commissures or valvular free edges were closely related to each other on 2 apposing cusps ( Figure 1 ), they were considered as a unit when AVC was concerned. Hence, the amount of calcium on the valvular commissures or free edges was the summation of their respective volume of calcium on the 2 associated cusps.
| Variable | All (n = 79) | Paravalvular AR (n = 56) | No Paravalvular AR (n = 23) | p Value |
|---|---|---|---|---|
| Men | 39 (49%) | 30 (54%) | 9 (39%) | 0.32 |
| Age (years) | 80 ± 7 | 80 ± 7 | 81 ± 6 | 0.54 |
| Body mass index (kg/m 2 ) | 25.5 ± 4.6 | 24.9 ± 3.0 | 26.8 ± 7.0 | 0.22 |
| Body surface area (m 2 ) | 1.82 ± 0.19 | 1.84 ± 0.17 | 1.78 ± 0.22 | 0.18 |
| Logistic EuroSCORE (%) | 23 ± 13 | 23 ± 12 | 21 ± 14 | 0.44 |
| Hypertension | 46 (58%) | 32 (57%) | 14 (61%) | 0.81 |
| Hypercholesterolemia | 33 (42%) | 21 (38%) | 12 (52%) | 0.32 |
| Diabetes mellitus | 22 (28%) | 18 (32%) | 4 (17%) | 0.27 |
| Peripheral vascular disease | 23 (29%) | 16 (29%) | 7 (30%) | 1.00 |
| Previous myocardial infarction | 19 (24%) | 13 (23%) | 6 (26%) | 0.78 |
| Previous coronary artery bypass | 31 (39%) | 24 (43%) | 7 (30%) | 0.45 |
| Variable | All (n = 79) | Paravalvular AR (n = 56) | No Paravalvular AR (n = 23) | p Value |
|---|---|---|---|---|
| Left ventricular end-diastolic volume (ml/m 2 ) | 67 ± 26 | 70 ± 27 | 58 ± 21 | 0.06 |
| Left ventricular end-systolic volume (ml/m 2 ) | 35 ± 23 | 37 ± 24 | 30 ± 22 | 0.18 |
| Left ventricular ejection fraction (%) | 52 ± 12 | 51 ± 14 | 54 ± 15 | 0.39 |
| Mean transaortic gradient (mm Hg) | 40 ± 14 | 38 ± 16 | 38 ± 12 | 0.94 |
| Peak transaortic gradient (mm Hg) | 61 ± 22 | 62 ± 24 | 60 ± 17 | 0.79 |
| Aortic valve area (cm 2 ) | 0.74 ± 0.18 | 0.76 ± 0.18 | 0.69 ± 0.18 | 0.15 |
| Aortic regurgitation | ||||
| None | 18 (23%) | 11 (20%) | 7 (30%) | 0.61 |
| Mild | 48 (61%) | 35 (63%) | 13 (57%) | |
| Moderate | 13 (16%) | 10 (17%) | 3 (13%) | |
| Severe | 0 | 0 | 0 |
| Variable | Paravalvular AR (n = 56) | No Paravalvular AR (n = 23) | p Value |
|---|---|---|---|
| Total calcium volume (mm 3 ) | 367.1 ± 35.9 | 222.3 ± 43.3 | 0.023* |
| Calcium on left cusp (mm 3 ) | 105.4 ± 14.3 | 40.6 ± 10.5 | 0.007* |
| Calcium on right cusp (mm 3 ) | 102.2 ± 13.1 | 61.9 ± 77.3 | 0.082 |
| Calcium on noncoronary cusp (mm 3 ) | 160.2 ± 16.6 | 95.9 ± 19.3 | 0.028* |
| Calcium on wall of left cusp (mm 3 ) | 28.6 ± 3.5 | 10.8 ± 5.4 | 0.008* |
| Calcium on wall of right cusp (mm 3 ) | 25.0 ± 4.7 | 11.5 ± 7.1 | 0.12 |
| Calcium on wall of noncoronary cusp (mm 3 ) | 46.1 ± 6.1 | 19.0 ± 11.9 | 0.029* |
| Calcium on edge of left cusp (mm 3 ) | 33.3 ± 5.9 | 15.6 ± 5.6 | 0.076 |
| Calcium on edge of right cusp (mm 3 ) | 37.7 ± 5.7 | 25.6 ± 5.8 | 0.21 |
| Calcium on edge of noncoronary cusp (mm 3 ) | 42.7 ± 7.0 | 33.0 ± 7.5 | 0.42 |
| Calcium on body of left cusp (mm 3 ) | 29.2 ± 6.1 | 10.6 ± 2.9 | 0.060 |
| Calcium on body of right cusp (mm 3 ) | 23.8 ± 5.0 | 13.2 ± 4.5 | 0.20 |
| Calcium on body of noncoronary cusp (mm 3 ) | 54.7 ± 7.3 | 34.8 ± 7.8 | 0.11 |
| Calcium on left–right commissure (mm 3 ) | 13.4 ± 2.2 | 2.8 ± 1.1 | 0.003* |
| Calcium on left–noncoronary commissure (mm 3 ) | 9.8 ± 2.7 | 1.2 ± 0.6 | 0.050 |
| Calcium on right–noncoronary commissure (mm 3 ) | 12.5 ± 2.5 | 6.1 ± 1.8 | 0.11 |
| Calcium on left–right edge (mm 3 ) | 36.1 ± 6.6 | 20.0 ± 5.9 | 0.15 |
| Calcium on left–noncoronary edge (mm 3 ) | 40.5 ± 6.4 | 23.3 ± 4.0 | 0.098 |
| Calcium on right–noncoronary edge (mm 3 ) | 37.2 ± 5.7 | 30.8 ± 8.4 | 0.54 |
Stay updated, free articles. Join our Telegram channel

Full access? Get Clinical Tree


