The frequency of very late stent thrombosis (VLST) up to 3 years after sirolimus-eluting stent implantation is 0.5% to 0.6%/year but incertitude remains about the frequency of VLAST after 3 years. Diabetic (db+) and nondiabetic (db−) patients with or without multiple diseased vessels included in the EVASTENT matched-cohort registry were followed up to 6 years after stent implantation. Long-term follow-up was obtained for 1,564 of the 1,731 included patients. All-cause deaths (including cancer and complications of diabetes) occurred at steady rates of 2.5%/year up to 3 years and 1.2%/year after 3 years (difference not significant). In contrast, VLST (any Academic Research Consortium definition) was only 0.18%/year (95% confidence interval 0.08 to 0.39) after 3 years versus 0.63%/year (confidence interval 0.41 to 0.98) from 1 year to 3 years (p = 0.03). Target lesion revascularization rates were also lower after 3 years than before 3 years (1.9% vs 7%, p ≤0.01) with 66% of revascularization procedures after 3 years being for nontarget lesions. Six-year all-cause death and cardiac death cumulative rates were higher in db+ than in db− patients. However, after 3 years compared to before 3 years, no differences between db+ and db− patients were observed for target lesion revascularization and ST rates. It is noteworthy that 51% of patients continued to be on clopidogrel therapy nearly 6 years after receiving ≥1 sirolimus-eluting stent. In conclusion, all-cause deaths continued at a steady rate over 6 years. However, cardiac deaths and “very” VLST leveled out beyond 3 years.
Since the widespread introduction of the first generation of drug-eluting stents in 2002, safety concerns have been raised about the occurrence of late or very late stent thrombosis (VLST). Reassuring meta-analyses have been published from randomized trials comparing drug-eluting stents to bare-metal stents (BMSs). These have shown that drug-eluting stents decrease angiographic restenosis and the clinical need for repeat revascularization procedures, and similar rates of death and myocardial infarction have been observed for patients treated with a drug-eluting stent or a BMS during long-term 4-year follow-up. However, a small excess of VLST in patients with drug-eluting stent compared to BMS with a constant slope of 0.4% to 0.6% of definite and probable ST per year has been observed. Very long-term follow-up data have been reported for real-world registry patients but incertitude remains about the exact frequencies of VLST. The EVAluation of Active STENT (EVASTENT) registry was prospectively planned for a 3-year follow-up, which was extended to ≥5 years. The aim of the present study was to answer the question: how often does VLST occur beyond 3 years after implantation of ≥1 sirolimus-eluting stent (SES)? We followed diabetic (db+) and nondiabetic (db−) patients included in the EVASTENT matched-cohort registry at around 6 years as recommended by international authorities.
Methods
The design of the EVASTENT study, an independent matched cohort registry, has been described in detail in a previous publication. Briefly, for each eligible db+ patient included by a center (stratified to single-vessel disease or multivessel disease groups) a db− patient was subsequently included, leading to 4 separate groups of patients (db+ and single-vessel disease, db+ and multivessel disease, db− and single-vessel disease, db− and multivessel disease). All patients had signed an informed consent form. Dual antiplatelet treatment with aspirin plus clopidogrel was required for ≥3 months and recommended for 1 year. Patients, their cardiologists, their primary care physicians, and/or their local interventional cardiology units were contacted at 6 years after implantation of ≥1 SES in the context of the EVASTENT study. Patients had been contacted previously after 12 and 36 months. For this study patients were contacted ≥5 years after inclusion (median 5.6) by sending a questionnaire and/or contacting the primary care physician or cardiologist. Extensive inquiries were made to obtain documentation on the cause of any death and on any hospitalization involving myocardial infarction and/or suspected ST. ST was defined as “definite,” “probable,” or “possible” according to the Academic Research Consortium after agreement of members of the critical events committee. After each serious adverse event, queries were sent to the investigator to obtain a detailed report (hospital medical files, information from the primary care physician and/or cardiologist including angiograms to be sent and reviewed when useful). Adjudication of each serious adverse event by the critical events committee composed of 5 senior cardiologists was performed in plenary session by completing a specific form. We also recorded data about antiplatelet therapy (aspirin or clopidogrel) and any new revascularizations and whether these concerned the target stent. A new revascularization was defined as revascularization of the lesion originally treated or nontarget lesion revascularization. Renal failure was defined as creatinine >150 μmol/L or Cockcroft creatinine clearance <35 ml/min. Diabetes was defined by known history of type 1 or 2 diabetes mellitus for ≥3 months requiring medical therapy with oral antidiabetic agents and/or insulin.
The study complied with the Declaration of Helsinki and the long-term follow-up protocol was approved by the local ethics committee on December 31, 2008.
Discrete data are reported as number (frequency) and continuous data as mean ± SD when normal distribution was not rejected. Data comparisons were performed using unpaired Student’s t test and Pearson chi-square test. Kaplan–Meier survival curves were computed for the occurrence of events with landmark analysis of 3- to 6-year follow-up. The second part of the landmark analysis included only a cohort of patients with follow-up beyond 3 years. A mid-p exact test was performed for comparison of survival curves after and before 3 years. Log-rank test was used for comparison of survival curves. Univariate analyses were performed using unadjusted values. Variables presented in Table 1 , ejection fraction, and off-label use were included in univariate analysis. All these parameters were integrated in multivariate analysis. Stepwise Cox regression proportional hazard model with forward selection was performed to assess independent predictors of death or ST. Statistical analysis was performed with STATA 11.1 (STATA Corporation LP, College Station, Texas). All safety and efficacy data were analyzed independently in the clinical research center in Grenoble.
| Variable | SVD db+ (n = 488) | MVD db+ (n = 356) | SVD db− (n = 513) | MVD db− (n = 374) | db+ vs db− | SVD vs MVD |
|---|---|---|---|---|---|---|
| Age (years) | 64.4 ± 10.0 | 63.8 ± 9.7 | 58.5 ± 11.5 | 61.5 ± 11.4 | ≤0.001 | 0.0357 |
| Women | 146 (29.9%) | 114 (32.0%) | 115 (22.4%) | 65 (17.4%) | ≤0.001 | 0.464 |
| Obese (body mass index >30 kg/m 2 ) | 126 (26.3%) | 109 (31.0%) | 61 (12.1%) | 58 (15.9%) | ≤0.001 | 0.034 |
| Active smokers | 70 (20.2%) | 64 (26.0%) | 129 (37.1%) | 94 (37.1%) | ≤0.001 | 0.238 |
| Hypertension | 302 (61.9%) | 247 (69.4%) | 210 (41.2%) | 170 (45.6%) | ≤0.001 | 0.015 |
| Dyslipidemia (%) | 295 (60.5%) | 220 (61.8%) | 324 (63.5%) | 246 (66.0%) | 0.129 | 0.420 |
| Familial history of coronary artery disease | 107 (21.9%) | 87 (24.4%) | 173 (33.7%) | 144 (38.5%) | ≤0.001 | 0.098 |
| Renal failure | 38 (7.8%) | 36 (10.1%) | 17 (3.3%) | 21 (5.7%) | ≤0.001 | 0.052 |
| Q-wave myocardial infarction | 39 (8.9%) | 44 (13.9%) | 83 (17.6%) | 55 (16.3%) | 0.001 | 0.337 |
| Non–Q-wave myocardial infarction | 31 (6.4%) | 19 (5.4%) | 24 (4.7%) | 20 (5.4%) | 0.385 | 0.891 |
| Previous percutaneous coronary intervention | 120 (24.6%) | 90 (25.3%) | 189 (36.8%) | 112 (30.0%) | ≤0.001 | 0.150 |
| Previous coronary artery bypass grafting | 32 (6.6%) | 16 (4.5%) | 25 (4.9%) | 27 (7.2%) | 0.876 | 0.863 |
| Previous stroke | 22 (4.5%) | 15 (4.2%) | 7 (1.4%) | 3 (0.8%) | ≤0.001 | 0.586 |
| Myocardial infarction at inclusion | 50 (10.3%) | 41 (11.5%) | 65 (12.7%) | 61 (16.3%) | 0.032 | 0.123 |
| ≥1 stent >15 mm in length | 353 (73.2%) | 327 (92.6%) | 386 (75.7%) | 345 (92.7%) | 0.435 | ≤0.001 |
| Nominal stent diameter >3 mm | 275 (57.1%) | 251 (71.1%) | 334 (65.5%) | 284 (76.3%) | 0.002 | ≤0.001 |
| Total length stented | 22.2 ± 11.6 | 41.0 ± 21.2 | 23.3 ± 12.4 | 40.0 ± 20.6 | 0.5125 | ≤0.001 |
| Calcified lesion | 190 (39.1%) | 188 (52.8%) | 144 (28.1%) | 168 (44.9%) | ≤0.001 | ≤0.001 |
Results
From January 2003 through November 2004 1,731 patients were included in the EVASTENT matched-cohort registry. There was no difference for clinical baseline data between patients with single-vessel disease and those with multivessel disease, whereas db+ patients were significantly older, more often women, more often overweight, and with previous stroke or renal failure ( Table 1 ). Failure to achieve complete revascularization with a drug-eluting stent was observed in 25% of patients with multivessel disease (average 2.3 SESs per patient).
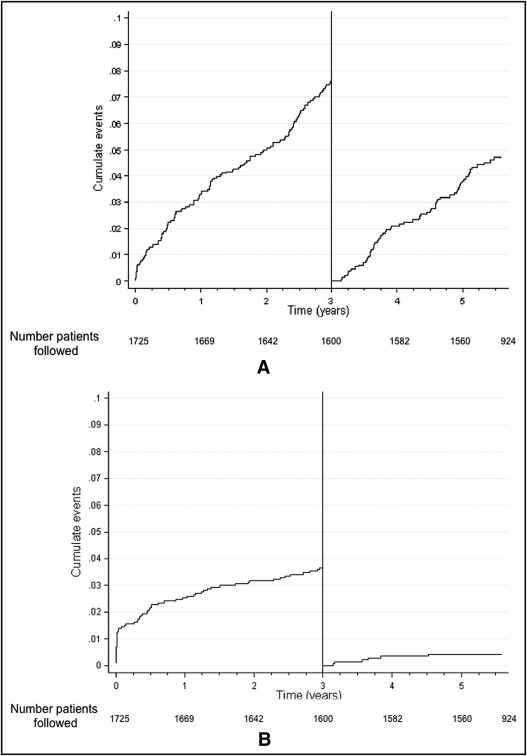
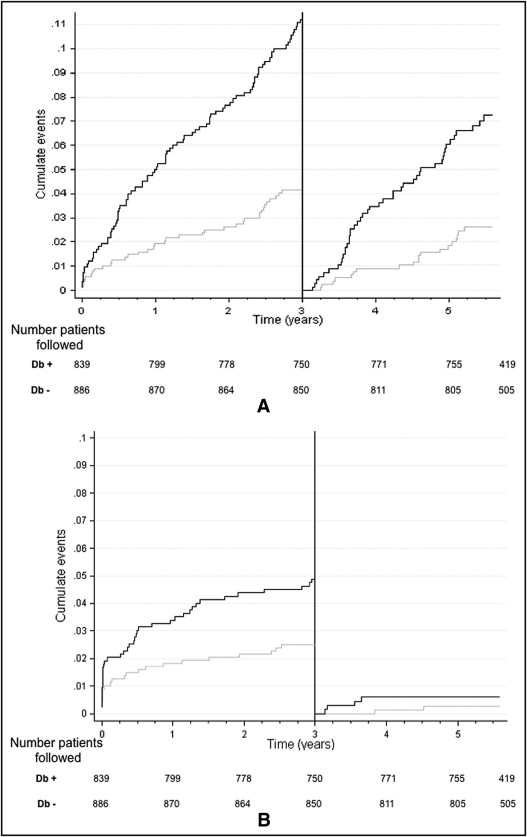
Cumulative numbers of patients lost to follow-up were 6, 15, 67, and 171 patients at baseline, 1 year, and 3 years, respectively. The 3-year and last follow-up rates were 96% and 91%, respectively. EVASTENT used multiple source inquires to achieve a high level of follow-up. Five percent of patients were lost to follow-up after 3 years, mostly because these patients had moved to another region or returned to their country of origin at retirement. Cumulative rates for death by any cause and for ST (using any Academic Research Consortium definition) were 11.4% and 4%, respectively. Four patients died from stroke, 1 with definite intracranial hemorrhage and 3 for which the type of stroke was not defined. Figure 1 shows the progression of all-cause death and ST (any Academic Research Consortium definition) with landmark analysis of 3- to 6-year follow-up. All-cause deaths continued at a steady rate before and beyond 3 years with 2.5%/year (95% confidence interval [CI] 2.1 to 3.0) for 0 year to 3 years and 1.2%/year (95% CI 1.5 to 2.4) beyond 3 years (p = NS). In contrast to the observed slope of 0.63%/year (CI 0.41 to 0.98) from 1 year to 3 years for ST (any Academic Research Consortium definition), >3 years after the index SES implantation a lower slope of 0.18%/year (95% CI 0.08 to 0.39) was observed, which was significantly different from that before 3 years (p = 0.03). Figure 2 shows Kaplan–Meier curves comparing db+ to db− patients for all-cause deaths and ST (any Academic Research Consortium definition) using landmark analysis of 3- to 6-year follow-up. The 6-year all-cause death cumulative rate was significantly higher in db+ patients than in db− patients (16.8% vs 6.4%, p ≤0.001). Table 2 presents the number of STs according to Academic Research Consortium definitions at different time points. Before 3 years the ST rate was higher in db+ patients than in db− patients with a significant difference (4.62 vs 2.48, p ≤0.01); however, there was no significant difference between db+ and db− patients after 3 years (0.5% vs 0.35%, p = NS). The db+ patients with multivessel disease presented the highest rate of ST, but even in this high-risk group a plateau was noted beyond 3 years. From 3 to 6 years 64 patients (4.2%) died, although only 16 of these deaths were classified as cardiac deaths. We found that 51% of patients continued to be on clopidogrel therapy at about 6 years after receiving a SES.
| Academic Research Consortium Definition | First Year | 1 Year–3 Years | 3–6 Years |
|---|---|---|---|
| Definite stent thrombosis | 27 | 33 | 3 |
| Definite or probable stent thrombosis | 36 | 42 | 3 |
| Any Academic Research Consortium definition of stent thrombosis | 42 | 61 | 9 |
Univariate and multivariable analyses are presented in Table 3 . The same independent factors of ST noted in the 1-year analysis were also present at 3 and 6 years. Table 4 presents clinical characteristics of the 9 patients who developed VLST beyond 3 years. Six of 9 patients had possible ST according to Academic Research Consortium definitions. Only 3 definite STs were found in patients with myocardial infarction followed by coronary angiographic documentation (2 patients survived). Five of these patients were db+ (p = NS) and 4 presented multivessel disease. These patients had relatively preserved ejection fraction. None of the 9 patients had heavily calcified target lesions and total stent length at inclusion was only 28 mm on average. All patients except 1 were still on antiplatelet therapy (aspirin or clopidogrel) but only 1 of these 9 patients was still under dual antiplatelet therapy.
| HR | p Value | |
|---|---|---|
| Predictors of stent thrombosis by univariate analysis | ||
| Group vs single-vessel disease in nondiabetics | ||
| Multivessel disease in nondiabetics | 1.83 (0.80–4.18) | 0.149 |
| Single-vessel disease in diabetics | 2.19 (1.02–4.68) | 0.043 |
| Multivessel disease in diabetics | 3.68 (1.76–7.71) | 0.001 |
| Diabetic | 2.09 (1.26–3.46) | 0.004 |
| Renal failure | 3.48 (1.87–6.51) | ≤0.001 |
| Lower ejection fraction | 0.96 (0.94–0.98) | ≤0.001 |
| Calcified lesions | 2.04 (1.26–3.32) | 0.004 |
| Greater overall length of stent implanted | 1.017 (1.007–1.028) | 0.001 |
| Insulin-requiring diabetes | 2.22 (1.22–4.03) | 0.009 |
| Age | 1.01 (0.99–1.04) | 0.255 |
| Previous myocardial infarction | 1.73 (1.04–2.89) | 0.034 |
| Previous stroke | 3.07 (1.23–7.64) | 0.016 |
| Multivessel disease | 1.74 (1.07–2.81) | 0.025 |
| Off-label stenting | 1.78 (1.05–3.03) | 0.033 |
| Independent predictors of stent thrombosis | ||
| Lower ejection fraction | 0.96 (0.94–0.98) | p≤0.001 |
| Insulin-requiring diabetes | 2.09 (1.22–3.59) | 0.007 |
| Renal failure | 2.22 (1.12–4.40) | 0.006 |
| Calcified lesions | 1.76 (1.05–2.96) | 0.033 |
| Greater overall length of stent implanted | 1.013 (1.002–1.024) | 0.024 |
Stay updated, free articles. Join our Telegram channel

Full access? Get Clinical Tree


