The aim of this study was to evaluate the mode of death and hospitalizations in advanced heart failure (HF) patients with renal dysfunction and to examine the rate of concordance between events reported by the clinical events committee and site investigators (using case report forms) in the Second Follow-Up Serial Infusions of Nesiritide (FUSION II) trial. Little is known about the cause of death and hospitalization in patients with advanced HF. FUSION II was a randomized, double-blind, placebo-controlled trial evaluating outpatient nesiritide infusions versus placebo, with 911 patients with advanced HF (New York Heart Association class III or IV) and renal dysfunction enrolled. There were 151 deaths and 1,041 hospitalizations at 24 weeks. The clinical events committee classified events as cardiac, renal, cardiorenal, other or noncardiovascular, or unknown. Kappa statistics and McNemar tests were used to assess agreement (overall and by individual modes of death and hospitalization indications). In conclusion, the most common cause of death or hospitalization was cardiac related, with 70% of deaths and 60% of hospitalizations due to cardiac causes. There was 74% agreement (26% disagreement) on cardiac cause of death (κ = 0.40, McNemar p = 0.001) and 75% agreement (25% disagreement) between the investigators and the clinical events committee on cardiac classification for hospitalization (κ = 0.49, McNemar p <0.0001).
The Follow-Up Serial Infusions of Nesiritide (FUSION I) trial was a pilot study that evaluated the potential of outpatient, intermittent nesiritide infusions in patients with advanced heart failure (HF). Although the results were neutral, subgroup analysis showed lower rates of all-cause death and hospitalization and more days alive and out of the hospital for high-risk patients and patients with reduced renal function randomized to nesiritide than for patients randomized to standard care. The Second Follow-up Serial Infusions of Nesiritide (FUSION II) trial, designed to further evaluate nesiritide outpatient infusions in this population, was a randomized, double-blind, placebo-controlled trial evaluating nesiritide once or twice weekly versus placebo in patients with advanced HF (New York Heart Association class III or IV) and renal dysfunction. The clinical events committee (CEC) categorized events as cardiac (including HF), renal, cardiorenal, other or noncardiovascular, or unknown. We aimed to examine the mode of death or hospitalization in this advanced HF population with renal dysfunction and compare the CEC classifications of mode of death and reasons for hospitalization with site investigator classifications from the FUSION II trial.
Methods
The design and results of the FUSION II trial have been previously reported. FUSION II was a prospective, randomized, parallel, multicenter, double-blind, placebo-controlled trial in patients with advanced HF receiving appropriate standard background therapy. Patients with 2 recent HF hospitalizations, left ventricular ejection fractions <40%, and New York Heart Association class IV symptoms or New York Heart Association class III symptoms with creatinine clearance <60 ml/min were randomly assigned to receive nesiritide or matching placebo once or twice weekly for 12 weeks. All patients were treated to optimal goals with evidence-based medical or device therapy facilitated by careful disease management during the study. The primary end point was time to all-cause death or cardiovascular or renal hospitalization at 12 weeks. Enrollment began in April 2004 and ended in June 2006; follow-up ended in December 2006. The trial included patients from North America, Central America, South America, Australia, Russia, India, and the Pacific Rim. The protocol was reviewed and approved by the institutional review board at each participating institution. All participants provided written voluntary informed consent.
The CEC was organized through the Duke Clinical Research Institute. The CEC developed a charter, defined clinical end point events consistent with the protocol, developed algorithms to identify patients with suspected end point events from data in the case report forms (CRFs), worked with monitoring groups to collect supplemental medical records for event review, and adjudicated suspected clinical end point events. Events were adjudicated by 5 cardiologists blinded to treatment assignment. Events resulting in death or hospitalization were adjudicated according to prespecified criteria. The CEC classified deaths and hospitalizations as cardiac, renal, cardiorenal, other or noncardiovascular, or unknown. The cardiac category included HF causes. The definitions of prespecified criteria for classification of events are listed in the Appendix . A flowchart of the overall adjudication process is shown in the Appendix .
Each case was reviewed independently by 2 physicians blinded to treatment in the phase I review. The case was classified as resolved if the physicians agreed on the mode of death or hospitalization. Cases in which there was disagreement between the 2 physicians were forwarded to a second-level (phase II) review for adjudication by consensus of the full committee. The committee members were blinded to treatment and to the result of the phase I review. If necessary, physicians could request additional medical records to adjudicate a suspected event. If additional records were obtained, the case was reviewed again to ensure that decisions were based on similar documents. For quality assurance, 10% of the cases with agreement by the phase I physicians were reviewed in a blinded fashion by the phase II committee to determine whether there were any systematic inconsistencies with the phase I reviews.
Subject demographics were summarized as numbers and percentages for dichotomous variables or mean ± SD and medians (25th percentile, 75th percentile) for continuous variables. Continuous and ordinal variables were compared using Student’s t tests, and chi-square tests were used to calculate p values for comparisons. Percentage agreement was calculated by dividing the number of events with agreement by the total number of events. Free-marginal κ statistics were calculated to assess the overall rates of agreement. A series of 2 × 2 tables with κ and McNemar tests were conducted for each mode of death and hospitalization. The treatment effect for the trial’s primary end point of time to death or cardiovascular or renal hospitalization at 12 weeks was calculated using Cox proportional-hazards regression modeling for both CEC and CRF end point classification. Data were supplied by Ortho-McNeil Janssen Scientific Affairs (Raritan, New Jersey). Data analysis was performed jointly by the statistical groups at Ortho-McNeil Janssen Scientific Affairs with independent validation at the Duke Clinical Research Institute. Ortho-McNeil Janssen Scientific Affairs had no other role in any aspect of the study.
Results
The baseline characteristics are listed in Table 1 . Most of the clinical characteristics were similar between patients who died and those who survived, with similar age and gender, but those who died had lower baseline left ventricular ejection fractions (23% vs 25%), lower systolic and diastolic blood pressures, lower serum sodium, and higher blood urea nitrogen. Of note, those who died had higher baseline serum creatinine than those who survived (mean 1.8 vs 1.6 mg/dl). There were no important differences in concomitant medications at baseline, except higher use of angiotensin-receptor blockers in patients who survived (16% vs 7%) and higher use of loop diuretics in patients who died (86% vs 76%).
| Variable | Died (n = 151) | Survived (n = 769) | p Value ⁎ |
|---|---|---|---|
| Age (years) | 66 ± 13 (67 [58, 76]) | 65 ± 13 (65 [56, 75]) | 0.36 |
| Men | 116 (77%) | 535 (70%) | |
| Women | 35 (23%) | 234 (30%) | |
| White | 100 (66%) | 479 (62%) | |
| Black | 27 (18%) | 172 (22%) | |
| Asian | 13 (9%) | 46 (6%) | |
| Hispanic/other | 11 (7%) | 72 (9%) | |
| Weight (kg) | 80 ± 22 (78 [64, 90]) | 84 ± 23 (80 [68, 96]) | 0.06 |
| Ejection fraction (%) | 23 ± 8 (24 [18, 30]) | 25 ± 8 (25 [20, 31]) | 0.01 |
| New York Heart Association class | 0.07 | ||
| III | 60 (40%) | 366 (48%) | |
| IV | 90 (60%) | 395 (52%) | |
| Height (cm) | 171 ± 10 (173 [164, 178]) | 170 ± 11 (170 [163, 178]) | 0.49 |
| Systolic blood pressure (mm Hg) | 110 ± 18 (107 [96, 120]) | 117 ± 20 (113 [101, 128]) | <0.001 |
| Diastolic blood pressure (mm Hg) | 67 ± 12 (66 [60, 72]) | 69 ± 12 (69 [60, 77]) | 0.01 |
| Pulse (beats/min) | 78 ± 14 (74 [68, 87]) | 76 ± 13 (74 [68, 82]) | 0.16 |
| Hemoglobin (g/dl) | 12.4 ± 2.0 (12.3 [10.9, 13.8]) | 12.6 ± 1.9 (12.5 [11.2, 13.9]) | 0.25 |
| Sodium serum (mEq/L) | 137 ± 5 (137 [134, 141]) | 138 ± 4 (138 [136, 141]) | 0.001 |
| Urea nitrogen (mg/dl) | 46.3 ± 28.5 (37.9 [24.4, 62.0]) | 35.5 ± 20.9 (29.4 [21.0, 46.0]) | <0.001 |
| Creatinine serum (mg/dl) | 1.8 ± 0.7 (1.7 [1.2, 2.2]) | 1.6 ± 0.7 (1.4 [1.1, 1.9]) | <0.001 |
| Cause of heart failure | 0.06 | ||
| Ischemic | 86 (57%) | 500 (65%) | |
| Nonischemic | 65 (43%) | 269 (35%) | |
| Cardiac device | |||
| Implantable cardioverter-defibrillator | 65 (43%) | 292 (38%) | |
| Biventricular pacemaker | 45 (30%) | 174 (23%) | |
| Single- or dual-chamber pacemaker | 12 (8%) | 123 (16%) | |
| Co-morbidities | |||
| Cancer | 27 (18%) | 91 (12%) | |
| Diabetes mellitus | 75 (50%) | 389 (51%) | |
| Baseline medications | |||
| Angiotensin-converting enzyme inhibitors | 72 (48%) | 335 (44%) | 0.37 |
| β blockers | 100 (66%) | 480 (62%) | 0.41 |
| Angiotensin receptor blockers | 11 (7%) | 120 (16%) | 0.01 |
| Statins | 55 (36%) | 237 (31%) | 0.18 |
| Aldosterone antagonists | 62 (41%) | 276 (36%) | 0.23 |
| Loop diuretics | 130 (86%) | 582 (76%) | 0.01 |
⁎ Chi-square and Student’s t test p values were computed for categorical and numerical parameters, respectively.
There were 151 deaths in the study at 24 weeks, including 1 patient who did not receive treatment and was not included in the 911 patients used for the efficacy analyses at 12 weeks. Two patients died within a 5-day window of the 24-week end point and were used in generating the comparison of modes of death. There were no statistically significant differences in the risk for death between the nesiritide and placebo groups, as previously reported. In addition, there were no differences in the number of deaths or time to death between the CEC and site investigator reporting, and there was no difference in the primary end point of all-cause death or time to death or cardiovascular or renal hospitalization at 12 weeks using site investigator–determined events versus CEC-adjudicated events.
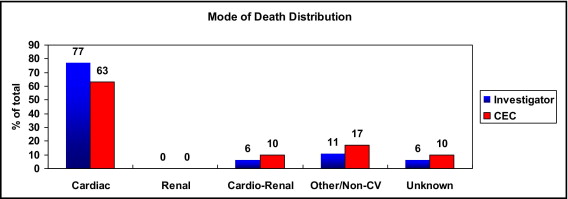
The distribution of mode of death is shown in Figure 1 . Most deaths were determined to be cardiac (63% by the CEC and 77% by site investigator assessment), followed by noncardiovascular as the second most common mode of death ( Table 2 ). No deaths were classified by either the CEC or site investigators as due only to renal causes.
| Variable | Investigator (CRF) Results (n = 151 Deaths, n = 1,041 Hospitalizations) | CEC-Adjudicated Results (n = 151 Deaths, n = 1,041 Hospitalizations) |
|---|---|---|
| Mode of death | ||
| Cardiac | 116 (77%) | 95 (63%) |
| Renal | 0 | 0 |
| Cardiorenal | 9 (6%) | 16 (10%) |
| Other or noncardiovascular | 16 (11%) | 25 (17%) |
| Unknown | 10 (6%) | 15 (10%) |
| Reasons for hospitalization | ||
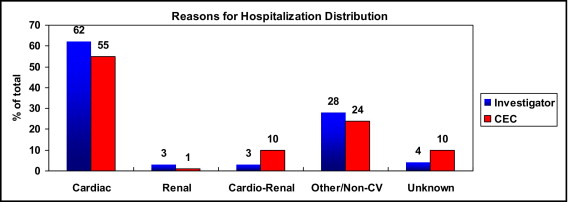
| Cardiac | 643 (62%) | 576 (55%) |
| Renal | 29 (3%) | 13 (1%) |
| Cardiorenal | 29 (3%) | 101 (10%) |
| Other or noncardiovascular | 290 (28%) | 252 (24%) |
| Unknown | 50 (4%) | 99 (10%) |
There were 1,041 hospitalization events in the 24-week study follow-up period. The distribution of mode of hospitalization is shown in Figure 2 . As with mode of death, most hospitalizations were determined by site investigators and the CEC to be cardiac related, followed by noncardiovascular, with 1% (CEC) of hospitalizations attributed to pure renal causes and approximately 10% (CEC) that could not be classified.
The rates of agreement and discordance between investigators and the CEC concerning cause of death on the basis of 2 × 2 tables for each mode are listed in Table 3 . There were differences in agreement between the investigators and the CEC for cardiac or noncardiovascular causes of death (McNemar p <0.001 and p = 0.04, respectively). The overall rate of agreement for all causes of death was 72% (κ = 0.65).
| Mode | % Agree | % Disagree | κ (95% CI) | McNemar ⁎ | Test κ = 0 † |
|---|---|---|---|---|---|
| Cardiac | 112 (74%) | 39 (26%) | 0.40 (0.25–0.55) | p = 0.001 | p <0.0001 |
| Cardiorenal | 136 (90%) | 15 (10%) | 0.35 (0.10–0.60) | p = 0.07 | p <0.0001 |
| Renal | 0 | 0 | — | — | — |
| Other or noncardiovascular | 132 (87%) | 19 (13%) | 0.47 (0.27–0.67) | p = 0.04 | p <0.0001 |
| Unknown | 140 (93%) | 11 (7%) | 0.52 (0.28–0.77) | p = 0.13 | p <0.0001 |
⁎ McNemar, p <0.05 indicates difference in agreement.
† Test null hypotheses κ = 0 (no agreement), p <0.05 reject null hypothesis = some agreement.
The agreement and discordance on reasons for hospitalization are listed in Table 4 . Overall, there was 67% agreement (κ = 0.59) on all categories of hospitalization. McNemar tests for each of the hospitalization categories using 2 × 2 tables indicated significant differences in agreement between the investigators and the CEC in all categories, with the most disagreement related to cardiac cause of death (25% disagreement). The level of agreement on the basis of κ statistics ranged from poor agreement for cardiorenal and unknown causes to good agreement for noncardiovascular causes (κ = 0.66, McNemar p = 0.001). There was moderate agreement on cardiac causes for hospitalization.
| Mode | % Agree | % Disagree | κ (95% CI) | McNemar ⁎ | Test κ = 0 † |
|---|---|---|---|---|---|
| Cardiac | 784 (75%) | 257 (25%) | 0.49 (0.44 to 0.55) | p <0.0001 | p <0.0001 |
| Cardiorenal | 927 (89%) | 114 (11%) | 0.08 (0.01 to 0.16) | p <0.0001 | p = 0.001 |
| Renal | 1,013 (97%) | 28 (3%) | 0.32 (0.14 to 0.51) | p = 0.003 | p <0.0001 |
| Other or noncardiovascular | 905 (87%) | 136 (13%) | 0.66 (0.61 to 0.71) | p = 0.001 | p <0.0001 |
| Unknown | 896 (86%) | 145 (14%) | −0.04 (−0.08 to −0.0002) | p <0.0001 | p = 0.17 |
⁎ McNemar, p <0.05 indicates difference in agreement.
† Test null hypotheses κ = 0 (no agreement), p <0.05 reject null hypothesis = some agreement.
The rates of agreement and discordance concerning mode of death by region of the world are listed in Tables 5 and 6 . There were more noncardiovascular deaths in the rest of the world than in North America (16% vs 5%, respectively), with similar rates of cardiac-related death of 55% and 58%, respectively. There was better agreement between investigators and the CEC in the rest of the world than in North America for mode of death. There were greater differences in agreement for cardiac and cardiorenal modes of death in North America. All modes of death that occurred in North America had fair interrater agreement between investigators and the CEC.
| Mode | % Agree | % Disagree | κ (95% CI) | McNemar ⁎ | Test κ = 0 † |
|---|---|---|---|---|---|
| Cardiac | 86 (72%) | 34 (28%) | 0.32 (0.15–0.49) | p = 0.002 | p = 0.0002 |
| Cardiorenal | 107 (89%) | 13 (11%) | 0.33 (0.06–0.60) | p = 0.05 | p = 0.0001 |
| Renal | 0 | 0 | — | — | — |
| Other or noncardiovascular | 104 (87%) | 16 (13%) | 0.36 (0.11–0.60) | p = 0.13 | p <0.0001 |
| Unknown | 109 (91%) | 11 (9%) | 0.38 (0.09–0.67) | p = 0.13 | p <0.0001 |
⁎ McNemar, p <0.05 indicates difference in agreement.
† Test null hypotheses κ = 0 (no agreement), p <0.05 reject null hypothesis = some agreement.
| Mode | % Agree | % Disagree | κ (95% CI) | McNemar ⁎ | Test κ = 0 † |
|---|---|---|---|---|---|
| Cardiac | 26 (84%) | 5 (16%) | 0.66 (0.39 to 0.93) | p = 0.18 | p = 0.0002 |
| Cardiorenal | 29 (94%) | 2 (6%) | 0.47 (−0.16 to 1.09) | p = 1.0 | p = 0.01 |
| Renal | 0 | 0 | — | — | — |
| Other or noncardiovascular | 28 (90%) | 3 (10%) | 0.71 (0.42 to 1.01) | p = 0.08 | p <0.0001 |
| Unknown | 31 (100%) | 0 (0%) | 1.0 (1.0 to 1.0) | — | p <0.0001 |
⁎ McNemar, p <0.05 indicates difference in agreement.
† Test null hypotheses κ = 0 (no agreement), p <0.05 reject null hypothesis = some agreement.
In contrast, none of the modes of death that occurred in the rest of the world had evidence of significant disagreement between investigators and the CEC. The rates of agreement were high at 84% for cardiac and 94% for cardiorenal causes of death. Degree of agreement ranged from fair to very good for the modes of death in the rest of the world.
The rates of agreement for mode of hospitalization also differed by region of the world ( Tables 7 and 8 ). There was no difference in agreement on cardiac reasons for hospitalization with 78% rate of agreement (McNemar p = 0.36) as well as noncardiovascular reasons for hospitalization. The degree of agreement in North America ranged from poor to good. With respect to the rest of the world, there were significant differences in agreement for cardiac reasons for hospitalization, with disagreement on 31% (McNemar p <0.001), as well as noncardiovascular and unknown causes for hospitalization, with disagreement on 17% and 37%, respectively (McNemar p <0.001). The degree of agreement concerning reasons for hospitalization for the rest of the world ranged from poor to fair.
| Mode | % Agree | % Disagree | κ (95% CI) | McNemar ⁎ | Test κ = 0 † |
|---|---|---|---|---|---|
| Cardiac | 600 (78%) | 174 (22%) | 0.53 (0.47 to 0.59) | p = 0.36 | p <0.0001 |
| Cardiorenal | 751 (97%) | 23 (3%) | 0.37 (0.16 to 0.57) | p = 0.01 | p <0.0001 |
| Renal | 678 (88%) | 96 (12%) | 0.10 (0.01 to 0.19) | p <0.0001 | p = 0.0004 |
| Other or noncardiovascular | 684 (88%) | 90 (12%) | 0.71 (0.66 to 0.77) | p = 0.83 | p <0.0001 |
| Unknown | 729 (94%) | 45 (6%) | −0.01 (−0.02 to 0.0004) | p <0.0001 | p = 0.68 |
Stay updated, free articles. Join our Telegram channel

Full access? Get Clinical Tree


