Impaired cardiac function is considered a contraindication for lung transplantation (LT). Because right ventricular (RV) function is expected to improve after LT, poor left ventricular (LV) function is often the determinant for LT eligibility. However, the changes in cardiac function before and after LT have not yet been elucidated. Therefore, we reviewed echocardiograms obtained from 67 recipients before and after LT. In a subset of 49 patients, both RV and LV longitudinal strains based on 2-dimensional speckle tracking echocardiography were analyzed. The cardiopulmonary exercise tests were also reviewed. All patients showed significant improvements in their exercise capacity after LT. RV echo parameters improved in all patients after LT (RV fractional area change: 36.7 ± 5.6% to 41.5 ± 2.7%, RV strain: −15.5 ± 2.9% to −18.0 ± 2.1%, RV E/E′: 8.4 ± 1.8 to 7.7 ± 1.8; all p <0.05). Overall, the left ventricular ejection fraction (LVEF) did not change (58.7 ± 6.0% to 57.5 ± 9.7%, p = 0.385); however, 20 patients (30%) showed >10% decrease in LVEF after LT (61.5 ± 6.1% to 47.3 ± 4.2%, p <0.001) and an increase in LV E/E′ (11.8 ± 1.8 to 12.9 ± 2.2, p = 0.049). Multivariate logistic regression analysis revealed that pre-LT LV E/E′ was associated with decrease in LVEF after LT (odds ratio 1.381, 95% confidence interval 1.010 to 1.947, p = 0.043). Furthermore, patients with strain data showed that lower pre-LT LV strain was independently associated with LVEF decrease after LT (odds ratio 1.293, 95% confidence interval 1.088 to 1.614, p = 0.002). Although RV function improves after LT, LV systolic and diastolic functions deteriorate in a sizable proportion of patients. Impaired LV diastolic function before transplant appears to increase the risk of LVEF deterioration after LT.
Lung transplantation (LT) provides considerable survival benefits for patients with end-stage lung disease; however, its use is severely limited because of donor shortage. Therefore, it is important to select the optimal candidate and optimal timing for LT. Because LT candidates occasionally have cardiovascular risk factors, such as smoking and older age, LT centers perform intensive cardiovascular evaluations before listing patients. Furthermore, patients with longstanding elevated pulmonary vascular resistance (PVR) are known to have right ventricular (RV) dysfunction. Previous studies have shown that preoperative RV dysfunction is an independent risk factor for primary graft dysfunction after LT and is associated with increased mortality and morbidity. Left ventricular (LV) dysfunction rather than RV dysfunction often becomes the primary reason for heart-lung transplant (not lung alone) because RV function may improve after LT. Pielsticker et al performed a worldwide survey of transplant candidates with pulmonary hypertension and reported that the LV and RV functional cutoffs for choosing heart-lung was a left ventricular ejection fraction (LVEF) of 32% to 55% and an RV fractional area change (RVFAC) of 15% to 25%. However, how the LV and RV functions change in LT recipients has not yet been investigated. The specific aim of the present study was to assess the LV function of LT recipients by reviewing their echocardiograms before and after transplant and investigating their ventricular functional dynamics.
Methods
A retrospective chart review was performed in all patients who underwent LT at the Columbia University Medical Center from 2005 to 2011 who had right-sided cardiac heart catheterizations and echocardiograms within 1 year before and after LT. The cardiopulmonary exercise tests (CPETs) before and after LT were also reviewed. Both pretransplant echocardiograms and CPETs were obtained as a part of transplant evaluation in all LT candidates. However, some post-LT echocardiograms are performed at local hospitals; therefore, a limited number of LT recipients had both pre- and post-echocardiograms available from our institutional database. In the present study, we defined LV deterioration as >10% decrease in post-LT LVEF compared with pre-LT LVEF. Similarly, RV deterioration was defined as >5% decrease in post-LT RVFAC. Patients with and without LV/RV function deterioration were compared, and associated preoperative demographics and clinical variables were examined. The Institutional Review Board of the New York Presbyterian-Columbia University Medical Center approved this study.
Both conventional echocardiography and tissue Doppler analysis were performed using Sonos-5500 or Sonos-7500 (Philips Healthcare Corp., Andover, Massachusetts). All measurements obtained were in accordance with recommendations of the American Society of Echocardiography. LV wall thicknesses and dimensions, left atrial diameter, percent fractional shortening, and LVEF calculated by the modified Simpson’s method were recorded. RV parameters included RV free wall thickness, tricuspid annular plane systolic excursion, and RVFAC. Peak early (E) filling velocities of mitral and tricuspid inflow were measured by Doppler echocardiography. Tissue Doppler-derived early diastolic annular velocity (E′) at the septal and lateral mitral annulus for LV E′ and at RV free wall of the tricuspid annulus for RV E′ were obtained, and the E/E′ ratio was calculated as an index of ventricular filling pressures. For patients whose echocardiographic images were analyzable offline using QLAB quantification software (Philips Healthcare Corp.), LV and RV global longitudinal systolic strain values were calculated as average strain values of 6 segments obtained from an apical 4-chamber view. Two examiners blinded to the clinical status of the patients interpreted the echocardiograms. Reproducibility was analyzed in 8 randomly selected patients. Intraobserver reproducibility was assessed with a single reader (TSK) on 2 separate occasions. Interobserver reproducibility was assessed with 2 independent readers (ML and TSK).
All subjects underwent symptom-limited exercise testing on a bicycle before and after LT, as previously described. Supplemental oxygen was used at pre-transplant CPET when needed. The peak oxygen consumption (peak VO 2 ) was defined as the highest value of oxygen uptake attained in the final 20 seconds of exercise. All subjects were given verbal feedback to continue exercising until the anerobic threshold, defined as a respiratory exchange ratio >1, was reached. The slope of the ratio of minute ventilation to carbon dioxide production (VE/VCO 2 ) was calculated as the slope of the regression line relating VE to VCO 2 during exercise. Because peak VO 2 is affected by age, gender, muscle mass, and conditioning status, the percent of predicted peak VO 2 was also calculated.
Right-sided cardiac catheterization was performed as a part of LT evaluation in all patients. The transpulmonary gradient (TPG) was calculated as TPG (mm Hg) = (mean pulmonary artery pressure [mean PA] − pulmonary capillary wedge pressure). PVR was calculated as PVR (Wood units) = TPG/cardiac output. RV stroke work index was calculated as RV stroke work index (g·m 2 /beat) = (mean PA − mean right atrial pressure) × stroke volume index × 0.0136. Systemic vascular resistance was calculated as systemic vascular resistance (dyne·sec·cm −5 ) = (mean arterial pressure − mean right atrial pressure/cardiac output) × 80. Pulmonary hypertension was defined as mean PA ≥25 mm Hg at rest.
All data were analyzed using the statistical analysis software JMP 7.0 (SAS Institute Inc., Cary, North Carolina). Continuous data were evaluated for normality using the Kolmogorov-Smirnov test. Normally distributed data are presented as mean ± SD, and non-normal data are presented as median and interquartile range (IQR) (25% to 75%). Interobserver and intraobserver variability was evaluated by the intraclass correlation coefficient. Patients with and without echo-derived LV or RV functional deterioration were compared using the Student’s unpaired t test for continuous variables and using the chi-square test for categorical variables. Mann-Whitney’s test was performed when the variables were not normally distributed. The values before and after the LT were assessed with Student’s paired t test. Univariate logistic regression analysis was used to determine potential variables associated with deterioration of echo-derived parameters through LT, and variables with a p value of <0.1 by univariate analysis were entered into a multivariate logistic regression model.
Results
Of the 230 LTs performed from January 2005 to March 2011, 135 (57%) had right-sided heart catheterizations and echocardiograms within 1 year of LT (mean ± SD: 164 ± 96 days; median [IQR] 155 days [78 to 229]), and 67 patients (29%) also had echocardiograms obtained later than 1 year after LT (median [IQR] 416 days [369 to 741]). These 67 patients’ data were used for the study. None of them were supported by inotropes at the time of LT evaluation. Baseline clinical characteristics and pre-LT hemodynamic data of all patients are listed in Table 1 . Theoretically, pulmonary hypertension in LT recipients is a form of precapillary pulmonary hypertension because of lung disease and/or hypoxia defined as Dana point group 3 or pulmonary atrial hypertension defined as group 1 ; however, ∼10% of patients had a form of postcapillary hypertension with elevated pulmonary artery wedge pressure (PAWP), so-called pulmonary hypertension because of left heart disease, classified as group 2.
| Clinical characteristics | |
| Age at transplant (years) | 59 (42-64) |
| Male | 36 (54%) |
| Body mass index (kg/m 2 ) | 24.4±4.3 |
| Etiology of lung disease | |
| Interstitial lung disease | 22 (33%) |
| Chronic obstructive pulmonarydisease | 16 (24%) |
| Cystic fibrosis | 12 (18%) |
| Pulmonary arteriay hypertension | 5 (8%) |
| Sarcoidosis | 4 (6%) |
| Bronchiectasis | 4 (6%) |
| Scleroedema | 2 (3%) |
| Bronchiolitis obliterans | 1 (2%) |
| Pulmonary hypertension post atrial septal defect closure | 1 (2%) |
| Type of surgery (Double lung/Single lung) | |
| Double-lung | 55 (82%) |
| Pre lung transplant hemodynamic data | |
| Mean aortic pressure (mmHg) | 86.5±10.2 |
| Mean right atrial pressure (mmHg) | 6.2±4.2 |
| Mean pulmonary artery pressure (mmHg) | 24.3±8.2 |
| Pulmonary capillary wedge pressure (mmHg) | 10.4±5.1 |
| Cardiac index (L/min/m 2 ) | 2.6±0.4 |
| Trans-pulmonary gradient (mmHg) | 14.0 ±7.4 |
| Pulmonary vascular resistance (wood) | 3.2±2.4 |
| Systemic vascular resistance (dyne*sec*cm -5 ) | 1365(1246-1533) |
| Right ventricular stroke work index (g·m 2 /beat) | 7.96 ± 4.68 |
| Patients with pulmonary hypertension | 30 (45%) |
| Pre-capillary pulmonary hypertension | 23 (34%) |
| Post-capillary pulmonary hypertension | 7 (11%) |
Pre- and post-LT echocardiographic and CPET data of all studied patients are listed in Table 2 . Intraobserver variability for LVEF, RVFAC, and LV strain showed correlation coefficients of 0.81, 0.84, and 0.80, respectively. For interobserver reproducibility, correlation coefficients were 0.77, 0.84, and 0.85, respectively. All patients had improved CPET parameters after LT. The LV echocardiographic parameters were not altered before and after LT when we analyzed all 67 patients ( Table 2 ); however, among those, 20 patients (29.9%) showed >10% decrease in LVEF after LT (group LV-decreased), whereas the remaining 47 patients showed little changes or improvements (group LV-preserved; Figure 1 ). In contrast, RV systolic function before and after LT as indicated by RVFAC showed significant improvement in the analysis of all patients ( Table 2 , Figure 2 ), and no patient showed >5% decrease in RVFAC. According to these results, we compared the variables between group LV-decreased and group LV-preserved and evaluated the underlying factors of patients showing decrease in LVEF.
| Pre- Lung transplant | Post- Lung transplant | Paired t-test p value | |
|---|---|---|---|
| Echocardiogram | |||
| Left ventricular parameters | |||
| Left ventricular end-diastolic diameter (mm) | 44.6±4.9 | 44.9±4.7 | 0.623 |
| Left ventricular end-systolic diameter (mm) | 29.0±3.8 | 29.6±5.3 | 0.394 |
| Interventricular septum wall thickness (mm) | 10.1±1.3 | 10.5±1.4 | 0.067 |
| Posterior wall thickness (mm) | 10.0±1.7 | 10.3±2.2 | 0.357 |
| Left ventricular ejection fraction (%) | 58.7±6.0 | 57.5±9.7 | 0.385 |
| %Fractional shortening (%) | 34.8±5.5 | 34.3±7.9 | 0.707 |
| Left atrial diameter (mm) | 35.9±6.4 | 38.9±5.8 | 0.001 |
| E/E’ | 11.0±2.0 | 11.5±2.2 | 0.051 |
| Left ventricular strain (%) (n=49) ∗ | -28.2±5.4 | -26.7±6.2 | 0.117 |
| Right ventricular parameters | |||
| Right ventricular basal diameter (mm) | 34.9±3.2 | 32.7±2.4 | <0.001 |
| Right ventricular free wall thickness (mm) | 9.3±1.3 | 7.8±1.1 | <0.001 |
| Right ventricular fractional area change (%) | 36.7±5.6 | 41.5±2.7 | <0.001 |
| Tricuspid annular plane systolic excursion (mm) | 1.9±0.3 | 2.0±0.3 | 0.089 |
| Right ventricular E/E’ | 8.4±1.8 | 7.7±1.8 | 0.018 |
| Right ventricular strain (%) (n=49) ∗ | -15.5±2.9 | -18.0±2.1 | <0.001 |
| Cardiopulmonary exercise test | |||
| Peak oxygen consumption (mL/min/kg) | 14.5±5.8 | 17.1±4.7 | <0.001 |
| Predicted oxygen consumption (%) | 44.8±19.5 | 57.8±14.3 | <0.001 |
| Slope of the ratio of minute ventilation to carbon dioxide | 38.4±10.9 | 35.4±5.4 | 0.029 |
∗ We could obtain LV and RV strain information from 49 patients (71% of cohort).
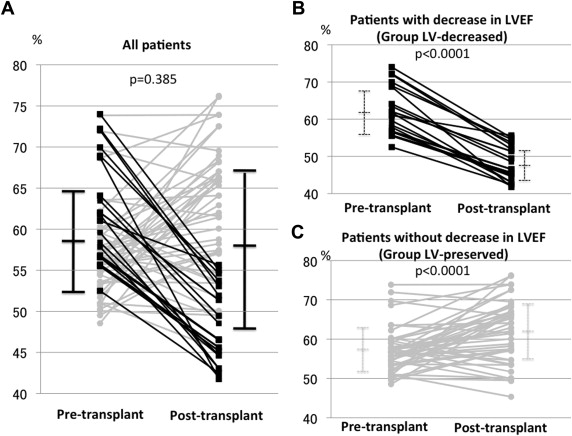
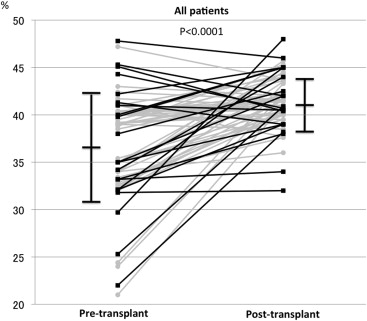
Table 3 summarizes the comparison of variables from group LV-decreased and group LV-preserved. The time from transplant surgery to post-LT echocardiography did not differ between the groups (414 days, range 366 to 639 vs 416 days, range 369 to 876, p = 0.3876). Comparing the echocardiographic variables before and after LT, patients in group LV-decreased showed an increase in LV E/E′ and a decrease in the absolute value of LV strain after LT in addition to the remarkable decrease in LVEF. Conversely, patients in group LV-preserved showed an increase in LVEF, but their LV E/E′ and LV strain did not change after LT. In both groups, RV dilation, hypertrophy, and systolic function as reflected by RVFAC and RV strain improved after LT. The RV E/E′ decreased only in the group LV-preserved. A comparison of the pre-LT echo parameters between the groups revealed that group LV-decreased had a higher LVEF, LV fractional shortening, and LV E/E′. The absolute value of LV strain was lower in the group LV-decreased than in the group LV-preserved. The RV-associated parameters before LT did not significantly differ between the 2 groups.
| Group LV-decreased (n=20) | Group LV-preserved (n=47) | Unpaired t p value | |
|---|---|---|---|
| Baseline characteristics | |||
| Age at Lung transplant (years) | 61.0 (52.5-64.0) | 57.0 (36.0-63.0) | 0.0929 |
| Male | 10 (50%) | 26 (55%) | 0.6897 |
| Body mass index (kg/m 2 ) | 24.7±4.1 | 24.3±4.4 | 0.8299 |
| Etiology (n, %) | 0.4913 | ||
| Interstitial lung disease | 8 (40%) | 14 (30%) | |
| Chronic obstructive pulmonary disease | 4 (20%) | 12 (26%) | |
| Cystic fibrosis | 2 (10%) | 10 (21%) | |
| Pulmonary artery hypertension | 3 (15%) | 2 (4%) | |
| Others | 3 (15%) | 9 (19%) | |
| Type of surgery | |||
| Double-lung | 14 (70%) | 41 (87%) | 0.0923 |
| Hemodynamics | |||
| Mean aortic pressure (mmHg) | 87.2±10.9 | 86.3±10.0 | 0.7454 |
| Mean right atrial pressure (mmHg) | 5.6±3.4 | 6.5±4.5 | 0.3893 |
| Mean pulmonary artery pressure (mmHg) | 24.3±8.1 | 24.4±8.3 | 0.9700 |
| Pulmonary capillary wedge pressure (mmHg) | 11.0±6.0 | 10.1±4.7 | 0.5362 |
| Cardiac index (L/min/m 2 ) | 2.6±0.4 | 2.6±0.5 | 0.7037 |
| Trans-pulmonary gradient (mmHg) | 13.3±7.3 | 14.2± 7.5 | 0.6405 |
| Pulmonary vascular resistance (wood) | 2.9±2.0 | 3.3±2.6 | 0.5791 |
| Systemic vascular resistance (dyne*sec*cm -5 ) | 1320 (1229-1606) | 1378 (1246-1527) | 0.5846 |
| Right ventricular stroke work index (g·m 2 /beat) | 8.1±3.5 | 7.9±5.1 | 0.8575 |
| Pulmonary hypertension | 11 (55%) | 19 (40%) | 0.2730 |
| Pre-capillary pulmonary hypertension | 7 (35%) | 16 (34%) | 0.9398 |
| Post-capillary pulmonary hypertension | 4 (20%) | 3(6%) | 0.0954 |
| Pre-Lung transplant | Post-Lung transplant | Paired t p value | Pre-Lung transplant | Post-Lung transplant | Paired t p value | Comparison of pre-transplant value † | |
|---|---|---|---|---|---|---|---|
| Echocardiogram | |||||||
| Left ventricular end-diastolic diameter (mm) | 44.5±5.7 | 45.5±5.0 | 0.968 | 44.2±4.6 | 44.7±4.7 | 0.594 | 0.357 |
| Left ventricular end-systolic diameter (mm) | 28.5±4.9 | 35.6±4.4 | <0.001 | 29.3±3.4 | 27.9±4.8 | 0.049 | 0.221 |
| Interventricular septum wall thickness (mm) | 10.3±1.4 | 10.7±1.2 | 0.340 | 10.0±1.2 | 10.4±1.5 | 0.123 | 0.457 |
| Posterior wall thickness (mm) | 10.1±1.2 | 10.3±1.3 | 0.498 | 10.0±1.8 | 10.3±2.6 | 0.471 | 0.300 |
| Left ventricular ejection fraction (%) | 61.5±6.1 | 47.3±4.2 | <0.001 | 57.5±5.7 | 61.8±7.9 | <0.001 | 0.011 |
| %Fractional shortning (%) | 37.4±7.3 | 26.3±3.6 | <0.001 | 32.7±4.6 | 37.7±6.7 | <0.001 | 0.029 |
| Left atrial diameter (mm) | 38.6±8.5 | 40.7±6.6 | 0.340 | 34.8±5.0 | 38.1±5.4 | 0.001 | 0.097 |
| Left atrial diameter (mm) E/E’ | 11.8±1.8 | 12.9±2.2 | 0.049 | 10.6±2.0 | 10.9±1.9 | 0.341 | 0.031 |
| Left atrial diameter (mm) strain (%) (n=49) ∗ | -25.8±5.4 | -19.9±2.5 | 0.001 | -29.1±5.0 | -29.5±4.9 | 0.722 | 0.042 |
| Right ventricular basal diameter (mm) | 35.1±2.7 | 33.3±2.4 | 0.004 | 34.8±3.4 | 32.5±2.3 | <0.001 | 0.771 |
| Right ventricular free wall thickness (mm) | 9.6±1.2 | 8.1±1.2 | <0.001 | 9.1±1.3 | 7.7±1.0 | <0.001 | 0.192 |
| Right ventricular fractional area change (%) | 36.3±6.5 | 41.7±3.2 | 0.003 | 36.8±5.2 | 41.5±2.6 | <0.001 | 0.738 |
| Tricuspid annular plane systolic excursion (mm) | 1.9±0.2 | 2.0±0.4 | 0.250 | 2.0±0.3 | 2.0±0.2 | 0.217 | 0.204 |
| Right ventricular E/E’ | 8.2±1.6 | 7.8±1.6 | 0.388 | 8.5±2.0 | 7.7±1.9 | 0.029 | 0.587 |
| Right ventricular strain (%) (n=49) ∗ | -15.5±4.3 | -18.7±1.9 | 0.021 | -15.5±2.1 | -17.8±2.2 | <0.001 | 0.958 |
| Cardiopulmonary exercise test | |||||||
| Peak oxygen consumption (mL/min/kg) | 14.5±6.9 | 17.6±4.1 | 0.046 | 14.5±5.3 | 16.9±4.8 | 0.003 | 0.999 |
| Predicted oxygen consumption (%) | 47.5±23.0 | 62.0±15.1 | 0.019 | 44.0±17.9 | 56.5±14.1 | <0.001 | 0.504 |
| Slope of the ratio of minute ventilation to carbon dioxide | 42.4±14.0 | 35.4±5.5 | 0.053 | 36.6±8.9 | 35.4±5.4 | 0.484 | 0.048 |
∗ We could obtain LV and RV strain information in 49 patients (71% of cohort).
† p values associated with the difference of pre-lung transplant echo parameters between the groups by Student’s unpaired t-test.
Stay updated, free articles. Join our Telegram channel

Full access? Get Clinical Tree


