Concerns have been raised about the performance of highly sensitive cardiac troponin assays to accurately detect acute myocardial infarction (AMI), particularly in non–ST segment elevation (NSTEMI), in elderly patients, and in patients with renal failure. We evaluated whether increased age and low estimated glomerular filtration rate (eGFR) alter diagnostic performance of high-sensitivity cardiac troponin T (HScTnT). In a prospective multicentric study, HScTnT levels were measured blindly at presentation in patients with acute chest pain. Three hundred and sixty-seven patients were enrolled, including 84 patients ≥70 years. Final diagnosis was AMI for 57 patients (16%) and NSTEMI for 43 patients (12%). NSTEMI was more frequent in elderly patients (p = 0.008). Sensitivity and specificity of HScTnT >14 ng/L at admission for AMI were 96% and 51% in patients ≥70 years versus 91% (NS) and 88% (p <0.0001) in younger patients; the same observations were done for the diagnosis of NSTEMI. Given an HScTnT >53.5 ng/L for the diagnosis of AMI and NSTEMI, respective sensitivities were 87% and 84% and respective specificities were 87% and 87% in elderly patients. Using a cutoff at 35.8 ng/L (for AMI) or 43.2 ng/L (for NSTEMI), sensitivities were 94% and 92%, and specificities were 86% and 88% in patients with low eGFR. Older age, but not low eGFR, was an independent predictive factor of an elevated HScTnT at admission (odds ratio 2.2 [1.2–3.9], p = 0.007). In conclusion, adapted thresholds of HScTnT are required for an accurate diagnosis of AMI/NSTEMI in patients aged ≥70 and in those with low eGFR.
Cardiac troponins (cTn, either the T or I isoform) are the preferred biomarkers measured in patients with suspected acute myocardial infarction (AMI). The recently available high-sensitivity assays for cTn (HScTn) have been demonstrated to improve the detection of AMI. Concerns have risen about the exact performance of HScTn assays in elderly patients or in patients with renal failure. In fact, non-AMI elevations of HScTn were noted among these specific populations. The uncertainty regarding the appropriate management of these patients has contributed substantially to the reluctance to use HScTn assays in clinical practice. Elderly patients are prevalent among those presenting to the emergency department with chest pain. Elevations of cTn were found in subjects aged >70 years, and HScTn were shown to be correlated with age. Furthermore, renal dysfunction may influence cTn concentrations, and renal insufficiency rises with age. Elevated HScTn in elderly patients without AMI may increase unnecessary hospitalizations, procedures, and iatrogenesis. This study sought to determine the impact of age and renal function on the diagnostic performance of the HScTnT in the detection of AMI.
Methods
This was a post hoc analysis of 2 previous studies. The study population consisted of patients from 2 prospective clinical evaluations of HScTnT testing. The study was performed in 3 centers in the Paris area. We prospectively enrolled patients (>18 years) presenting to the emergency department or to the cardiology unit with a suspected diagnosis of AMI (chest pain onset <6 hours). Patients requiring renal replacement therapy were excluded. The study complied with the principles of the Declaration of Helsinki. The protocol was approved by local ethical committees, and all patients gave informed consent before inclusion. Recommendations of the Standards for Reporting of Diagnostic Accuracy (STARD) initiative were applied. Elderly patients were defined as those aged ≥70 years.
As part of the routine assessment, all patients underwent an initial clinical evaluation, 18-lead electrocardiogram (ECG), pulse oximetry, routine blood tests, and chest x-ray. Conventional cTnI was measured at presentation and, if needed, repeated after 6 to 9 h. Plasmatic cTnI concentrations were measured on an X-pand HM analyser (Siemens Healthcare Diagnostics, Newark, NJ; Limit of detection = 0.04 μg/L, limit of quantification = 0.14 μg/L, 99th percentile value = 0.07 μg/L) in Cochin and La Pitié Salpêtrière Hospitals, and on an Access analyser (Beckman Coulter, Brea, CA; Limit of detection = 0.01 μg/L, limit of quantifications = 0.06 μg/L, 99 th percentile value = 0.04 μg/L) in Bicêtre Hospital; limits of quantification (10% coefficient of variation values [10% CV]) were used as the cutoff for diagnosis. The decision whether to admit the patient to the hospital or to discharge the patient, as well as medical therapy and the decision to perform coronary angiogram, was at the discretion of the physicians in charge of the patient. Attending emergency physicians and cardiologists were blinded to HScTnT results, and biologists were blinded to the suspected diagnosis.
The final diagnosis was adjudicated in all patients by 2 independent experts (1 emergency physician and 1 cardiologist) and was based on all medical records (but not HScTnT concentrations) available from presentation to 30-day follow-up. In case of disagreement, cases were reviewed and adjudicated in conjunction with a third expert. AMI was diagnosed according to current guidelines. Diagnosis of AMI, either non–ST elevation (NSTEMI) or ST elevation myocardial infarction (STEMI), required a cTnI increase above the 10% CV value, associated with ≥1 of the following: symptoms of ischemia, new ST-T changes or a new Q wave on the ECG, and imaging showing new loss of viable myocardium. Unstable angina (UA) was diagnosed in presence of (1) clinical manifestations suggestive of myocardial ischemia, (2) cTnI <10% CV, and (3) an ECG indicative of ongoing ischemia, or a >70% stenosis of an epicardial coronary artery (or >50% of the left main trunk) on coronary angiography, or coronary vasospasm provoked during angiography. Additional predefined diagnostic categories included cardiac but not coronary symptoms (e.g., pericarditis or myocarditis or tachyarrhythmia), noncardiac causes, and symptoms of unknown origin.
Blood samples obtained from the cTnI measurement in routine assessment were collected in heparinized containers. Plasma HScTnT concentrations were measured on an Elecsys 2010 analyzer using the HScTnT 1-step electrochemiluminescence immunoassay (Roche Diagnostics, Meylan, France). The measuring range extended from 3 to 10,000 ng/L. The threshold for this method is 14 ng/L and corresponds to the 99th percentile. In our laboratory, the CV was <10% at 14 ng/L, and CVs obtained in Roche quality controls containing 27 and 2,360 ng/L of HScTnT were <4 %.
Plasma creatinine levels were assayed using isotope dilution mass spectrometry–standardized methods in all centers. Creatinine results were used for calculation of estimated glomerular filtration rate values (eGFR) using the revised Modification of Diet in Renal Disease formula. Patients were classified according to chronic kidney disease stages: <60 (n = 75), 60 to 89 (n = 187), and ≥90 ml/min per 1.73 m 2 (n = 105; discussed subsequently); eGFR values ≤60 ml/min per 1.73 m 2 were indicative of kidney dysfunction.
Variables are presented as mean ± SD or median (25–75 interquartile range), numbers, and percentages and compared with the Mann-Whitney U test, Pearson chi-squares test, or Fisher exact test as indicated. The Kruskal-Wallis test was used for multiple comparison (between eGFR tertiles). Correlations among variables were assessed using the Spearman coefficient. Receiver operator characteristic (ROC) curves were constructed to assess the sensitivity and specificity and positive and negative predictive values; these values are presented with their 95% confidence interval [95% CI]. Comparison of areas under the ROC curves (AUC) was performed. Because of the possible impact of sample size on threshold value, ROC analysis was complemented with a bootstrap analysis (5,000 random samples with replacement) to obtain a calculation of the optimal threshold of HScTnT and its 95% confidence interval ([95%CI]). A forward logistic regression was performed to assess variables associated with a positive HScTnT. Only variables with p value <0.10 in the univariate analysis were included in the logistic regression. All hypothesis testing was 2-tailed, and a p value of <0.05 was considered significant. Statistical analysis and graphs were performed using MedCalc (Medcalc software, Mariarkerke, Belgium) and R software ( www.r-project.org ).
Results
Three hundred and seventy-five patients were eligible for entry to the study. Creatinine results were not available in 8 patients. Results are therefore presented for 367 patients, including 84 (23%) elderly patients ( Table 1 ). When compared with younger patients, elderly patients had a lower eGFR value, and more frequently had elevated HScTnT at admission and NSTEMI.
| Variable | All patients (n = 367) | Age(Yrs) | p Value ∗ | |
|---|---|---|---|---|
| ≥70 (n = 84) | <70 (n = 283) | |||
| Age (yrs) | 57 ± 16 | 81 ± 8 | 50 ± 11 | — |
| Men | 237 (65%) | 43 (51%) | 194 (69%) | 0.005 |
| Familial history of CAD | 118 (32%) | 21 (25%) | 97 (34%) | 0.160 |
| History of CAD | 102 (28%) | 40 (48%) | 62 (22%) | <0.0001 |
| Dyslipidemia † | 135 (37%) | 34 (40%) | 101 (36%) | 0.455 |
| Smoker | 147 (40%) | 21 (25%) | 126 (45%) | 0.003 |
| Diabetes mellitus | 56 (15%) | 35 (42%) | 21 (7%) | 0.008 |
| Hypertension | 138 (38%) | 51 (61%) | 87 (31%) | <0.0001 |
| Prior heart failure | 25 (7%) | 18 (21%) | 7 (2%) | <0.0001 |
| Typical thoracic pain | 166 (45%) | 34 (40%) | 132 (47%) | 0.383 |
| Coronarography | 128 (35%) | 26 (31%) | 102 (36%) | 0.453 |
| Aspirin | 137 (37%) | 35 (42%) | 102 (36%) | 0.419 |
| Clopidogrel | 62 (17%) | 14 (17%) | 48 (17%) | 0.918 |
| Hospital-admission | 246 (67%) | 64 (76%) | 182 (64%) | 0.074 |
| Admission in ICU | 191 (52%) | 43 (51%) | 148 (52%) | 0.957 |
| At admission, patients with | ||||
| cTnI >10% CV value | 54 (15%) | 26 (31%) | 28 (10%) | <0.0001 |
| HS-cTnT >99th percentile ‡ | 114 (31%) | 52 (62%) | 62 (22%) | <0.0001 |
| Median eGFR (ml/min per 1.73 m 2 ) | 75.3 (62.7–91.7) | 60.8 (46.6–71.3) | 80.5 (67.4–95.8) | <0.001 |
| Final AMI diagnosis | 57 (16%) | 23 (27%) | 34 (12%) | 0.001 |
| STEMI | 14 (4%) | 4 (5%) | 10 (4%) | 0.848 |
| NSTEMI | 43 (12%) | 19 (23%) | 24 (8%) | 0.008 |
| Final UA diagnosis | 26 (7%) | 7 (8%) | 19 (7%) | 0.790 |
| Other diagnosis § | 284 (77%) | 54 (64%) | 230 (81%) | 0.284 |
∗ Between patients aged ≥70 and <70 yrs.
† Hypercholesterolemia ± hypertriglyceridemia.
§ Including stable angina (n = 24), pulmonary embolism (n = 16), myopericarditis (n = 43), heart failure (n = 6), and others.
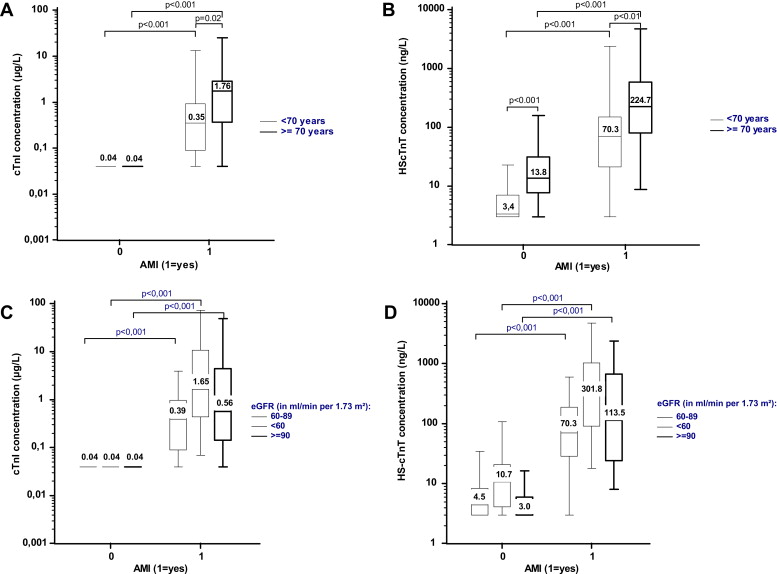
HScTnT concentrations were significantly higher in elderly patients: 20.9 (9.6–86.1) versus 3.9 (3.0–10.7) ng/L in the younger group (p <0.001), regardless of the final diagnosis. However, as for cTnI, HScTnT concentrations remained significantly higher in patients with AMI in comparison with patients without AMI, regardless of age category ( Figure 1 ). HScTnT concentrations increased significantly whereas eGFR decreased: 3.0 ng/L (3.0–9.3) for eGFR ≥90 ml/min per 1.73 m 2 , 5.9 ng/L (3.0–15.6) for eGFR from 60 to 89 ml/min per 1.73 m 2 , and 16.9 ng/L (6.3–51.7) for eGFR ≤60 ml/min per 1.73 m 2 ; (p <0.001). As for cTnI, HScTnT concentrations remained significantly increased in patients with AMI compared with patients without AMI, regardless of the eGFR category ( Figure 1 ).
The AUC for HScTnT to diagnose AMI did not differ in elderly patients (0.92 [0.85–0.97]) versus younger patients (0.93 [0.89–0.95], p = 0.960). Diagnostic performances of HScTnT are presented in Table 2 . In elderly patients, the optimal threshold value for HScTnT based on ROC curve was 32.4 ng/L. Using that cutoff resulted in high sensitivity but somewhat lower specificity compared with that observed in younger patients. Bootstrapping analysis gave an optimal cutoff value at 53.5 ng/L [95% confidence interval: 34.3–109.7] that resulted in same sensitivity and specificity compared with younger patients. After exclusion of STEMI patients, the analysis was similar: AUC in elderly patients = 0.93 [0.84–0.97], p = 0.798 versus younger patients; optimal cutoffs are reported in Table 3 . Sixty-two percent of elderly patients had HScTnT >14 ng/L at admission, 42% had a value >32.4 ng/L, and 32% were >53.5 ng/L. For comparison, 31% of elderly patients had cTnI values above the 10% CV value.
| Sensitivity (%) | Specificity (%) | PPV (%) | NPV (%) | |
|---|---|---|---|---|
| In patients <70 years (n = 283, AMI = 34) | ||||
| HScTnT >14.0 ng/L | 91 [75–98] | 88 [83–91] | 50 [37–63] | 99 [96–100] |
| In patients ≥70 years (n = 84, n AMI = 23) | ||||
| HScTnT >14.0 ng/L | 96 [76–100] | 51 [38–64] ∗ | 42 [29–57] | 97 [82–100] |
| HScTnT >32.4 ng/L | 96 [76–100] | 77 [64–86] † | 61 [44–76] | 98 [88–100] |
| HScTnT >53.5 ng/L | 87 [65–97] | 87 [75–94] | 71 [51–86] | 95 [85–99] |
| In patients with eGFR >60 ml/min per 1.73 m 2 (n = 291, n AMI = 41) | ||||
| HScTnT >14.0 ng/L | 90 [76–97] | 86 [81–90] | 51 [39–63] | 98 [95–99] |
| In patients with eGFR ≤60 ml/min per 1.73 m 2 (n = 75, n AMI = 16) | ||||
| HScTnT >14.0 ng/L | 100 [76–100] | 54 [40–67] ‡ | 37 [23–53] | 100 [86–100] |
| HScTnT >35.8 ng/L | 94 [68–100] | 86 [74–94] | 65 [43–83] | 98 [89–100] |
∗ p value <0.001 versus patients aged <70.
† p value = 0.057 versus patients aged <70.
‡ p value <0.001 versus patients with eGFR >60 ml/min per 1.73 m 2 .
| Sensitivity (%) | Specificity (%) | PPV (%) | NPV (%) | |
|---|---|---|---|---|
| In patients <70 years (n = 273, STEMI = 24) | ||||
| HScTnT >14.0 ng/L | 96 [79–100] | 89 [85–93] | 43 [30–57] | 100 [97–100] |
| In patients ≥70 years (n = 80, STEMI = 19) | ||||
| HScTnT >14.0 ng/L | 95 [72–100] | 51 [38–64] ∗ | 38 [25–53] | 97 [82–100] |
| HScTnT >53.5 ng/L | 84 [60–97] | 87 [76–94] | 67 [45–84] | 95 [85–99] |
| In patients with eGFR >60 ml/min per 1.73 m 2 (n = 280, STEMI = 30) | ||||
| HScTnT >14.0 ng/L | 93 [78–99] | 87 [82–91] | 45 [33–58] | 99 [96–100] |
| In patients with eGFR ≤60 ml/min per 1.73 m 2 (n = 72, STEMI = 13) | ||||
| HScTnT >14.0 ng/L | 100 [75–100] | 54 [40–67] † | 33 [20–50] | 100 [87–100] |
| HScTnT >43.2 ng/L | 92 [64–100] | 88 [77–95] | 63 [39–83] | 98 [89–100] |
Stay updated, free articles. Join our Telegram channel

Full access? Get Clinical Tree


