Transcatheter aortic valve implantation (TAVI) is effective in treating severe aortic stenosis in high-risk surgical patients. We evaluated the value of the QRS duration (QRSd) in predicting the mid-term morbidity and mortality after TAVI. We conducted a prospective cohort study of 91 consecutive patients who underwent TAVI using the CoreValve at our teaching hospital cardiology unit in 2008 to 2010 who survived to hospital discharge; 57% were women, and their mean age was 84 ± 7 years. The QRSd at discharge was used to classify the patients into 3 groups: QRSd ≤120 ms, n = 18 (20%); QRSd >120 ms but ≤150 ms, n = 30 (33%); and QRSd >150 ms, n = 43 (47%). We used 2 end points: (1) all-cause mortality and (2) all-cause mortality or admission for heart failure. After a median of 12 months, the normal-QRSd patients showed a trend toward, or had, significantly better overall survival and survival free of admission for heart failure compared with the intermediate-QRSd group (p = 0.084 and p = 0.002, respectively) and the long-QRSd group (p = 0.015 and p = 0.001, respectively). The factors significantly associated with all-cause mortality were the Society of Thoracic Surgeons score, aortic valve area, post-TAVI dilation, acute kidney injury, hospital days after TAVI, and QRSd at discharge. On multivariate analysis, QRSd was the strongest independent predictor of all-cause mortality (hazard ratio 1.036, 95% confidence interval 1.016 to 1.056; p <0.001) and all-cause mortality or heart failure admission (hazard ratio 1.025, 95% confidence interval 1.011 to 1.039; p <0.001). The other independent predictors were the Society of Thoracic Surgeons score, acute kidney injury, and post-TAVI hospital days. In conclusion, a longer QRSd after TAVI was associated with greater morbidity and mortality after 12 months. The QRSd at discharge independently predicted mortality and morbidity after TAVI.
Transcatheter aortic valve implantation (TAVI) is effective in high-risk surgical patients with severe symptomatic aortic stenosis. TAVI has been reported to improve hemodynamic aortic valve function and survival. However, heart conduction abnormalities are common after TAVI. More specifically, new left bundle branch block (LBBB) develops in approximately 30% of patients and requires permanent pacemaker implantation in ≤1/3 of patients after TAVI. Although it was recently reported that TAVI-induced LBBB was an independent predictor of mortality recently, the importance of the QRS duration (QRSd) is still unclear. The objective of the present prospective cohort study was to evaluate the prognostic significance of QRSd at hospital discharge on morbidity and mortality after CoreValve (Medtronic, Novi, Minnesota) implantation.
Methods
We prospectively enrolled consecutive patients who had undergone TAVI using the CoreValve at our teaching hospital (Henri Mondor, Créteil, France) from December 2007 to December 2010. The patients were enrolled if they were at high surgical risk, as defined by a logistic European System for Cardiac Operative Risk Evaluation score >15%, or were considered ineligible for open chest cardiac surgery by 2 independent cardiac surgeons. Our institutional review board approved the study, and all patients provided written informed consent before study inclusion. The technical aspects of the TAVI procedure using the CoreValve system (Medtronic) have been previously described in detail.
For each patient, an electrocardiogram was recorded before TAVI, just after TAVI, and just before hospital discharge, using a standard digital recorder with 12 simultaneous leads and a 25-mm/s speed. The QRSd was calculated as the mean of all QRSd values in the 12 leads. Using the QRSd value before discharge, the patients were classified into 3 groups: QRSd ≤120 ms (normal), QRSd from 120 to 150 ms (intermediate), and QRSd >150 ms (long; Figure 1 ).
Data on the clinical events, including death and admission for heart failure (HF), were collected by our center 1, 3, 6, 12, and 24 months after TAVI. The follow-up duration was ≥3 months in all patients. We used 2 end points to evaluate the prognostic value of QRSd: death from any cause and either death from any cause or admission for HF.
The data are presented as the mean ± SD if normally distributed and the median (interquartile range) otherwise. To compare the continuous variables across the groups, we used Student’s t test or analysis of variance with the Tukey post hoc test. Fisher’s exact test was used to compare the categorical variables. Survival curves for the time-to-event variables were constructed using all available follow-up data with Kaplan-Meier estimates and were compared using the log-rank test. The parameters significantly associated with either evaluation end point (all-cause death or either all-cause death or HF admission) on univariate analysis using Student’s t test or Fisher’s exact test, with p <0.05, were entered into a multivariate Cox proportional hazards model using forward stepwise selection. The variables associated with p <0.05 in the multivariate model were considered to independently predict the relevant evaluation criterion. All statistical analyses were done using the Statistical Package for Social Sciences, version 19 (SPSS, Chicago, Illinois).
Results
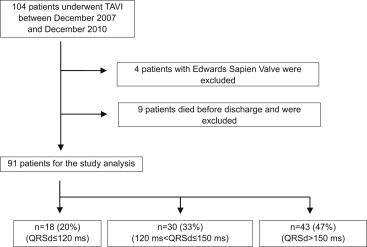
Of the 104 patients who underwent TAVI at our center during the 3-year study period, 100 received the CoreValve system (26-mm diameter in 44 patients and 29-mm diameter in 56 patients). Of the 104 patients, 4, who received the Edwards Sapien valve (Edwards LifeSciences, Irvine, California), and 9, who died before hospital discharge, were excluded from the present study ( Figure 1 ), leaving 91 patients (age 84 ± 7 years) for the analysis. The QRSd was normal before TAVI in 53 patients (58%), just after TAVI in 12 patients (13%), and at hospital discharge in 6 additional patients. Thus, 18 patients were included in the normal-QRSd group (≤120 ms), 30 (33%) in the intermediate-QRSd group, and 43 (47%) in the long-QRSd group ( Figure 1 ).
The main characteristics of the 3 groups are listed in Table 1 . Significant differences were found across the groups in some patient characteristics. The normal-QRSd group had significantly greater severity of aortic valve stenosis, as assessed by the mean aortic gradient and mean aortic valve area. No significant differences were found in the procedural characteristics or periprocedural complications.
| Variable | QRSd (ms) | p Value | ||
|---|---|---|---|---|
| ≤120 (n = 18) | >120 to ≤150 (n = 30) | >150 (n = 43) | ||
| Age (yrs) | 86.3 ± 5.6 | 82.6 ± 9.1 | 84.7 ± 6.1 | 0.193 |
| Women (n) | 13 (72) | 26 (87) | 13 (30) | <0.001 ∗ |
| Logistic EuroSCORE (%) | 26.7 ± 9.9 | 25.4 ± 11.6 | 26.4 ± 11.9 | 0.904 |
| STS score (%) | 13.0 ± 6.9 | 13.3 ± 9.2 | 12.0 ± 8.3 | 0.764 |
| COPD (n) | 5 (28) | 6 (20) | 12 (28) | 0.773 |
| Previous MI (n) | 3 (17) | 2 (7) | 7 (16) | 0.473 |
| Previous PCI (n) | 5 (28) | 7 (23) | 19 (44) | 0.144 |
| Previous CABG (n) | 3 (17) | 4 (13) | 2 (5) | 0.247 |
| PPM before TAVI (n) | 0 (0) | 1 (3) | 18 (42) | <0.001 ∗ |
| Peripheral artery disease (n) | 3 (17) | 5 (17) | 13 (30) | 0.372 |
| Previous stroke (n) | 2 (11) | 0 (0) | 5 (12) | 0.132 |
| Hemodialysis (n) | 1 (6) | 0 (0) | 2 (5) | 0.432 |
| Serum creatinine (μmol/L) | 104 ± 61 | 105 ± 36 | 137 ± 90 | 0.092 |
| Atrial fibrillation (n) | 6 (33) | 14 (47) | 23 (54) | 0.363 |
| Mean aortic gradient (mm Hg) | 63.4 ± 21.9 † | 43.2 ± 16.4 | 42.4 ± 13.4 | <0.001 |
| Aortic valve area (cm 2 ) | 0.54 ± 0.18 ‡ | 0.67 ± 0.20 | 0.78 ± 0.21 | <0.001 |
| AR grade ≥2 before TAVI (n) | 0 (0) | 7 (23) | 2 (5) | 0.012 § |
| LVEF (%) | 49.9 ± 9.7 | 47.7 ± 14.8 | 46.2 ± 13.8 | 0.613 |
| LVEF ≤35% (n) | 2 (11) | 8 (27) | 12 (28) | 0.365 |
| Predilation (n) | 16 (89) | 26 (87) | 37 (86) | 1.000 |
| Postdilation (n) | 0 (0) | 4 (13) | 6 (14) | 0.330 |
| AR grade ≥2 after TAVI (n) | 1 (6) | 0 (0) | 5 (12) | 0.111 |
| AKI (n) | 1 (6) | 3 (10) | 11 (27) | 0.104 |
| New PPM implantation (n) | 2 (11) | 3 (10) | 14 (33) | 0.049 § |
| Admissions after TAVI (n) | 8 ± 8 | 9 ± 6 | 10 ± 6 | 0.402 |
| QRSd before TAVI (ms) | 100 ± 13 | 112 ± 24 | 139 ± 35 † | <0.001 |
| QRSd after TAVI (ms) | 123 ± 31 † | 141 ± 11 † | 167 ± 17 † | <0.001 |
| QRSd at discharge (ms) | 102 ± 12 † | 138 ± 7 † | 171 ± 17 † | <0.001 |
† p <0.01 compared with both of the other groups.
‡ p <0.01 compared with the QRSd >150-ms group with analysis of variance followed by Tukey’s procedure.
After a median follow-up of 12 months after hospital discharge (interquartile range 6 to 17), no patient in the normal-QRSd group had died. However, 8 (27%) and 16 (37%) patients had died in the intermediate-QRSd and long-QRSd group, respectively. The normal-QRSd group had a lower trend of mortality or significantly lower mortality than the other 2 groups (p = 0.084 and p = 0.015, respectively; Figure 2 ). As shown in Figure 2 , the proportion of survivors without an admission for HF was significantly greater in the normal-QRSd group than in the other 2 groups (p = 0.002 and p = 0.001, respectively). Neither all-cause mortality nor all-cause mortality/HF admission differed significantly between the intermediate-QRSd and long-QRSd groups.
Compared with the survivors, the patients who died had some different characteristics ( Table 2 ). On multivariate analysis, the QRSd at discharge was the strongest independent risk factor for all-cause mortality; the other independent risk factors were the Society of Thoracic Surgeons score, acute kidney injury (AKI), and post-TAVI hospital days ( Table 3 ). During the follow-up period, 40 patients (44%) either died or were admitted for HF. This patient subgroup had a significantly greater proportion of patients with aortic regurgitation grade 2 or greater before TAVI and a greater aortic valve area, rate of AKI, QRSd just after TAVI, and QRSd at hospital discharge compared with the survivors without HF admissions. This patient subgroup also had lower values for the aortic gradient. On multivariate analysis, the QRSd at hospital discharge was independently associated with all-cause mortality/HF admission. Grade 2 or greater aortic regurgitation before TAVI and AKI were also independent risk factors for QRSd ( Table 4 ).
| Characteristic | Nonsurvivors (n = 24) | Survivors (n = 67) | p Value |
|---|---|---|---|
| Age (yrs) | 84.8 ± 7.3 | 84.2 ± 7.2 | 0.735 |
| Women (n) | 10 (42) | 42 (63) | 0.094 |
| Logistic EuroSCORE (%) | 30.4 ± 14.3 | 24.6 ± 9.8 | 0.076 |
| STS score (%) | 16.0 ± 8.5 | 11.4 ± 8.0 | 0.021 ∗ |
| COPD (n) | 8 (33) | 15 (22) | 0.290 |
| Previous MI (n) | 3 (13) | 9 (13) | 1.000 |
| Previous PCI (n) | 8 (33) | 23 (34) | 1.000 |
| Previous CABG (n) | 1 (4) | 8 (12) | 0.436 |
| PPM before TAVI (n) | 6 (25) | 13 (19) | 0.568 |
| Peripheral artery disease (n) | 5 (21) | 16 (24) | 1.000 |
| Previous stroke (n) | 3 (13) | 4 (6) | 0.375 |
| Hemodialysis (n) | 1 (4) | 2 (3) | 1.000 |
| Serum creatinine (μmol/L) | 137 ± 86 | 114 ± 66 | 0.187 |
| Atrial fibrillation (n) | 14 (58) | 29 (43) | 0.239 |
| Mean aortic gradient (mm Hg) | 41.3 ± 13.7 | 48.8 ± 19.2 | 0.079 |
| Aortic valve area (cm 2 ) | 0.79 ± 0.22 | 0.66 ± 0.21 | 0.010 ∗ |
| AR grade ≥2 before TAVI (n) | 4 (17) | 5 (8) | 0.236 |
| LVEF (%) | 48.3 ± 13.5 | 47.1 ± 13.4 | 0.696 |
| LVEF ≤35% (n) | 6 (25) | 16 (24) | 1.000 |
| Predilation (n) | 20 (83) | 59 (88) | 0.726 |
| Postdilation (n) | 6 (25) | 4 (6) | 0.019 † |
| AR grade ≥2 after TAVI (n) | 3 (13) | 3 (5) | 0.185 |
| AKI (n) | 8 (35) | 7 (11) | 0.020 † |
| New implantation of PPM (n) | 7 (29) | 12 (18) | 0.255 |
| Admissions after TAVI (n) | 13 ± 8 | 8 ± 5 | 0.002 ‡ |
| QRSd before TAVI (ms) | 128 ± 34 | 120 ± 32 | 0.262 |
| QRSd after TAVI (ms) | 156 ± 22 | 148 ± 27 | 0.165 |
| QRSd at discharge (ms) | 159 ± 20 | 142 ± 31 | 0.002 ‡ |
Stay updated, free articles. Join our Telegram channel

Full access? Get Clinical Tree


