Imaging Modalities and Applications
Over the past three decades, the introduction of new imaging modalities has had a profound impact on the practice of cardiopulmonary radiology. Many of the new modalities have not only complemented but replaced the classic imaging arsenal (1). For example, conventional planar tomography and bronchography have been replaced by computed tomography (CT) with multiplanar reconstructions. No other imaging modality matches the level of detail of the lungs provided by CT. Dynamic imaging of the heart was markedly changed with the introduction of echocardiography and is currently again being transformed by cardiac magnetic resonance imaging (MRI) and CT. Fluoroscopy has become an almost completely lost art. In this chapter, we introduce the main imaging modalities in clinical use and elaborate on their principles and applications.
Chest Radiograph
Its origins going back to 1895, the plain radiograph still represents the cornerstone of modern cardiopulmonary radiology. Depending on the practice setting, around 30% to 60% of all radiologic examinations performed in the clinical practice of radiology are plain radiographs of the chest. These are simple, quick, cheap, and provide useful clinical information for diagnostic and follow-up purposes. The major indications for chest radiography are listed in Table 2.1 (2).
The single most commonly performed radiologic examination is the chest radiograph.
The basic principles of chest radiography are relatively simple (Fig. 2.1); a patient is placed between an x-ray source and a detector. A point source emits photons with energies in the x-ray range toward the patient. These photons penetrate the patient, are attenuated (mostly by scattering and absorption), and those that come out of the patient are captured by the detector. This generates a single projection image of attenuation properties of the patient onto the detector (Fig. 2.2). Lungs contain mostly air and thus show little attenuation of the photons traversing them. Other tissues, like the heart, great vessels, and chest wall, are denser and show greater attenuation of the x-ray beam.
Radiation in the diagnostic range is 60 to 150 keV.
The point source is an x-ray tube that emits radiation in the “diagnostic” x-ray range, which is between 60 and 150 keV. Photons with energies at the upper end of that range have better penetrance in the body and are therefore less attenuated. Photons with energies at the lower end of the range are more attenuated by the soft tissues and osseous structures
of the chest. Tube voltage, measured in peak kilovoltage (kVp), determines the maximum energy of the emitted photons. Tube current, measured in milliampere (mA), combined with exposure time in seconds, determines the total number of photons emitted. Both kVp and mA are controlled by the operator. Typical values for a chest radiograph are 120 kVp and 5 mA.
of the chest. Tube voltage, measured in peak kilovoltage (kVp), determines the maximum energy of the emitted photons. Tube current, measured in milliampere (mA), combined with exposure time in seconds, determines the total number of photons emitted. Both kVp and mA are controlled by the operator. Typical values for a chest radiograph are 120 kVp and 5 mA.
Table 2.1: Indications for Chest Radiograph | |
|---|---|
|
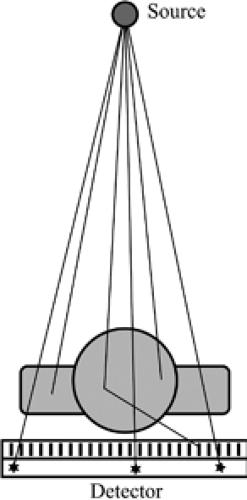 Figure 2.1 Principles of chest radiography. A source emits x-ray photons toward the patient. The radiation that comes out of the patient hits a detector. A grid is used between the patient and the detector to block scattered radiation. |
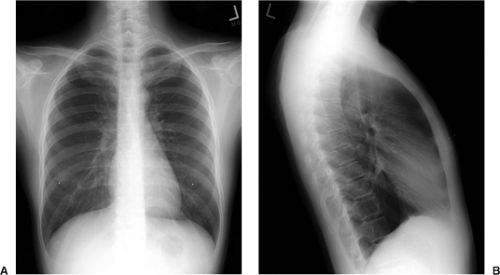 Figure 2.2 Normal chest radiograph in the posteroanterior (A) and lateral (B) positions. The radiograph has wide latitude and can represent lung structures, cardiac and vascular structures, soft tissues of the chest wall, and ribs. Metallic nipple markers are used here. |
Tube voltage (kVp) determines maximum energy of the x-ray photons.
The simplest type of detector is a plastic film covered with a light-sensitive emulsion, silver halide. Films alone have very limited sensitivity to x-rays; therefore, an amplifying screen must be placed against the film to produce multiple visible photons for each incident x-ray. Plain films can display a wide range of attenuations (wide latitude). More modern detectors are digital in nature (3). In computed radiography, the detector is a plate of phosphor or selenium phosphor, which captures x-rays. Once exposed, the plate is scanned point by point by a laser beam. Each point emits a radiation of intensity that is quantified and is proportional to the x-ray energy captured at that specific point on the plate. Computed radiography offers greater latitude than the screen–film combination. In direct radiography, the plate is usually made of a grid of tiny elements called charged coupled devices (like sensors in most modern digital cameras) or thin-film transistors (like flat screens for computers). These elements can directly record and quantify the number of photons striking each point of the plate without the need to scan the plate point by point with a laser beam. It is therefore much faster to process than computed radiography. With all types of detectors, grids and filters are usually used to block scattered photons and eliminate photons of too low energy, respectively.
Tube current (mA) × time (seconds) determines the number of photons emitted (mA).
The position of the patient with respect to the detector can vary. In the most common technique, posteroanterior and lateral views of the chest are obtained (Fig. 2.2). The patient is placed in the upright position, 180 cm (6 feet) from the source, facing the detector so the radiation crosses the patient from the back to the front (posteroanterior) and then with the left side facing the detector (lateral). These two projections allow a gross three-dimensional estimate of the structures in the chest. In bedridden patients, the x-ray plate or detector is typically inserted under the patient, and the radiation crosses the patient in a front to back direction (anteroposterior). The distance between the source and the patient is often decreased to 100 to 125 cm, which produces a larger magnification of anatomic structures in the anterior aspect of the chest, particularly the heart and superior mediastinum (Fig. 2.3). If the patient is placed on a table lying on their side, a lateral decubitus
view is obtained. This is useful to assess for a pleural effusion (Fig. 2.4) (4) or air trapping on the dependent side and pneumothorax on the nondependent side. Oblique views with the patient at an angle to the film can be obtained to eliminate superposed structures. A common angled view is the apical lordotic view, with photons crossing the patient from a low anterior to a high posterior position. This provides a better view of the lung apices (5) by projecting the clavicles above them (Fig. 2.5).
view is obtained. This is useful to assess for a pleural effusion (Fig. 2.4) (4) or air trapping on the dependent side and pneumothorax on the nondependent side. Oblique views with the patient at an angle to the film can be obtained to eliminate superposed structures. A common angled view is the apical lordotic view, with photons crossing the patient from a low anterior to a high posterior position. This provides a better view of the lung apices (5) by projecting the clavicles above them (Fig. 2.5).
Decubitus images are useful for evaluation of pleural fluid (free flowing or not), pneumothorax (when patient cannot sit upright), and air trapping (failure of dependent lung to collapse).
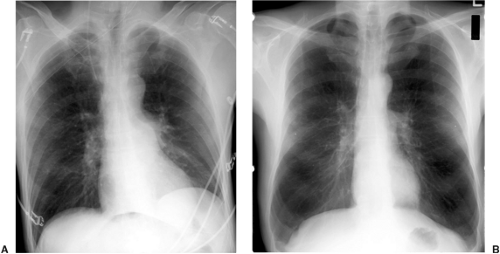 Figure 2.3 Posteroanterior vs. anteroposterior radiograph. On the anteroposterior radiograph (A) of this normal patient, the detector is against the back of the patient. A combination of decreased distance between the source and the patient and increased distance between the detector and the anterior mediastinal structures compared with the posteroanterior radiograph (B) leads to magnification of the heart. |
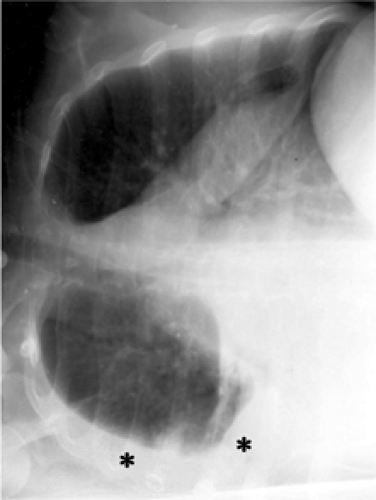 Figure 2.4 Lateral decubitus. The patient is positioned with their side against a table, and a radiograph is taken across the table. A free-flowing right pleural effusion is demonstrated (asterisk). |
In most cases, the radiograph is taken with the patient in full inspiration. Several respiratory maneuvers can be performed by the patient immediately before radiographic exposure. A radiograph with the patient in expiration may demonstrate air trapping. Radiographs taken while the patient is performing a Valsalva or a Müller maneuver can also be taken to assess changes in vascular structures or masses.
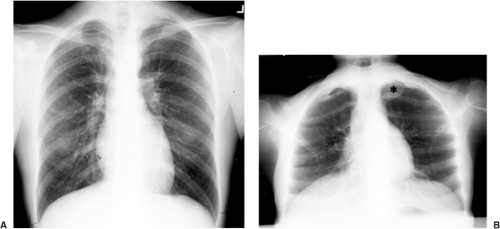 Figure 2.5 Lordotic view. In this patient with a left apical neurofibroma, the abnormality is subtle on the posteroanterior radiograph (A), but the lordotic view (B) improves visualization of the lung apices, and the neurofibroma (asterisk) becomes more apparent. |
Fluoroscopy, Conventional Tomography, and Bronchography
Fluoroscopic imaging is largely a dead or dying art. In the past it had been used to evaluate pulmonary nodules and mediastinal vasculature. It is still occasionally used to assess diaphragmatic motion (“sniff test”). This test involves dynamic evaluation of the simultaneous motion of the two hemidiaphragms during normal breathing and forced rapid inspiration (a “sniff”). If there is paralysis of one hemidiaphragm, it will not move as well as the contralateral part (Fig. 2.6) and may show paradoxical motion during rapid inspiration.
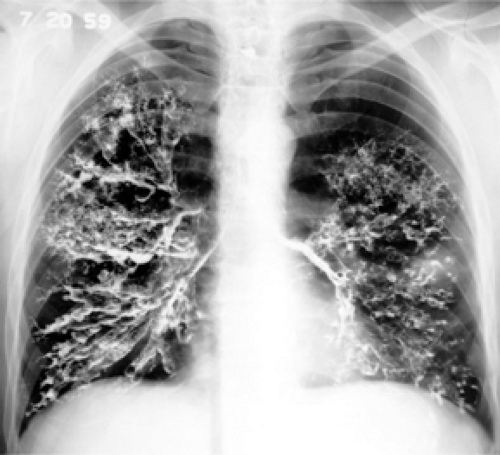 Figure 2.6 Bronchography, circa 1950. An endobronchial inhaled contrast agent was used to demonstrate the presence of bronchiectasis. |
Bronchography is also an obsolete technique involving the administration of iodinated contrast via inhalation to coat the surface of the tracheobronchial tree and to evaluate the presence and extent of bronchiectasis. This has been completely replaced by high resolution CT.
Conventional tomography is an obsolete technique that used simultaneous movement of a source of x-ray and a detector in opposite directions with respect to a specific plane of imaging, to blur all the structures out of that plane of imaging. This has been replaced by CT (6).
Computed Tomography
Invented in 1972 by Hounsfield, CT is the imaging modality of choice for evaluating the thorax, after the chest radiograph, because the level of anatomic detail is unmatched by anything else in radiology. Indeed, the only other imaging modality that offers more extensive anatomic detail than CT is direct tissue examination under a microscope by a pathologist (which is much more invasive than CT). Note that whereas the in-plane spatial resolution of CT is 5 times lower than that of plain radiography (Table 2.2), the contrast resolution (the depiction of subtle differences in contrast) is 10 times greater than that of chest radiography. This improved contrast resolution, in combination with the tomographic nature of CT, enables CT to provide much better anatomic detail than plain radiography, despite the lower spatial resolution. The indications for chest CT are indicated in Table 2.3 (7).
After the chest radiograph, CT is the method of choice for most advanced imaging of the thorax.
The basic principles of CT are relatively simple (Fig. 2.7) and are an extension of plain film radiography. The point source of x-ray photons and the detectors are placed on opposite sides of the patient on a ring-like structure, called the gantry. The gantry rotates around the patient, located on a table at its center. Photons are emitted toward the patient,
penetrate the patient, and are captured by one or more detectors. This generates a series of projection images of attenuation properties of the patient. Images representing photon attenuation at each point in the volume traversed by the photons can then be mathematically reconstructed from the different projections (Fig. 2.8).
penetrate the patient, and are captured by one or more detectors. This generates a series of projection images of attenuation properties of the patient. Images representing photon attenuation at each point in the volume traversed by the photons can then be mathematically reconstructed from the different projections (Fig. 2.8).
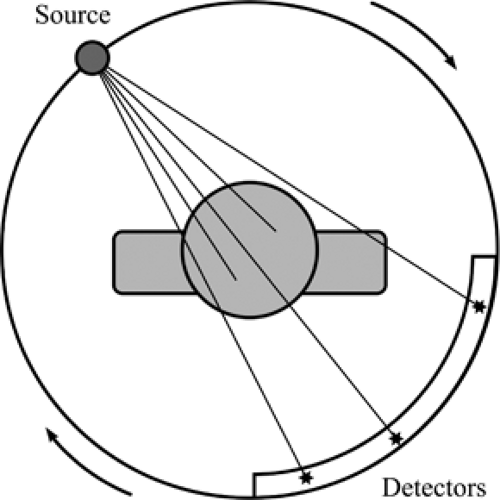 Figure 2.7 Principles of computed tomography. The source of x-rays and the detectors are on opposite sides of the gantry with the patient at the center of the gantry. Radiation that crosses the patient is detected, producing a projection of attenuation information. By rotating the gantry around the patient, multiple projections are obtained, which are then used to mathematically reconstruct tomographic attenuation images. |
Table 2.2: Spatial Resolution and Effective Radiation Dose of Thoracic Imaging Modalities | |||||||||||||||||||||||||||||||||
|---|---|---|---|---|---|---|---|---|---|---|---|---|---|---|---|---|---|---|---|---|---|---|---|---|---|---|---|---|---|---|---|---|---|
| |||||||||||||||||||||||||||||||||
Table 2.3: Indications for Thoracic Computed Tomography | ||
|---|---|---|
|
The source of radiation, the x-ray tube, rotates continuously around the gantry, using a slip-ring technology in more modern scanners. Collimation is used at the source. The x-ray tube voltage in CT is usually 120 kVp, similar to that of a plain chest radiograph. However, CT uses a longer exposure time, 1 second per gantry rotation, with combined tube current–exposure time value of 200 mA, which increases the radiation dose.
CT scanner technology has gone through several generations of refinements (8). Early scanners used incremental table displacement and produced one set of axial projections at each table position. Modern scanners use continuous table displacement while the gantry rotates and produce helical projections, with a stationary 360-degree array of detectors around the entire gantry. The latest scanners have multiple rows of detectors in the direction of slice thickness. An entire CT of the chest using a multislice CT scanner takes only a few seconds. The recorded projections are helical in nature, and planes of imaging are interpolated from the helical projection data. In single-row detectors, collimation determines
slice thickness, whereas it is determined by detector configuration and reconstruction algorithm in multiple row scanners. The table travel per complete rotation of the gantry with respect to x-ray beam collimation is called the “beam pitch.” In multislice scanners, the table travel per complete rotation of the gantry with respect to the data slice thickness is called the “data pitch.”
slice thickness, whereas it is determined by detector configuration and reconstruction algorithm in multiple row scanners. The table travel per complete rotation of the gantry with respect to x-ray beam collimation is called the “beam pitch.” In multislice scanners, the table travel per complete rotation of the gantry with respect to the data slice thickness is called the “data pitch.”
Fast helical CT scanners can image the entire thorax in seconds, reducing respiratory motion artifact.
Beam pitch is table travel per gantry rotation divided by beam collimation.
Data pitch is table travel per gantry rotation divided by normal slice width. This is the preferred definition for multislice CT.
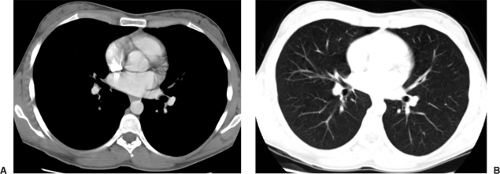 Figure 2.8 Computed tomography imaging. On a mediastinal window (A), the lungs are mostly black and the mediastinum and chest wall are emphasized. On a lung window (B), these structures are white and the fine structures of the lungs are emphasized. |
Several postprocessing steps can be performed when the slices are reconstructed from the projections. Tissue-specific algorithms, such as “soft tissue” or “lung,” are available to more accurately reconstruct the CT projection data based on assumptions of x-ray photon energy and tissue attenuation. The projection data represent attenuation of multiple points through a volume of the chest. In practice, the projection data are used to reconstruct entire axial slices of the patient or only a subset of each slice, called the “field of view.” But one is far from limited to reconstructing axial images. One of the most powerful features of CT is the ability to reformat the image data into multiplanar and three-dimensional images. Axial and helical data can be reformatted to produce simple images in the coronal or sagittal planes (Fig. 2.9). To improve visualization, volumetric data can also be combined into a single image representing for each pixel the maximum or minimum value of that pixel through the volume (Fig. 2.10). Powerful algorithms can also produce three-dimensional images with shaded surface display (Fig. 2.11) or even endobronchial images (virtual bronchoscopy) (Fig. 2.12) (9,10).
The reconstructed images represent a range of attenuations of different points in a slice of the patient. CT image values are typically scaled to 4,096 different levels of attenuation recorded, measured in “Hounsfield units” (HU). By convention, air has a value of -1,000 HU and water a value of 0 HU. Hounsfield units in medical CT typically range from -1,000 and +3,000. Modern monitors cannot display the full range of attenuation values, because they are typically limited to 256 levels of gray. Moreover, the radiologist’s eyes can only distinguish between 30 to 90 levels of gray. The operator can choose to map any range of attenuation values into the displayed 256 levels of gray. The center of this range of displayed attenuation values is called the “window level” and the width of this range is called the “window width.” A soft tissue window typically displays attenuation levels in the range of -400 to +200 HU and emphasizes structures in the mediastinum, whereas a lung window displays attenuation levels in the range of -1,000 to -300 HU and emphasizes structures in the lung (Fig. 2.8).
Different window and level combinations are used to evaluate structures of different attenuation, such as lung, soft tissue, and bone windows settings.
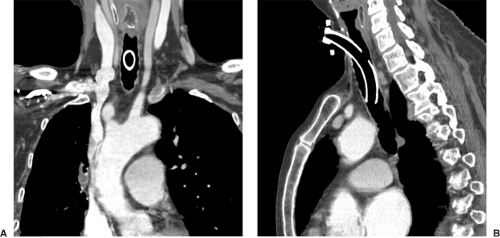 Figure 2.9 Coronal and sagittal reconstructions. Multiplanar reconstruction of the helical projection data in the coronal (A) and sagittal (B) planes can be performed. This improves visualization of some structures, such as the lung apices and the great vessels. |
In general, for cardiopulmonary imaging, the patients lay still in a supine position on the table and hold their breath for the duration of the CT acquisition. Scanning can be performed at end-inspiration and end-expiration and also in the prone or decubitus positions. Furthermore, intravenous contrast can be administered to the patient before scanning to emphasize vascular structures and to modify the attenuation properties of different parts of the body. For routine chest CT, contrast is injected at 2 mL/s, whereas for CT angiogram (CTA) contrast is injected at 4 mL/c.
CT angiography requires a faster rate of intravenous contrast administration than routine CT.
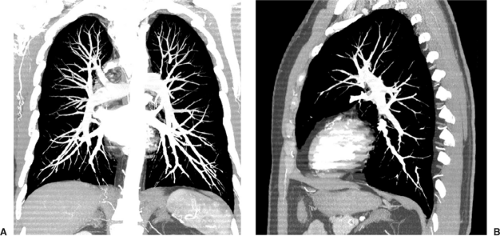 Figure 2.10 Maximal intensity projection reconstructions. Information from a stack of images representing a volume can be combined into a single image representing for each pixel the maximum value of that pixel through the volume, shown here in the coronal (A) and sagittal (B) planes. |
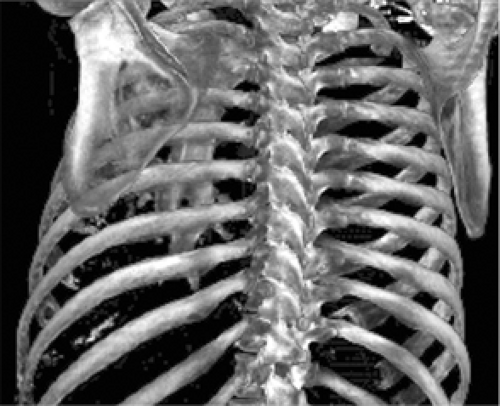 Figure 2.11 Three-dimensional reconstructions. Data can be further processed to produce three-dimensional images with shaded surface of any chest structure, such as the heart, mediastinum, lungs or ribs. |
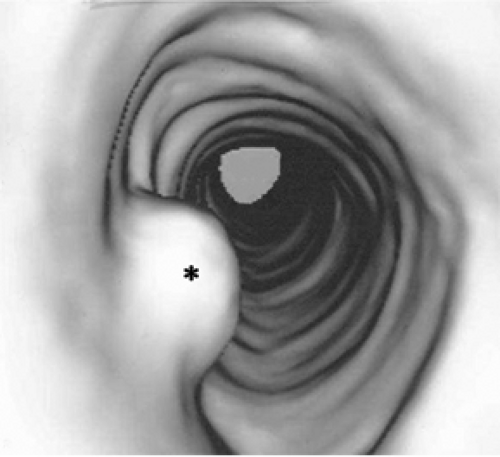 Figure 2.12 Virtual bronchoscopy. Endoluminal views of the tracheobronchial tree, reconstructed from thin slice images of the thorax, improve visualization of this endotracheal papilloma (asterisk). |
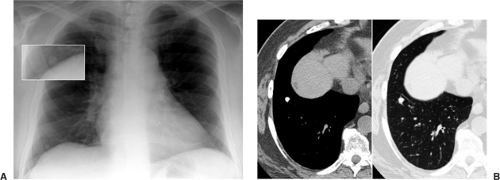 Figure 2.13 Lung nodule on computed tomography. The faint nodule projecting at the right lung base near the diaphragm (A) was further investigated by Computed Tomography, which revealed a calcified granuloma (B). |
Different scanning protocols are used to answer different clinical questions (Figs. 2.13 and 2.14). Table 2.4 illustrates common CT protocols. In general, thicker slices (5 mm) provide enough anatomic detail for diagnosis of most cardiopulmonary disease. Thinner (1 to 1.5 mm) slices are used in three different contexts. For interstitial lung disease (11), thin slices are used with 10-mm spacing between slices. This covers only 10% of the chest but provides improved pulmonary parenchymal detail while minimizing radiation dose. For CT angiography, thin continuous slices are used to provide fine detail of the entire vascular tree of concern (12). For screening, thin continuous slices at very low doses are used to detect small lung nodules (13).
Stay updated, free articles. Join our Telegram channel

Full access? Get Clinical Tree


