Imaging in the Electrophysiology Laboratory: Intracardiac Echocardiography

Chapter 22 Imaging in the Electrophysiology Laboratory


Intracardiac Echocardiography


Principles of Intracardiac Echocardiographic Imaging


Piezo-electric crystals in transducers generate ultrasound waves and receive the reflected echoes from the target. Current ultrasound transducers use either miniature crystals in a series, commonly referred to as phased-array systems, or a single crystal rotated by a mechanical system, aptly referred to as a mechanical or rotational transducer system. These crystals produce vibrations in response to voltage gradients as polarized molecules in the crystal distort the crystalline surface to produce sound waves. These waves propagate through the body in a longitudinal fashion and, like light energy, undergo reflection, refraction, absorption, and scatter. Reflection of ultrasound waves can occur at the surface and within tissue planes with differing acoustic impedances. Their angle of incidence on tissue planes can determine the nature and intensity of reflection. Reflection is maximal at the tissue surface and increasingly attenuated because of scatter and refraction in deeper tissue planes. The acoustic properties of tissues can also determine the degree of reflection, with greater disparities between adjoining tissues providing greater reflection, such as heart and lung tissues. The frequency of generated ultrasound energy also determines the extent of tissue penetration. Reflected waves are received by the transducer crystal and generate an electrical signal that is amplified and processed. Amplification of signals varies depending on their magnitude and is designed to allow low-amplitude signals to be registered. They are filtered, and the ultrasound signal is displayed in different scan formats such as two dimensional, in which sequential echoes are made over a 90-degree sector using up to 100 scan lines displayed at rapid frame rates that give the impression of a constant image. Other display formats used include M-mode scans, which result from repeated scanning along a single axial array displayed sequentially from left to right to envelope the time element. The Doppler principle can be used to quantify blood flow velocity across cardiac structures by the ICE probe. The shift in transducer frequency generated by the moving elements, such as blood cells and their contents, is generated by the ultrasound beam hitting the element and repeating on beam scatter. In pulsed Doppler, brief bursts of ultrasound (<5 ms in duration) are delivered and received, but undersampling may occur with potential for aliasing. Continuous-wave Doppler involves constant emission of ultrasound energy and provides a more accurate velocity measure, particularly if high velocities are present. Color-flow Doppler imaging adds processing to display velocities during a Doppler sector scan to show their distribution in the scanned region. This is useful for assessing regurgitant jets, septal defects, and stenoses. It is also subject to aliasing because of the pulsed nature of the measurements.


Comparison of Mechanical and Phased-Array Intracardiac Echocardiographic Transducers and Systems


Mechanical transducers are mounted perpendicularly on a 6 to 10 Fr catheter body with a single rotating piezo-electric crystal in the transducer that rotates at 1800 rpm (Boston Scientific, Natick, MA). This allows a circular, 360-degree scan giving a cross-sectional view of the surrounding structure. These transducers are driven at higher frequencies (9 to 20 MHz), which reduce the depth of ultrasound beam penetration into tissue. Thus these systems can produce high-quality near-field images but with limited imaging depth (4 cm). Thus far, field image resolution is poor. Furthermore, the catheter body has limited or no deflection capability and is not flexible because of the rotational mechanism in its core. Because of these features, these ICE systems must be passed into the chamber of interest. For example, satisfactory left atrial visualization is achieved only after trans-septal placement in the chamber, unlike phased-array systems. They can be used to visualize right-sided structures such as the crista terminalis, fossa ovalis, superior vena cava, or tricuspid valve.


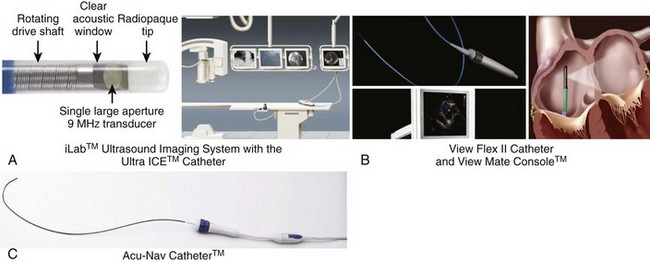
Phased-array systems use either a linear array of crystals (Viewmate, St Jude-EP Med Systems, Berlin, NJ; AcuNav, Acuson Division, Biosense Webster, Diamond Bar, CA) parallel to the catheter body or radially arranged crystals at the catheter tip (JOMED). The first two use 64 to 128 crystal elements and operate at frequencies ranging from 5 to 10 MHz. These can operate at variable (Acuson) or four different frequencies (Viewmate) to produce a sector scan parallel to the long axis of the catheter. The catheter body ranges from 7 to 10 Fr and is typically deflectable over an arc of 90 degrees. These systems produce two-dimensional and M-mode images with high resolution over depths up to 12 cm. This permits imaging of the left-side chambers from the right heart without trans-septal puncture. In general, these systems have become more popular in clinical electrophysiological procedures. More detailed features of each of these systems are shown in Figure 22-1. Platforms can provide more enhanced imaging features such as harmonic imaging for producing improved gray-scale image presentation, adaptive color Doppler to select the optimal frequency for improved resolution, and tissue Doppler imaging to assess direction and timing of myocardial function and pulsed-wave tissue Doppler for velocity mapping during cardiac and vascular imaging. Fusion of two-dimensional ICE images into a static electroanatomic map using the CARTO system (Biosense Webster) is now commercially available (discussed later and elsewhere in this text).


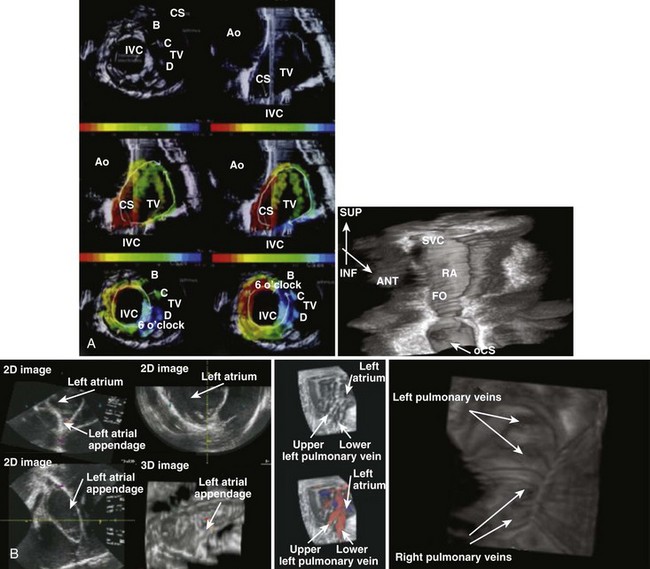
Three-dimensional reconstruction has now been performed with offline and real-time reconstruction of serial images and by overlay of electrical activation sequences on the images. Simon et al initially demonstrated electroanatomic mapping by using serial sections from a rotational ICE transducer and electrical recordings from a basket catheter in the right atrium in patients with atrial flutter, which were processed offline (Figure 22-2, A).1 With this approach, they could demonstrate macro–re-entrant activation sequences in common atrial flutter on a three-dimensional anatomic ICE image. Smith et al used a phased-array system to reconstruct a real-time three-dimensional anatomic ICE image with up to 60 volumetric scans per minute and superimposed activation maps on these images. In a sheep model, they demonstrated right and left atrial intracardiac structures, including pulmonary veins and the right ventricle, and pacing sequences could be accurately visualized in the reconstructed anatomy.2 Pulmonary veins, antral regions, and right atrial structures have been reconstructed in early three-dimensional image efforts (see Figure 22-2, A).3 Knackstedt and colleagues reported a close to real-time technique using an AcuNav ICE catheter with a motorized sector scan and reconstruction of serial two-dimensional images. Animal and clinical testing validated the visualization of anatomic structures.4 Okumura and colleagues applied online imaging and offline reconstruction of ICE imaging of pulmonary veins by using a pullback technique during ablation procedures in 29 patients. The images were computer reconstructed to visualize the entire length of pulmonary veins with a three-dimensional full motion image being developed. Radiofrequency (RF) lesions could be visualized and the extent of ablation between extensive and segmental ablation procedures assessed. The superior pulmonary veins were visualized in virtually all patients; the ablation sites were identified, pulmonary vein stenosis excluded, and comparable lesions sizes noted with both approaches.5


image

FIGURE 22-2 Three-dimensional reconstruction of right and left atrial and pulmonary vein regions with rotational and phased-array systems. A, Short- and long-axis sections of the right atrium displayed from a three-dimensional (3D) reconstruction of serial intracardiac echocardiography images using a rotational transducer combined with activation mapping overlap from a basket catheter in common atrial flutter (left). The basket splines are shown in alphabetical order and the macro–re-entrant circuit is clearly visualized. Right, 3D reconstructed image of the right atrium showing the coronary sinus en face. B, Real-time two (2D) and (3D) images of the left atrium obtained with a motorized phased-array system (left). Left atrial structures are visualized in a typical 2D view (top, bottom left), and reconstructed 3D view shows the left atrial appendage visualized in three dimensions (bottom right). Pulmonary veins, their ostia, and their antra are well shown in this 3D reconstruction of the anatomic interfaces of these structures (right). SUP, Superior; INF, inferior; ANT, anterior; SVC, superior vena cava; RA, right atrium; FO, fossa ovalis; oCS, ostium of the coronary sinus.


(Modified from Simon RD, Rinaldi CA, Baszko A, Gill JS: Electroanatomic mapping of the right atrium with a right atrial basket catheter and three-dimensional intracardiac echocardiography, Pacing Clin Electrophysiol 27:318–326, 2004; Smith SW, Light ED, Idriss SF, Wolf PD: Feasibility study of real-time three-dimensional intracardiac echocardiography for guidance of interventional electrophysiology, Pacing Clin Electrophysiol 25:351–357, 2002; and Knackstedt C, Franke A, Mischke K, et al: Semi-automated 3-dimensional intracardiac echocardiography: Development and initial clinical experience of a new system to guide ablation procedures, Heart Rhythm 3:1453–1459, 2006.)


Baseline Image Acquisition Using Intracardiac Echocardiography


ICE catheters range in size from 7 to 10 Fr and can be inserted from a femoral or subclavian venous approach. Typically, right atrial entry is achieved under fluoroscopic guidance, although ultrasound-guided placement from a subclavian approach has been used in some centers. In general, given the catheter dimensions and flexible yet firm tip, fluoroscopic guidance is strongly recommended to avoid vascular damage. In our experience, 3% of ICE catheter placements could not be achieved from a femoral approach, even with fluoroscopy, because of venous tortuosity. Although direct right atrial placement is feasible, left atrial and right ventricular placements typically require guiding sheaths. The former requires TSC, usually with a puncture of the interatrial septum at the fossa ovalis. The latter requires placement of a Mullen’s sheath over a guidewire in the right ventricle.


Passage of the ICE catheter into the right atrium allows the initiation of baseline imaging of cardiac structures.6 Baseline imaging requires visualization of the right atrium, the tricuspid valve, and the right ventricular inflow tract in the first image set. This is usually accomplished from a low to mid-right atrial placement of the phased-array transducer with the catheter body parallel to the spine. Tricuspid valve motion and trabeculation of the right ventricle and its inflow tract are identified. The coronary sinus ostium, the triangle of Koch, and the crista terminalis can also be imaged by sweeping and torquing the transducer viewing sector. The transducer can then be deflected and retroflexed to a septal imaging view in this location. On occasion, the transducer may need to be advanced or withdrawn to achieve good septal imaging. The fossa ovalis and its muscular margins are clearly seen. Aortic root and valve imaging is usually best achieved in a more superior right atrial location with retroflexion of the ICE transducer. Transducer imaging depth may be adjusted to achieve imaging of the left atrial pulmonary vein and LAA as well. Left atrial wall thickness and change in tissue image may be used to assess the extent of ablation, as can microbubble formation. The transducer may have to be deflected to visualize the ostia of the pulmonary veins and the appendage. It is important to torque the ICE catheter body to fully scan the left atrium from the superior to the posterior aspect to the inferiorly located mitral valve to look for thrombus, intracavitary echoes or “smoke,” and septation such as in cor triatriatum. Pulmonary vein antra and ostia require care and imaging depth adjustment for optimal visualization from the right atrium. In contrast, rotational ICE catheter systems require a systematic scan from the superior to inferior right atrium for right atrial structure identification. Trans-septal puncture is not required for phased-array systems, but rotational ICE catheters need to be placed in the left atrium for adequate imaging, and the phased-array catheter may need trans-septal placement for mitral valve or left ventricular interventions. Right ventricular placement is useful for left ventricular imaging as well as in ventricular wall motion analysis, optimization of cardiac resynchronization therapy, and smoke or thrombus identification.


A complete ICE evaluation includes physiological information obtained from Doppler studies of the septum, including color-flow imaging, mitral, aortic and tricuspid valves, as well as pulmonary vein and LAA flow velocity measurements. A saline contrast injection may be performed to assess left-to-right shunts. Anatomic abnormalities such as an inter-atrial septal aneurysm may be more clearly defined with contrast or flow imaging. Additional views for imaging the LAA may be achieved from the coronary sinus or left pulmonary artery. In ventricular studies, septal to posterior wall motion delay can be used to assess intraventricular dyssynchrony. Intracavitary smoke and thrombi can be detected. Ascending and descending aortic imaging can be performed from the aortic valve and left atrial imaging sequences for plaque. Doppler flow in the ascending aorta can be used to optimize cardiac resynchronization therapy.


Anatomic accuracy has been judged by comparing ICE imaging to computed tomographic (CT) angiography. Jongbloed et al noted a high degree of concordance between the two methods for left atrial structural anatomy such as pulmonary vein anatomy and ostial and antral configurations and dimensions.7 One prospective clinical trial has assessed ICE imaging compared with transesophageal echocardiography (TEE).8 In unpaired analyses, an atrioseptal aneurysm was detected by TEE in 4 (9%) of 45 patients with TEE and in 5 (15%) of 34 patients with ICE. In paired analyses, there was no atrioseptal defect identified by either technique. The percentage concordance in paired analysis for the presence of a patent foramen ovale was 100% and 96% for atrioseptal aneurysms with the two techniques, respectively. Ascending aortic plaques were more often visualized by TEE, but descending aortic plaques were more often visualized by ICE. However, concordance between the two methods was quite modest, especially when plaque size was considered. Dense smoke, thrombus, or aortic plaque can potentially influence interventional procedures and should be carefully examined.


Use of Intracardiac Echocardiography to Guide Electrophysiological Procedures


Evaluation of the Left Atrium and Left Atrial Appendage


ICE can be used for anatomic and functional evaluation of the left atrium and its appendage with ultrasound imaging and Doppler flow measurements. For phased-array systems, imaging frequency must be optimized by the operator by using adjunctive gain, depth, and focal length controls to define anatomic structures and to minimize noise. Imaging can be performed at different levels in the right atrium if needed. Intracardiac physiology in the region of the appendage, mitral valve, and interatrial septum is examined with color-flow and spectral Doppler. Rotational systems require trans-septal puncture for imaging these structures. ICE can be used for evaluating chamber structure, malformations, spontaneous echo contrast, and thrombus. In addition, pulmonary vein antra and ostia as well as mitral valve function can be evaluated anatomically and functionally with Doppler flow measurements.


The left atrial cavity is visualized as an echo-free chamber, and the appendage is typically seen arising at the inferolateral aspect of the sector. Muscular ridges and trabeculation may be seen at the appendage base or even body. These must be carefully differentiated from thrombi. The pulmonary veins arise in the superior and inferior aspects. The pulmonary vein ostia are clearly seen, and flow rates and patterns in the veins can be defined. For example, mitral regurgitation can reverse flow in the veins during color-flow mapping. Pulmonary vein stenosis can increase flow rates because of stenotic obstruction. Thus changing flow velocity is a useful adjunct in the diagnosis of this condition. Actual visualization of the stenosis is more difficult and requires contrast studies.


Left atrial visualization for chamber diameter or wall thickness is not routinely performed with ICE, but very large chamber dimensions may preclude complete ICE imaging. Importantly, the proximity of the esophagus and the left atrium can influence posterior left atrial interventions. The esophagus can be visualized in posterior left atrial imaging when torquing the catheter to a medial view. The cavity of the left atrium is well visualized by ICE. The most common abnormality is the presence of spontaneous echocardiographic contrast, which is defined as slow-moving, continuous echoes, indicating a low-flow state, swirling slowly within the structure cavity. When present, the gain should be systematically decreased to exclude noise artifacts caused by excessive gain. This contrast can be graded as dense contrast when contrast continuously fills the entire cavity of the structure and does not clear with cardiac cycle or as mild contrast when intermittent contrast is seen, often in only part of the structure. Intracavitary thrombi can be visualized. A thrombus in the left atrium or appendage can be seen as a dense well-circumscribed mass, which is usually immobile or can show varying degrees of mobility with a pedicle. It is acoustically distinct from the underlying endocardium or trabeculations. A thrombus is definitely present when it is well visualized in two or more views or may be suspected when seen only in one view. To fully visualize the LAA, two or more views are preferred, and it may be necessary to open the mouth and body of the appendage for inspection. Trabeculations may be common at the mouth and mimic a thrombus. Comparison among views is important for the accurate differentiation of thrombi from muscular ridges and trabeculations.


In the Intra-Cardiac Echocardiography–Guided Cardioversion to Help Interventional Procedures (ICE-CHIP) study, comparison with TEE showed no significant difference in the presence of spontaneous echo contrast between ICE and TEE during left atrial imaging, but there was a significantly greater incidence of spontaneous echo contrast in the appendage detected with TEE compared with ICE (P = .005).8 Percentage concordance for the presence of spontaneous echo contrast was 65% for the two techniques for the left atrium and 60% for the two techniques of the LAA. Dense contrast was seen in the left atrium in 12.5% of ICE studies and 16.9% of TEE studies. In the LAA, dense contrast was less common with ICE (ICE, 5.3% vs. TEE, 15.7%). The LAA is visualized with both techniques, and the presence of spontaneous echo contrast in both the left atrium and the LAA is clearly seen. Intracardiac thrombus was uncommonly seen with both techniques (TEE, 6.9% vs. ICE, 5.2%) with a percentage concordance for the presence or absence of thrombus of 97% in the left atrium and 92% in the LAA. Probable thrombus in the left atrium was actually detected more frequently by ICE, but the presence of thrombi in the appendage was more frequently detected or reported with TEE. In view of this, ICE should be complemented with TEE for LAA thrombus, particularly if limited views and poor-quality images are obtained. Other approaches, such as coronary sinus placement of the ICE probe, have been suggested to improve appendage imaging, particularly if ablation or cardioversion of AF is contemplated.9


Other findings may have implications for thrombus presence or development after intervention or cardioversion. In the ICE-CHIP study, all patients with left atrial or appendage thrombus had dense or moderate smoke in the cavity. Thus the absence of spontaneous echo contrast is an important negative finding in assessing thrombotic risk. Low appendage flow velocities are typically present in patients with thrombi. Thus a Doppler flow measurement would have value in assessing risk.

Stay updated, free articles. Join our Telegram channel

Aug 12, 2016 | Posted by in CARDIOLOGY | Comments Off on Imaging in the Electrophysiology Laboratory: Intracardiac Echocardiography

Full access? Get Clinical Tree

Get Clinical Tree app for offline access