Fig. 24.2 (a) Left ventricular hypertrophy (LVH), not associated with repolarization changes. Sinus rhythm, normal P wave, PR interval, QRS axis (+80°). Lead II = 20 mm, S in V2 + R in V5 = 47 mm (normal ≤ 45 mm). No ST/T changes. ECG from a man with severe hypertension. (b) Left ventricular hypertrophy with repolarization changes. Lead V5 from a patient with hypertensive heart disease. This complex shows a slightly broad P wave, normal PR interval. Prominent Q wave, due to septal depolarization, great increase in R wave size (40 mm), and ‘reverse-tick’ T wave inversion. These three findings are pathognomonic for LVH.
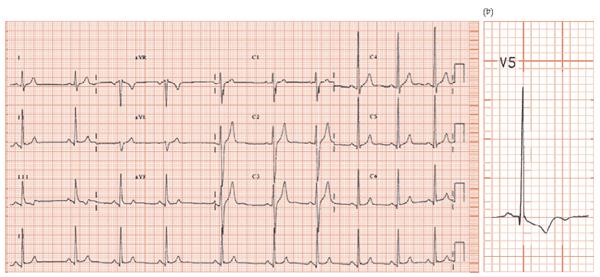
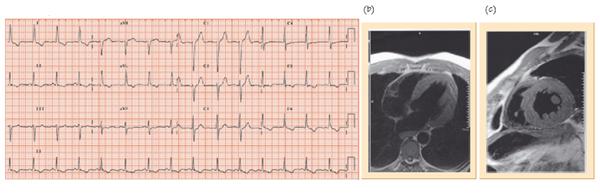
Fig. 24.3 (a) Left ventricular hypertrophy (LVH), repolarization criteria, no voltage criteria. Sinus rhythm, normal P wave, PR interval. QRS complex normal size throughout. Lateral lead ‘reverse-tick’ T wave inversion (lead I, II, aVL, ±V4, V5/6). This ECG could have come from a patient with an acute coronary syndrome, but coronary angiography was normal. Cardiac magnetic resonance imaging (MRI) (b,c) shows gross increase in left ventricular mass to twice normal size.
Hypertension, though difficult to define, diagnose and treat, underlies many strokes, myocardial infarcts and much heart failure. The ECG is useful in measuring:
- The severity of hypertension induced vascular damage (ECG left ventricular hypertrophy [LVH]).
- The response to treatment, by measuring the decrease in ECG LVH, and normalization of repolarization abnormalities.
- Arrhythmic complications.
Hypertension-induced vascular damage assessment
Stay updated, free articles. Join our Telegram channel

Full access? Get Clinical Tree


