Over the past two decades, our understanding of encephalopathic EEG patterns has fundamentally changed. In the past, EEGs were recorded in discrete 20-minute studies that usually demonstrated a single dominant pattern—such as generalized delta slowing, triphasic waves, generalized suppression, or generalized periodic discharges (GPDs). With the ability to record prolonged continuous EEGs over one or more days, our perspective has broadened, with recognition of new challenges. The EEG is dynamic and complex, frequently demonstrating several patterns that wax and wane or change over time. It is also clear that electrographic seizures and status epilepticus (SE) are not uncommon, and at times are challenging to distinguish from other encephalopathic patterns.
Study duration is not the only thing that has changed our perception of the EEG of encephalopathy. A significant number of EEGs in encephalopathic hospitalized patients are now performed in an intensive care unit (ICU). These patients frequently have several factors contributing to their clinical and electrographic encephalopathy. The underlying infectious, metabolic, toxic, hypoxic, vascular, or postsurgical conditions for which they are hospitalized may cause generalized or focal abnormalities. Continuous intravenous infusions of anesthetic medications and analgesics are widely used, and cause generalized EEG changes. The increasing use of therapeutic hypothermia is another intervention that results in encephalopathic EEG patterns. In this complex setting, the relative contributions of the various potential etiologies may be difficult to determine.
THE UTILITY OF EEG MONITORING
Continuous EEG monitoring is a valuable tool in the assessment of coma, as it can detect changes in cerebral function with subtle or absent clinical manifestations. Vasospasm, hemorrhage, elevation of intracranial pressure, nonconvulsive seizures and SE are all treatable conditions that are potentially detectable with EEG. Changes in EEG parameters, when appropriately interpreted, can alter clinical management and influence outcome. While some encephalopathic EEG findings are nonspecific with regard to etiology, certain patterns such as triphasic waves may prompt an evaluation for metabolic or toxic disorders. The appearance of a new or unexpected lateralized EEG abnormality should raise concern for a structural lesion or focal ischemia (1). EEG monitoring is frequently performed to identify seizures so that treatment can be initiated. EEG is also useful for determining trends (is the encephalopathy improving or worsening?), assessing response to treatment with antiepileptic drugs (AEDs), monitoring depth of sedation, and assessing prognosis.
EEG DESCRIPTION AND INTERPRETATION
Just as the term encephalopathy encompasses a range of clinical states, so the EEG in encephalopathy demonstrates a variety of patterns (Table 7.1). It can be challenging to translate a complex EEG pattern into words. Table 7.2 lists parameters that are useful in describing generalized encephalopathic patterns. Accurate description and interpretation of the key features of an EEG rely on some or all of these parameters.
EEG Patterns Frequently Associated with Generalized Encephalopathy
Generalized slowing (theta and/or delta activity, intermittent rhythmic delta activity) |
Generalized fast activity (alpha and/or beta activity), sometimes with intermixed slower frequencies |
Generalized ictal activity |
Periodic discharges |
Triphasic waves |
Generalized suppression |
Burst suppression |
Descriptive Parameters for Generalized Encephalopathic Patterns
Parameter | Examples of Descriptors |
Distribution | Generalized, bifrontally predominant, occipitally predominant, midline predominant |
Frequency | Delta, theta, alpha, beta (specify in Hertz or provide a range) |
Amplitude | Voltage ranges of the predominant frequencies, in microvolts (or millivolts if appropriate) |
Occurrence | Continuous, nearly continuous, discontinuous, periodic, intermittent, randomly occurring, waxing and waning, fluctuating, evolving, stimulus-induced. If bursts are present, specify typical time interval, or range of time intervals, between bursts |
Duration | Time in seconds, minutes, or hours, that a pattern is present |
Reactivity | Change in voltage, frequency, periodicity, rhythmicity or other parameter, in response to stimulation, OR specify absence of EEG change with stimulation. Identify the stimulus given: passive eye opening, spontaneous eye opening, auditory, tactile, or painful stimulation, suctioning, etc. |
Waveform | Triphasic wave, spike-and-wave, slow wave, polymorphic, monomorphic. When appropriate, describe number of phases, sharpness, and/or polarity |
Regulation | Rhythmic, nonrhythmic, evolving. If evolution is present, describe changes in frequency, voltage, or location over time |
Symmetry | Symmetric or asymmetric. Compare homologous regions of left and right hemispheres with regard to above parameters |
Synchrony | Synchronous or asynchronous between the hemispheres (refers to specific activities such as bursts, sharp or slow wave discharges, or spindles) |
While the EEG remains an exquisitely sensitive tool for identifying encephalopathy and evaluating the degree of cerebral dysfunction, few EEG patterns are pathognomonic for a specific diagnosis, and accurate interpretation of the encephalopathic EEG requires knowledge of its clinical context. The potentially reversible effects of drugs, hypothermia, and some metabolic conditions are frequently associated with EEG findings that, in a different clinical setting, might portend a guarded or poor prognosis. Ideally, the electroencephalographer should know the patient’s age, temperature, clinical state of consciousness, medications, and the clinical history in order to provide a useful EEG interpretation. Table 7.3 lists some of the more common clinical correlations of encephalopathic EEG patterns.
Common Clinical Correlations of Encephalopathic EEG Patterns
EEG pattern | Common Clinical Correlations |
Generalized theta slowing | Metabolic disturbance, sedation, systemic infection, dementia |
Intermittent rhythmic delta activity | Metabolic disturbance, midline or deep hemispheric lesion, increased intracranial pressure |
Continuous high-voltage delta slowing | Diffuse subcortical white matter dysfunction, metabolic encephalopathy, traumatic brain injury, sepsis, diffuse encephalitis |
Prominent beta activity | Medication effect (especially from benzodiazepines or barbiturates), alcohol withdrawal |
Alpha coma | Drug-induced coma, brainstem lesion, anoxic encephalopathy |
Triphasic waves | Metabolic encephalopathy (hepatic dysfunction, renal failure, hyponatremia), anoxia, sepsis, degenerative disorders, Creutzfeldt-Jakob disease |
GPDs | Severe metabolic disturbance, anoxic encephalopathy, drug overdose, late SE, barbiturate withdrawal |
Generalized ictal activity | Coma, subtle signs of seizure activity (e.g., rhythmic eye movements, twitches of one or more limbs) (see Table 7.4) |
Burst suppression | Anesthetic medications, anoxic encephalopathy, hypothermia, drug intoxication |
Generalized suppression | Anesthetic medications, hypothermia, anoxic encephalopathy, severe diffuse traumatic brain injury |
Electrocerebral inactivity | Deep anesthesia, hypothermia, brain death |
Localization
EEG patterns correlate, to some extent, with anatomic localization. While decreased amplitude or frequency of the posterior dominant rhythm indicates mild cortical dysfunction, subcortical white matter dysfunction is associated with polymorphic delta activity or triphasic waves. Slowing of the posterior dominant rhythm with intermixed arrhythmic delta activity indicates cortical and subcortical dysfunction. The EEG manifestation of brainstem dysfunction is variable, and may consist of rhythmic or arrhythmic delta slowing, diffuse spindle activity, or impaired patterns of arousal (2). Electrographic seizure activity is considered a cortical pattern, although rhythmic generalized spike-wave activity, as seen in absence seizures, is influenced by thalamic oscillations and subcortical activity (3).
Reactivity
Reactivity indicates a reproducible cerebral response to an environmental stimulus. The change in EEG parameters varies widely between patients and baseline EEG pattern. Frequency, amplitude, or both may increase or decrease in response to stimulation. With mild encephalopathy, slow waves often attenuate as an alerting response. A paradoxical arousal response occurs when higher-voltage generalized delta activity occurs following stimulation (Fig. 7.1). In general, any reactivity to stimulation indicates a less severe level of encephalopathy than absence of reactivity (4). With worsening encephalopathy, the EEG becomes less reactive, and as it progresses into the delta frequency range, or becomes suppressed, there may be no response to stimulation.
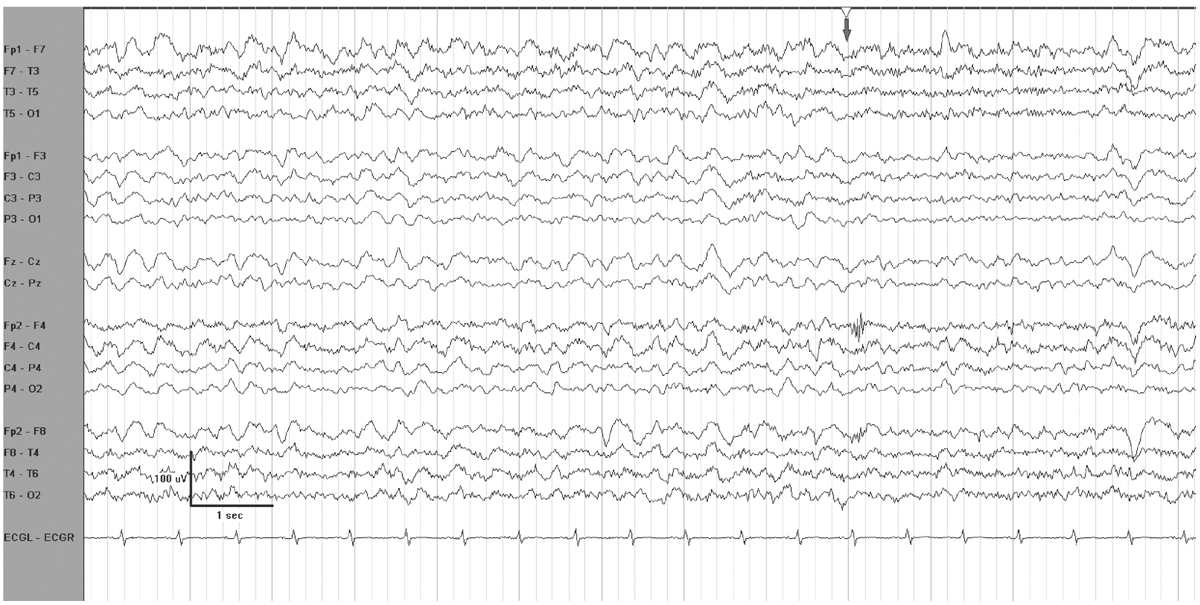
Figure 7.1: EEG reactivity in an encephalopathic patient. The grey arrow at the top indicates when the patient was stimulated. There is attenuation of voltage and of delta activity.
In critically ill encephalopathic individuals, an alerting stimulus may elicit an EEG change with characteristics shared by ictal discharges. The reproducible occurrence of this phenomenon is termed SIRPIDs (stimulus-induced rhythmic, periodic, or ictal discharges) (Fig. 7.2) (5). Concurrent video recording allows clinical correlation with these EEG changes, and helps to distinguish SIRPIDs from spontaneous electrographic seizures. For example, a recurrent pattern that initially appears to be a generalized spontaneous ictal discharge may, on video review, turn out to be recurrent SIRPIDS associated with intermittent suctioning. SIRPIDs, and other patterns of EEG reactivity, may or may not be associated with clinical manifestations of alerting.
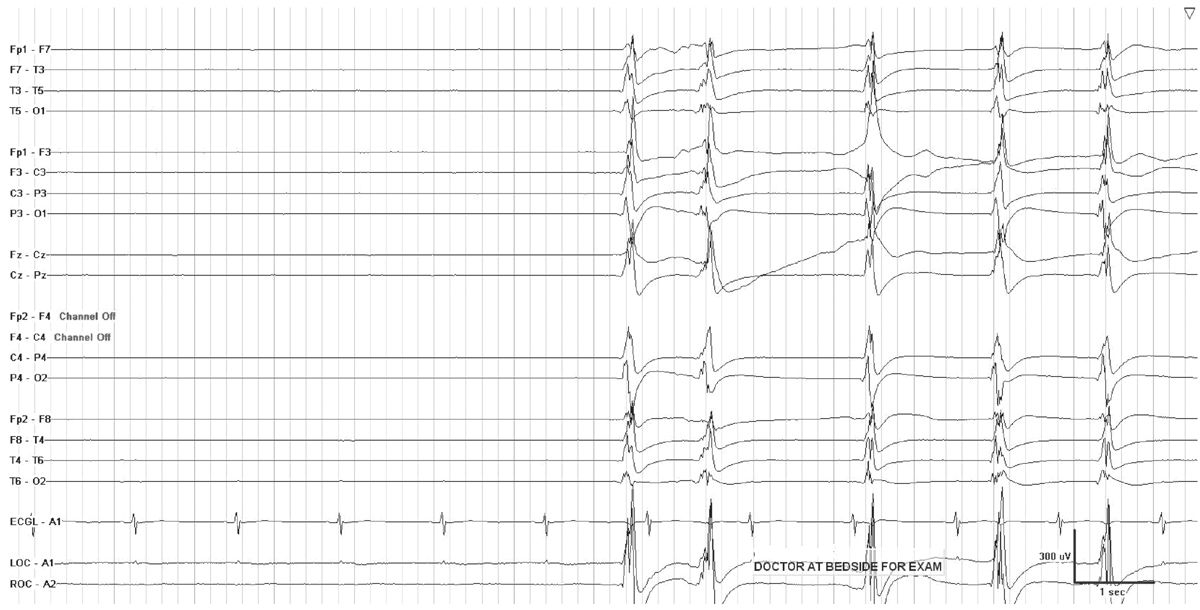
Figure 7.2: SIRPIDs in the setting of generalized suppression. GPDs occur when the patient is stimulated during examination.
Generalized Slowing
The earliest sign of mild encephalopathy on EEG is usually slowing of the alpha rhythm. With further clinical impairment, slow wave activity becomes intermixed, and eventually predominates. Generalized delta slowing occurs as the encephalopathy progressively worsens. Patterns of burst suppression, generalized suppression, or GPDs usually correlate with deep coma.
Two very common contributors to coma in the ICU—drugs and metabolic problems—share mutual EEG features. Anesthetics, sedatives, and narcotic analgesics frequently appear on the medication lists of comatose patients. Some degree of metabolic abnormality is almost ubiquitous in ICU patients. EEG changes due to metabolic coma resemble patterns occurring with anesthesia, and not surprisingly, the EEG in both situations is abnormal and dynamic, modulating over time to reflect the degree of cerebral dysfunction.
The sequence of EEG patterns seen in response to anesthetic drugs presents a paradigm for EEG progression in coma due to worsening metabolic status (6). With light anesthesia, there is desynchronization, or fast activity. As anesthetic dose increases, voltage and rhythmicity increase. Higher voltage, slower frequencies become intermixed with fast activity, and delta activity gradually becomes more prominent. As anesthesia deepens, burst suppression occurs, and the duration of suppression gradually lengthens. With further escalation of the anesthetic dose, generalized suppression persists without bursts, and ultimately the EEG becomes isoelectric.
With worsening metabolic abnormalities, the EEG evolves in a manner comparable to the EEG response to anesthetics. The reverse may also be true. Just as the EEG returns to baseline when anesthetic drugs are tapered and discontinued, even severe EEG abnormalities may resolve as metabolic parameters improve. Slowing and suppression are also potentially reversible with septic encephalopathies and drug overdoses. Although other nonmetabolic causes of encephalopathy, such as cerebral anoxia, may also mirror the “anesthetic model” of EEG changes, with deterioration to a depressed EEG, neuronal death occurs in these cases and the EEG changes are irreversible.
Generalized Theta Activity
Generalized reactive theta slowing frequently occurs in the setting metabolic or drug-induced encephalopathy (Fig. 7.3). Indicators of wakefulness, such as eye blink artifacts, or posterior dominant rhythm may be present. Even when the patient is not awake, the EEG is often reactive, demonstrating either a change in frequency and/or voltage to stimulation. A reactive pattern in a mildly encephalopathic individual has very different implications from nonreactive theta coma. Theta coma following anoxic injury is usually grouped with alpha coma, as it has a similar prognosis, which depends on the etiology of the coma (7). While the majority of patients with nonreactive theta coma die or remain vegetative, some do recover (6).
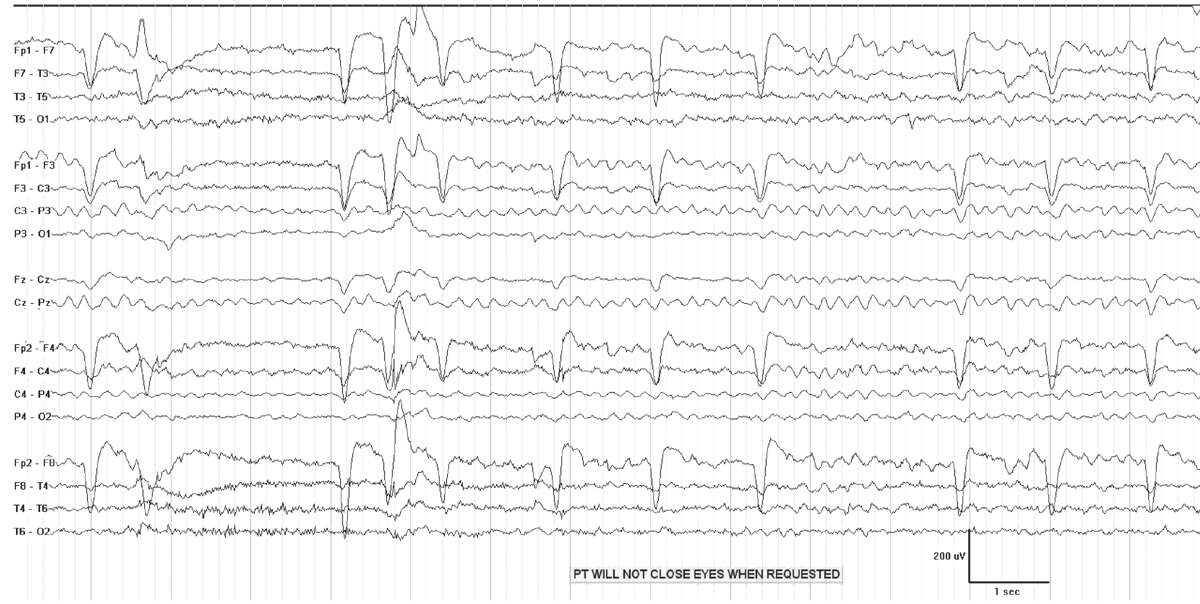
Figure 7.3: Generalized theta slowing in a patient with metabolic encephalopathy.
Generalized High-voltage Delta Activity
Generalized high-voltage delta slowing in the setting of coma is typically polymorphic, with a frequency of 1 to 2 Hz. This pattern reflects a deeper stage of coma than intermittent delta patterns or triphasic waves, and may demonstrate reactivity to stimulation with attenuation or accentuation. With deepening coma, delta activity becomes nonreactive and slower. This pattern occurs in the setting of subcortical white matter lesions, or metabolic encephalopathy (8). A focal lesion of one hemisphere can cause generalized but asymmetric delta activity, due to a secondary effect (from edema, or mass effect, for example) on the other hemisphere.
Rhythmic Delta Activity
Intermittent rhythmic delta activity (IRDA) occurs in encephalopathic patients, and consists of runs of high-voltage rhythmic 2- to 3-Hz activity recurring at irregular intervals, on a background of mild to moderate generalized theta slowing (Fig. 7.4). Bursts are synchronous and most often bilateral, although they may be asymmetric or unilateral. IRDA is characteristically frontally predominant in adults, and attenuates with eye opening or alerting. The proposed standardized research nomenclature for IRDA that comprises 1% to 10% of an EEG is “occasional brief 2 per second generalized rhythmic delta activity,” and it may be further qualified as frontally predominant (9).
Figure 7.4: FIRDA in a young patient with a pituitary tumor. There is generalized theta activity, with intervals of 2-Hz generalized rhythmic delta activity.
Clinical Correlation
Rhythmic delta activity was first described by Cobb (10) in 1945. Using just two EEG channels, he documented rhythmic slow activity in patients with tumors and acute head injuries. Subsequent early studies described frontal intermittent rhythmic delta activity (FIRDA) in association with tumors of the posterior fossa and third ventricle, deep midline lesions, and hydrocephalus (11–13). More recent retrospective studies report the occurrence of FIRDA in patients with a wide range of encephalopathic conditions, in those with focal structural lesions, and in the setting of diffuse brain injury in combination with metabolic disturbances (14–16). Although FIRDA is considered a projected rhythm from deep structures, its origin is unclear, and possible sources in the reticular activating system or the dorsomedial nucleus of the thalamus have been hypothesized (12).
A prospective controlled study identified FIRDA in 6% of EEG recordings, and concluded that its occurrence should initiate a workup for toxic or metabolic abnormalities, or for a structural lesion (17). Asymmetric FIRDA, in particular, suggests underlying focal pathology. Although the laterality of the lesion cannot be reliably identified, Accolla et al. found higher-amplitude FIRDA on the side of the lesion in six of eight patients. Occasionally, FIRDA occurs during hyperventilation or during drowsiness in normal subjects. While FIRDA is considered a nonepileptiform pattern, IRDA over nonfrontal brain regions has distinct clinical implications. Occipital IRDA occurs primarily in children with absence epilepsy, while temporal intermittent delta activity is associated with temporal lobe epilepsy.
PERIODIC PATTERNS
Generalized Periodic Discharges
A periodic pattern consists of “a stereotyped recurrence of paroxysmal complexes at relatively fixed intervals” (18). GPEDs (generalized periodic epileptiform discharges) is not an entirely accurate acronym for all periodic patterns, because not all are definitively epileptiform. Thus the term “generalized periodic discharges” is now considered to be more appropriate. The interval between complexes generally lasts one to several seconds (19) (Fig. 7.5). The waveform itself may be a sharp wave, spike, sharply contoured slow wave, or more complex polyphasic discharge, but within a given EEG, it usually demonstrates a relatively consistent morphology and duration. The waveform stands out from background activity, which is typically suppressed or of low voltage. GPDs may have additional superimposed rhythmic activity of any frequency, and the pattern is then referred to as “GPDs-plus” (9). Periodic patterns may occur with a generalized, lateralized, or focal distribution.
Figure 7.5: Generalized 1-Hz periodic discharges in a patient with anoxic encephalopathy following cardiac arrest.
Clinical Correlation
While focal periodic patterns signify an underlying focal lesion, such as a stroke, tumor, or localized encephalitis, a generalized periodic pattern does not imply a specific disease state. It commonly occurs in the setting of severe acute or subacute encephalopathy from a variety of causes. Cerebral hypoxia or anoxia, anesthetic or sedative drugs, hypothermia, and nonconvulsive status epilepticus (NCSE) frequently cause GPDs. Other etiologies include diffuse encephalitis, sepsis, and severe metabolic encephalopathies (18). Periodic patterns may appear during drug overdoses (barbiturates, baclofen, and other psychotropic substances) or in withdrawal states (20,21). Noncerebral factors that can mimic periodic patterns include artifacts from ventilators, palatal myoclonus, facial twitching, and electrocardiogram.
Uncommon causes of periodic patterns include subacute sclerosing panencephalitis (SSPE) and Creutzfeldt-Jakob disease (CJD). Distinctive periodic patterns in the appropriate clinical setting may be diagnostic of these rare entities (22). In SSPE, a long interval separates very high-voltage periodic discharges or polyphasic bursts (19). The interburst intervals last 4 to 30 seconds, while the burst duration is 0.5 to 3 seconds. Early in the course of SSPE, periodic discharges may be unilateral or bilateral. In ambulatory patients, they typically occur every 5 to 7 seconds (23). The activity during the interburst interval is not always suppressed, although it may appear to be at the low sensitivity required to view the 200- to 1,500-μV complexes. In one study, the EEG background remained normal when the interburst interval exceeded 7 seconds, but became abnormal as the complexes became more frequent (24). As the disease progresses, periodic discharges occur more frequently, and are time-locked with mycolonic jerks. These discharges disappear late in the course of the disease.
A shorter interval between discharges typifies the periodic patterns of CJD. These patients present with rapidly progressive dementia, and may have startle myoclonus. Generalized slowing characterizes the EEG of early CJD. Within several months, periodic discharges appear. They are usually generalized, but occasionally are unilateral or asymmetric, and occur about once per second (19). The interburst interval varies between 0.5 and 4 seconds. Myoclonus, when present, is not time-locked to the periodic discharges. One important caveat is that new variant CJD is not associated with periodic discharges, and despite severe cognitive disturbances, distinctive EEG patterns may be absent (25).
Prognosis
The prognosis of a generalized periodic pattern depends on its etiology. Cardiac or respiratory arrests are common precursors to anoxic encephalopathy and a generalized periodic EEG pattern on a suppressed background. This pattern is strongly, but not invariably, associated with a poor outcome (26). The false-positive rate for poor outcome in these cases is about 3%, which is considered insufficiently accurate for prediction of clinical outcome. However, when GPDs are associated with myoclonic SE within 24 hours of a primary circulatory arrest, the prognosis is invariably poor (26). In myoclonic SE, myoclonic jerks are synchronized with periodic discharges or bursts. At times, it is difficult to determine whether EEG discharges originate in the brain, the muscles, or both. Administering a single dose of a neuromuscular blocking agent to an unconscious mechanically ventilated patient with myoclonus helps to distinguish myoclonic artifact from cerebral activity. The presence of neuromuscular blockade can also obscure the recognition of myoclonic SE, by inhibiting its clinical manifestations.
Stay updated, free articles. Join our Telegram channel

Full access? Get Clinical Tree


