Veteran endurance athletes have an increased risk of developing atrial fibrillation (AF), with a striking male predominance. We hypothesized that male athletes were more prone to atrial and ventricular remodeling and investigated the signal-averaged P wave and factors that promote the occurrence of AF. Nonelite athletes scheduled to participate in the 2010 Grand Prix of Bern, a 10-mile race, were invited. Of the 873 marathon and nonmarathon runners who were willing to participate, 68 female and 70 male athletes were randomly selected. The runners with cardiovascular disease or elevated blood pressure (>140/90 mm Hg) were excluded. Thus, 121 athletes were entered into the final analysis. Their mean age was 42 ± 7 years. No gender differences were found for age, lifetime training hours, or race time. The male athletes had a significantly longer signal-averaged P-wave duration (136 ± 12 vs 122 ± 10 ms; p <0.001). The left atrial volume was larger in the male athletes (56 ± 13 vs 49 ± 10 ml; p = 0.001), while left atrial volume index showed no differences (29 ± 7 vs 30 ± 6 ml/m 2 ; p = 0.332). In male athletes, the left ventricular mass index (107 ± 17 vs 86 ± 16 g/m 2 ; p <0.001) and relative wall thickness (0.44 ± 0.06 vs 0.41 ± 0.07; p = 0.004) were greater. No differences were found in the left ventricular ejection fraction (63 ± 4% vs 66 ± 6%; p = 0.112) and mitral annular tissue Doppler e′ velocity (10.9 ± 1.5 vs 10.6 ± 1.5 cm/s; p = 0.187). However, the tissue Doppler a′ velocity was higher (8.7 ± 1.2 vs 7.6 ± 1.3 cm/s; p <0.001) in the male athletes. Male athletes had a higher systolic blood pressure at rest (123 ± 9 vs 110 ± 11 mm Hg; p <0.001) and at peak exercise (180 ± 15 vs 169 ± 19 mm Hg; p = 0.001). In the frequency domain analysis of heart rate variability, the sympatho-vagal balance, represented by the low/high-frequency power ratio, was significantly greater in male athletes (5.8 ± 2.8 vs 3.9 ± 1.9; p <0.001). Four athletes (3.3%) had at least one documented episode of paroxysmal AF, all were men (p = 0.042). In conclusion, for a comparable amount of training and performance, male athletes showed a more pronounced atrial remodeling, a concentric type of ventricular remodeling, and an altered diastolic function. A higher blood pressure at rest and during exercise and a higher sympathetic tone might be causal. The altered left atrial substrate might facilitate the occurrence of AF.
There is a growing population of veteran endurance athletes regularly participating in training and competition. Recent data have documented an increased risk of atrial fibrillation (AF) in this population. Most athletes present with paroxysmal AF but some progress to persistent or permanent AF during follow-up. The atrial volume increases with training years, and an increased left atrial volume confers a greater risk of AF in the aging athlete. Arrhythmia occurs mainly in male athletes. In an animal model, long-term intensive exercise training induced atrial fibrosis, ventricular hypertrophy, diastolic dysfunction, and increased AF susceptibility. Signal-averaged P-wave analysis is capable of detecting intra-atrial conduction delay and has been used in patients with and without structural heart disease to identify the risk of paroxysmal AF. We have demonstrated an association between lifetime training hours and a prolongation of the signal-averaged P-wave duration in male nonelite runners. We hypothesized that male athletes were more prone to atrial and ventricular remodeling than their female counterparts. We investigated the signal-averaged P-wave and factors that promote the occurrence of AF in female and male nonelite runners.
Methods
The Grand Prix of Bern is 1 of the most popular 10-mile races in Switzerland, with >25,000 participants. Nonelite athletes were recruited by an open invitation letter published on the 2010 event’s homepage. We included runners with and without a history of former marathon participation, aged ≥30 years. We excluded subjects with a history of hypertension (blood pressure >140/90 mm Hg at rest) or other known cardiovascular diseases, except for episodes of paroxysmal AF. All athletes applied by electronic mail and provided their age and race time. From all applicants, 70 male athletes were randomly selected, and the data on these athletes were reported in another study. The median age and race time of the male runners was used to stratify female athletes in low- and high-age and race time groups. From each of the 4 groups, 17 female athletes were randomly selected, including a total of 68 female athletes. The baseline examination consisted of a comprehensive questionnaire to ascertain the personal and sports history. The calculation of average training hours was determined by the athletes’ estimation and/or exercise diary. The measurement of training years started in adulthood. Lifetime training hours were calculated using the following formula: average endurance and strength training hours per week × 52 × training years. The measurement of heart rate and blood pressure at rest were performed in a quiet room after 5 minutes in the supine position. Additional assessments included electrocardiography, signal-averaged P-wave analysis, echocardiography, cardiopulmonary exercise testing on a treadmill, 24-hour Holter monitoring, and analysis of heart rate variability. Two experienced cardiologists, who were unaware of the athletes’ performance, performed all analyses. All athletes provided written informed consent, and the local ethics committee approved the protocol. 12-Lead electrocardiograms were performed with the subject in supine position and recorded at a paper speed of 25 mm/s (MAC5500, GE Healthcare, Glattbrugg, Switzerland). The method for recording and analyzing a signal-averaged P wave has been described previously. The measurements computed by the system included the filtered P-wave duration in milliseconds and the root mean square voltage in the terminal 20 ms of the P wave (RMS20), expressed in microvolts. In addition, the integral of the P wave was computed. The onset and offset of the P wave were manually adjusted.
Standard transthoracic echocardiography was performed using a S5-1 2.5-MHz transducer (iE33, Phillips Healthcare, Zurich, Switzerland), and the images were stored digitally and analyzed off-line. The left ventricular (LV) dimensions were measured in 2-dimensional M-mode, and the LV mass was calculated. The relative wall thickness was calculated using the formula: (interventricular septum + LV posterior wall)/LV end-diastolic diameter. The left and right atrial and LV volumes were calculated according to current recommendations. The LV ejection fraction was derived from the end-diastolic and end-systolic volumes. The left and right atrial volumes, LV end-diastolic diameter, and LV mass were indexed for the body surface area. Pulsed-wave Doppler was performed in the apical 4-chamber view to obtain the peak early filling (E wave) and late diastolic filling (A wave) velocities, E/A ratio, deceleration time of the early filling wave, and isovolumic relaxation time. Pulsed-wave tissue Doppler imaging was performed in the apical 4-chamber view to acquire peak septal mitral annular velocities (e′ and a′).
Spiroergometric testing was performed using a treadmill. We used a ramp protocol starting at 7.2 km/hour, with the speed increasing 0.2 km/hour every 20 seconds until exhaustion. The athletes were encourage to reach at least a respiratory exchange ratio >1.05. The respiratory parameters were measured continuously in an open spirometric system (CS 200, Schiller-Reomed AG, Dietikon, Switzerland) and registered as the values averaged for 30 seconds. The first (aerobic) and the second (anaerobic) lactate thresholds were determined according to current recommendations. The blood pressure was measured at peak exercise.
An ambulatory electrocardiogram was performed for a 24-hour period. Three channel electrocardiograms were recorded with a Lifecard CF digital recorder (Spacelabs Healthcare, Nuremberg, Germany) and manually analyzed and interpreted using the Pathfinder Software (Spacelabs Healthcare). The premature atrial and ventricular contractions were classified according to onset and QRS morphology. For the analysis of heart rate variability, the program eliminated 1 RR interval before and 2 intervals after each nonsinus beat. Four standard 24-hour time-domain measures were used: the standard deviation of the normal-to-normal intervals, the heart rate variability triangular index, the standard deviation of the average normal-to-normal interval, and the square root of the mean squared differences of successive normal-to-normal intervals. In addition, frequency domain analysis was performed. Three main spectral components were distinguished: very low frequency, low-frequency (LF), and high frequency (HF) components. Vagal activity is the major contributor to the HF component. The LF component reflects both sympathetic and vagal activity. The LF/HF ratio is considered to mirror the sympatho-vagal balance. The LF and HF power components were measured in absolute values of power (ms ) and in normalized units, which represent the relative value of each power component in proportion to the total power minus the very low frequency component. For 24 hours, the first 5-minute period from every hour was recorded. The recordings from 7 a.m. to 10 p.m. were averaged and are reported as the daytime autonomic tone. The recordings from 11 p.m. to 6 a.m. were averaged and are reported as the nighttime autonomic tone.
The data were analyzed using the Statistical Package for Social Sciences software for Windows, version 17.0 (SPSS, Chicago, Illinois). The normality of the quantitative variables was analyzed using the Kolmogorov-Smirnov test. Female and male athletes were compared using the Student t test or Mann-Whitney U test, as appropriate. Categorical data were analyzed using the chi-square test. For correlations of the signal-averaged P-wave duration with the left and right atrial volume, Person’s correlation coefficient was calculated. A 2-sided p value of <0.05 indicated statistical significance.
Results
A total of 381 female and 492 male athletes applied for participation, and 68 female and 70 male athletes were randomly selected. A total of 17 runners had to be excluded (9 could not participate in the race because of muscular problems, 1 had mitral valve prolapse, 3 had undiagnosed arterial hypertension with diastolic dysfunction, and 4 did not undergo the examinations). Thus, 121 runners were entered into the final analysis. No significant gender differences were found in age, lifetime training hours, average endurance and strength training hours per week, number of former marathon participations, or race time. Female athletes had a significantly lower body mass index and body surface area. Four athletes had ≥1 documented episode of AF (3.3%), all were men ( Table 1 ).
| Variable | Female Athletes(n = 61) | Male Athletes(n = 60) | p Value |
|---|---|---|---|
| Age (years) | 43 ± 7 | 42 ± 8 | 0.407 |
| Body mass index (kg/m 2 ) | 20.4 ± 1.7 | 23.4 ± 1.9 | <0.001 |
| Body surface area (m 2 ) | 1.64 ± 0.11 | 1.93 ± 0.13 | <0.001 |
| Previous marathons (n) | 5.9 ± 6.4 | 5.0 ± 7.4 | 0.088 |
| Previous 10-mile races (n) | 9.4 ± 19.2 | 6.5 ± 8.2 | 0.045 |
| Endurance training years | 14.1 ± 7.4 | 14.4 ± 9.1 | 0.840 |
| Endurance training hours/week | 5.3 ± 2.6 | 5.1 ± 3.7 | 0.657 |
| Strength training hours/week | 0.8 ± 0.7 | 0.7 ± 0.8 | 0.454 |
| Lifetime training hours | 4,743 ± 4,029 | 4,598 ± 4,776 | 0.858 |
| 10-mile race time (mm:ss) | 81:13 ± 15:43 | 79:14 ± 11:15 | 0.432 |
| Episodes of paroxysmal AF (n) | 0 (0%) | 4 (6.6%) | 0.042 |
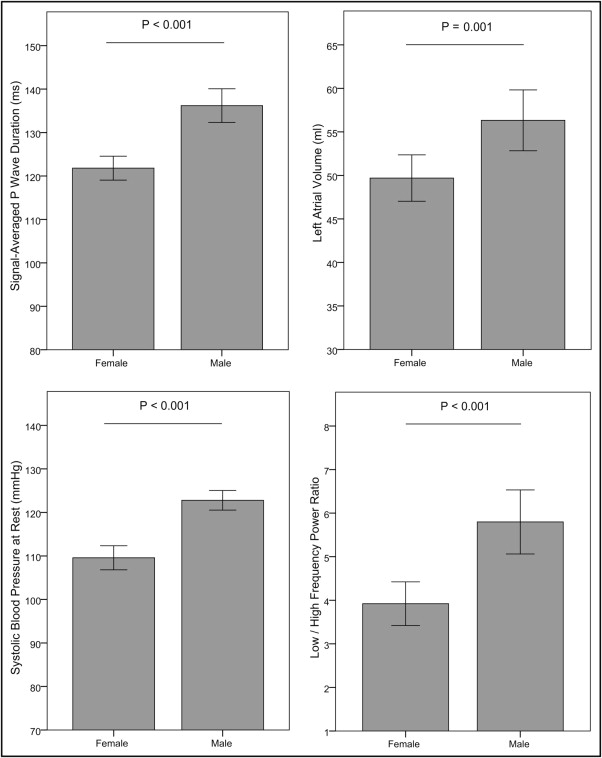
The male athletes had a significantly longer signal-averaged P-wave duration ( Figure 1 ) and a higher integral of the P wave. The terminal 30 and 20 ms of the P wave (root mean square of terminal 30/20 ms of P wave) showed a significantly lower voltage. The proportion of athletes with a RMS20 value of ≤3.0 μV was greater in male athletes (44% vs 18%, p = 0.004). In male athletes, the QRS duration was longer, Sokolov index, and maximum T-wave amplitude in the precordial leads were greater, and the QTc interval was shorter. Significantly more male athletes showed a pattern of early repolarization ( Table 2 ).
| Variable | Female Athletes(n = 61) | Male Athletes(n = 60) | p Value |
|---|---|---|---|
| Signal-averaged P wave (ms) | 122 ± 10 | 136 ± 12 | <0.001 |
| Integral P wave (μVs) | 671 ± 231 | 777 ± 200 | 0.021 |
| Root mean square of terminal 30-ms P wave (μV) | 5.4 ± 2.4 | 4.3 ± 2.2 | 0.035 |
| Root mean square of terminal 20-ms P wave (μV) | 5.2 ± 2.2 | 4.3 ± 2.2 | 0.050 |
| PQ interval (ms) | 157 ± 25 | 165 ± 19 | 0.056 |
| QRS duration (ms) | 88 ± 8 | 100 ± 9 | <0.001 |
| Sokolov index (mV) | 2.6 ± 0.7 | 3.0 ± 0.9 | 0.003 |
| T-wave amplitude (μV) ⁎ | 627 ± 199 | 874 ± 284 | <0.001 |
| QTc interval | 427 ± 19 | 405 ± 23 | <0.001 |
| Early repolarization pattern (n) † | 17 (28%) | 29 (48%) | 0.025 |
⁎ Maximum T-wave amplitude in precordial leads.
The absolute left atrial volume was greater in male athletes ( Figure 1 ), while the left atrial volume index showed no gender differences. Moderate (>34 ml/m 2 ) left atrial enlargement was equally distributed between the male and female athletes and was present in 23% and 23%, respectively. The right atrial volume index was greater in the male athletes. We found a weak correlation of the signal-averaged P-wave duration with the absolute left atrial volume (r = 0.264, p = 0.009) and right atrial volume (r = 0.340, p = 0.001).
The LV mass index was significantly greater in the male athletes, while the proportion of athletes with LV hypertrophy (LV mass index >115 g/m 2 in the men and >95 g/m 2 in the women) showed no significant gender differences (26% in the male vs 21% in the female athletes; p = 0.591). The LV end-diastolic diameter index was greater in female athletes, leading to a lower relative wall thickness. Systolic function showed no gender differences. In the male athletes, the peak a′ was higher and the E-wave deceleration time was longer ( Table 3 ).
| Variable | Female Athletes(n = 61) | Male Athletes(n = 60) | p Value |
|---|---|---|---|
| Left atrial volume index (ml/m 2 ) | 30 ± 6 | 29 ± 7 | 0.332 |
| Right atrial volume index (ml/m 2 ) | 26 ± 7 | 31 ± 8 | <0.001 |
| Interventricular septum (mm) | 9.2 ± 1.1 | 11.2 ± 1.1 | <0.001 |
| Left ventricular end-diastolic diameter (mm/m 2 ) | 28.0 ± 2.8 | 26.0 ± 2.3 | <0.001 |
| Left ventricular posterior wall (mm) | 9.2 ± 1.3 | 10.7 ± 1.0 | <0.001 |
| Left ventricular mass index (g/m 2 ) | 86.3 ± 16.1 | 107.2 ± 16.8 | <0.001 |
| Relative wall thickness ⁎ | 0.41 ± 0.07 | 0.44 ± 0.06 | 0.004 |
| Left ventricular ejection fraction (%) | 66 ± 6 | 63 ± 4 | 0.112 |
| Peak E (cm/s) | 81.4 ± 10.7 | 81.3 ± 13.8 | 0.979 |
| Peak A (cm/s) | 55.9 ± 11.4 | 54.7 ± 10.4 | 0.537 |
| E/A ratio | 1.5 ± 0.3 | 1.5 ± 0.3 | 0.789 |
| Peak e′ (cm/s) | 10.6 ± 1.5 | 10.9 ± 1.5 | 0.187 |
| Peak a′ (cm/s) | 7.6 ± 1.3 | 8.7 ± 1.2 | <0.001 |
| Isovolumic relaxation time (ms) | 82 ± 14 | 87 ± 13 | 0.054 |
| E-wave deceleration time (ms) | 162 ± 25 | 182 ± 29 | <0.001 |
⁎ (Interventricular septum + left ventricular posterior wall)/left ventricular end-diastolic diameter.
Male athletes had a significantly higher systolic ( Figure 1 ) and diastolic blood pressure at rest and a significantly higher systolic blood pressure at peak exercise. No differences were found in the heart rate at rest and heart rate at peak exercise or in the oxygen uptake at the aerobic and anaerobic thresholds. The peak oxygen uptake was greater in the male athletes ( Table 4 ).
| Variable | Female Athletes(n = 61) | Male Athletes(n = 60) | p Value |
|---|---|---|---|
| Heart rate at rest (beats/min) | 56 ± 7 | 55 ± 9 | 0.452 |
| Systolic blood pressure at rest (mm Hg) | 110 ± 11 | 123 ± 9 | <0.001 |
| Diastolic blood pressure at rest (mm Hg) | 68 ± 6 | 77 ± 7 | <0.001 |
| Peak heart rate (beats/min) | 177 ± 11 | 180 ± 9 | 0.103 |
| Peak systolic blood pressure (mm Hg) | 169 ± 19 | 180 ± 15 | 0.001 |
| Peak diastolic blood pressure (mm Hg) | 76 ± 7 | 78 ± 7 | 0.072 |
| Oxygen uptake aerobic threshold (ml/min/kg) | 26.1 ± 4.2 | 27.2 ± 4.8 | 0.189 |
| Oxygen uptake anaerobic threshold (ml/min/kg) | 44.1 ± 6.1 | 45.9 ± 6.8 | 0.138 |
| Oxygen uptake peak (ml/min/kg) | 50.2 ± 6.0 | 53.3 ± 6.7 | 0.011 |
Stay updated, free articles. Join our Telegram channel

Full access? Get Clinical Tree


