Gadolinium-Enhanced MRA
First-pass gadolinium-enhanced MRA has revolutionized the clinical use of MRA (1). It can be performed with just about any MR scanner and produces high-spatial-resolution images with broad anatomic coverage. The contrast agents are safe and provide a valuable alternative to conventional iodine-based contrast agents used in catheter-based and CT angiography, particularly in subjects allergic to iodinated contrast agents.
When compared with alternative approaches such as time-of-flight and phase contrast imaging, gadolinium-enhanced imaging has several advantages. The technique is fast, and it generates images of vessels independently of flow characteristics. Overestimation of severity of stenoses is generally less of a problem with gadolinium-enhanced MRA. Spatial coverage can be broad and, at the same time, spatial resolution of 2 mm or less can be achieved in the time frame of a single breath hold on high-end systems. The method is also versatile and can easily be applied to almost any body part. Disadvantages include the added cost of the contrast agent, requirement for intravenous access, lack of flow direction information (sometimes requiring supplemental time-of-flight imaging), and technical challenges of synchronizing bolus arrival with image acquisition. Despite these disadvantages, for most vascular imaging outside of the brain, gadolinium-enhanced MRA has become the technique of choice.
Although initial applications focused on imaging at a single station (typically a craniocaudal span of 35-45 cm), multistation bolus chase imaging following a single injection of contrast is now commonly used for indications that require greater spatial coverage, such as peripheral MR angiography. New commercial systems that integrate multichannel systems with moving-table technology can perform whole-body angiography from the head to the toes in under one minute. When temporal resolution is critical, ultrafast MR angiographic imaging methods can be used to generate fluoroscopic-type “time-resolved” views akin to conventional angiography. Contrast-enhanced methods can also be applied to image veins.
This chapter reviews the technical considerations for contrast-enhanced MR angiography and discusses pulse sequence optimization. A template for a standard single-station MR angiography protocol is presented. More advanced applications including multistation MR angiography, “time-resolved” imaging, and MR venography are then discussed. The chapter concludes with an overview of common artifacts and pitfalls of gadolinium-enhanced MR angiography.
A collection of gadolinium enhanced MR angiography protocols is listed at the end of the chapter. For some types of studies, multiple protocols are provided in this book; for example, a gadolinium-enhanced carotid MRA protocol is included at the end of this chapter, while an unenhanced TOF protocol is provided in Chapter II-2. Three peripheral MRA protocols for 1.5 T field strength are included; selection depends on the technology available.
KEY CONCEPTS
[right half black circle] First-pass contrast-enhanced MR arteriography requires synchronization of the MR acquisition with first-pass arterial enhancement.
[right half black circle] Interpolation and k-space ordering should match timing schemes for 3D acquisitions.
[right half black circle] Single-station protocols should include at least one black-blood pulse sequence for evaluation of mural and extraluminal pathology.
[right half black circle] Multistation MR angiography can be performed with repeated injections or using bolus chase methods.
[right half black circle] Fluoroscopic-type “time-resolved” MR angiography requires repeated fast acquisitions and is useful for understanding the temporal dynamics of contrast enhancement, including retrograde filling of proximally occluded vessels.
[right half black circle] Contrast-enhanced MR venography can be performed directly or with recirculation techniques.
[right half black circle] Pitfalls and artifacts of MR angiography can be avoided with careful attention to technique.
[right half black circle] Clinical Protocols:
FIRST-PASS CONTRAST-ENHANCEMENT: PRINCIPLES AND CHALLENGES OF TIMING
Principles
For routine contrast-enhanced MR angiography, a bolus of gadolinium contrast is injected intravenously followed by a saline flush, typically through an antecubital intravenous catheter. After passage through the venous circulation, right heart, pulmonary circulation, and left heart, the bolus fills the arteries of interest. The first time the bolus passes through the arterial circulation is referred to as first-pass circulation. Subsequently, after transit through the venous and cardiac circulation again, more dilute versions of the bolus will pass through the artery in concentrations almost equal to those in the veins.
To achieve high-quality gadolinium-enhanced MRA images, three conditions must be met: (a) the concentration of gadolinium contrast material in the arteries must cause sufficient T1 shortening to result in high signal on MR images, (b) the acquisition must be synchronized with the duration of arterial enhancement and precede significant venous enhancement, and (c) artifacts must be avoided. For the first two conditions, the rate of contrast injection, the amount of contrast material, the subject’s cardiac output, and the MR acquisition time are important parameters. Potential artifacts will be discussed at the end of this chapter.
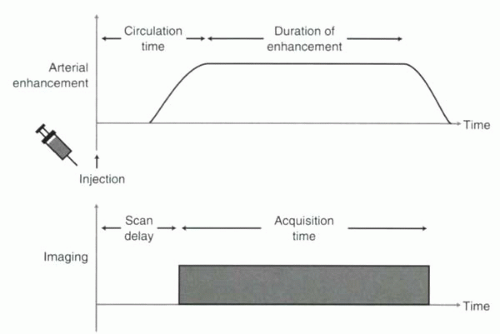
A schematic of the relationship between contrast injection and MR acquisition is shown in Figure II4-1.
The transit time between intravenous injection and arterial enhancement is referred to as circulation time. Circulation times vary considerably, from as little as 8-10 sec in healthy subjects to as long as 50-60 sec in subjects with poor cardiac output. Not long ago, circulation time was used as a bedside index of a subject’s cardiac output. For example, a fluorescent agent was injected intravenously, and the time for that agent to appear in the vasculature of the earlobe was used as an indicator of cardiac function. Variability in circulation times poses a challenge for contrast-enhanced MR angiography because the contrast is injected intravenously, while the vessels of interest are usually arterial and because the bolus volume is relatively small and so the duration of enhancement is short.
Because contrast material is injected intravenously and mixes with unenhanced venous blood, a certain amount of dispersion of the contrast bolus occurs during its transit. The amount of dispersion determines the peak intensity of arterial enhancement. The higher the injection rate, the less dispersion, and the higher the peak gadolinium concentration in the arteries (Figure II4-2). Additionally, the higher the rate of injection, the faster the bolus appears in the artery or the shorter the circulation time. Although higher cardiac output leads to faster circulation, it also is associated with larger circulatory volumes that cause more dispersion of the bolus. Hence, with higher cardiac output, maximal arterial enhancement tends, paradoxically, to be lowered.
Several details related to contrast injection technique need to be considered when performing gadolinium-enhanced MRA, as discussed below.
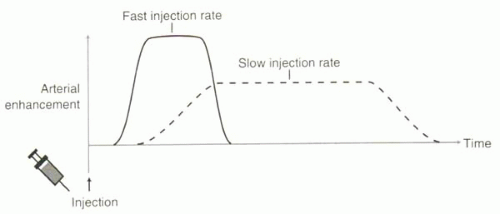 FIGURE II4-2. Faster rates of injection of contrast material result in shorter circulation times, higher intra-arterial gadolinium concentrations, and shorter durations of enhancement. |
[right half black circle] TABLE II4-1 Gadolinium Doses for MR Angiography Based on Subject Weight | ||||||||||||||||||||
|---|---|---|---|---|---|---|---|---|---|---|---|---|---|---|---|---|---|---|---|---|
|
Contrast Dose
As introduced in Chapter I-3, doses of gadolinium contrast material are usually referenced to the subject’s body weight in kilograms (kg). A single dose of gadolinium contrast material refers to 0.1 mmol of gadolinium contrast material per kg of subject body weight. Most commercially available contrast agents are supplied at a high concentration of 0.5 mol/L or 0.5 mmol/mL.
For vascular imaging, the gadolinium doses typically are rounded up based on weight guidelines, within the limit of 0.3 mmol/kg. For example, most adult subjects, regardless of weight, receive a dose of 20 mL for single-station MR angiography. This averages to be about 0.13-0.14 mmol/kg. Table II4-1 summarizes rough guidelines for single- and double-dose gadolinium contrast protocols for subjects of different weights, assuming a commercial preparation with gadolinium concentration 0.5 mol/L. A more detailed chart of precise weight-based gadolinium contrast doses is given in Table I3-1.
IMPORTANT REVIEW POINT:
For most adults, a “single dose” of gadolinium contrast material for MR angiography refers to 20 mL of the commonly available 0.5 mol/L preparation.
The optimal amount of contrast material for a given MRA examination depends on several factors. At the upper bounds, there are regulatory limitations for different contrast agents. The maximum recommended dose for a single gadolinium-enhanced examination is commonly 0.3 mmol/kg. Second, there are cost considerations. Typically, vials of contrast are available in single-use 15 mL and 20 mL doses, and therefore a double dose of contrast material usually requires two bottles and is therefore twice as expensive. Aside from these issues, the tradeoffs between lower and higher doses largely pertain to the ability to fill the entire arterial structure of interest during the acquisition period before venous enhancement. Higher doses favor faster injection rates. For most single-station studies, such as renal artery MRA or carotid MRA, a single dose of contrast material is sufficient. When the vessel of interest is large, such as an abdominal aortic aneurysm, or when the desired field of view is broad, such as a full thoracic and abdominal aortic MRA, then a double dose is preferable. As will be discussed subsequently, multistation studies and recirculation MR venography studies typically require a double dose of contrast material. Time-resolved imaging can be performed with smaller doses, such as 0.05 mmol/kg (half-dose or less).
Special Considerations in the Pediatric Population
When the subject is a small child or infant, the volumes of contrast material can be quite small. For example, a single dose of contrast for a 4.5 kg (10 lb) infant is only 1 mL. Typically in studies of small children, doses of 0.2 mmol/kg are routinely used. The volumes of injection can be increased by diluting the gadolinium contrast drawn from the vial with sterile saline or D5W up to 100%. This allows larger volumes for injection that are easier to handle and ensure sufficient volumes for vascular imaging.
As a point of advice, when infants are mildly sedated, the injection of contrast material at room temperature can cause them to awaken and move during the acquisition. Warming the contrast material prior to injection helps to reduce the likelihood of the infant awakening.
Rate of Contrast Injection
The rate of contrast injection depends on the total amount of contrast to be administered and the duration of the imaging acquisition. In general, the faster the rate of contrast injection, the higher the gadolinium concentration in the arteries, and therefore the brighter the vessels (Figure II4-2). However, the duration of enhancement should match the acquisition times; very fast injections can mean durations of arterial enhancement that are too short for optimal imaging. Also, higher rates of injection require a larger-gauge intravenous catheter.
While injection rates vary among institutions, most centers use an injection rate of 2-3 mL/sec for routine single-station or double-station imaging studies. For multistation studies, such as peripheral vascular MRA, a staged injection may be used, such as 2 mL/sec for the first 10 mL followed by 1 mL/sec for the remaining 20 mL. In theory, the prolonged injection period favors arterial enhancement of the distal vessels during imaging of the second and third stations. In fact, the truly optimized injection protocol probably varies for each individual.
Manual versus Automated Injections and Flush
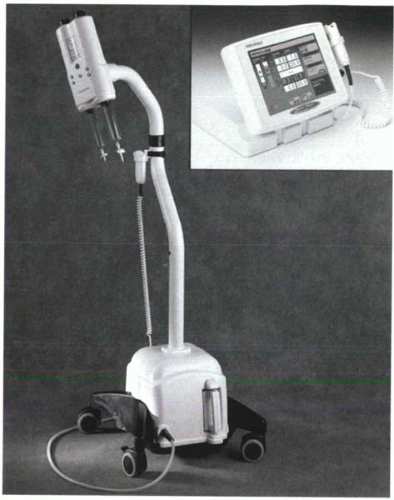
Injections can be performed manually or automatically with commercially available MR-compatible power injectors. Because the gadolinium contrast is viscous, hand injections at rates above 2-3 mL/sec can be difficult depending on the strength of the person performing the injection. Warming the contrast material can reduce its viscosity and facilitate injection. With either manual or automated injections, it is important to follow the gadolinium contrast injection with a saline flush (20 mL) in order to ensure that all the contrast material is cleared from the tubing and veins. Typically the saline flush is administered at the same rate as the gadolinium contrast material. Commercially available MR-compatible injectors have two syringes—one for gadolinium contrast material and the other for saline—and rates of injection are programmable (Figure II4-3).
The Timing Challenge
To accommodate the circulation time, most MRA acquisitions must be delayed from the start of the gadolinium injection by a time referred to as the scan delay (Figure II4-1). The appropriate scan delay must be determined so that peak arterial enhancement is synchronized with the filling of the central lines of k-space. In some applications, centric ordering is used, in which the central lines are acquired early in the acquisition, while in others, sequential ordering is used, and the central lines are collected in the middle of the acquisition (Figure II4-4). Strategies for synchronizing the acquisitions are discussed next.
Strategies for Optimal Timing
There are two main strategies to ensure optimal timing of the MR acquisition with arterial phase enhancement: a test bolus method and bolus detection method.
Test Bolus Method
The principle of the test bolus method is that circulation time can be measured for each individual subject using a small test bolus of the gadolinium chelate (2). By determining circulation time, an appropriate scan delay can be computed. Volumes of 0.5-2 mL are used for the test bolus followed by a 15-20 mL saline flush, both injected at the rate that will be employed for the full contrast bolus. With the start of the test bolus injection, images through the area of interest are acquired at known intervals, typically every second or every other second. The small bolus
of contrast can be visualized as a transient enhancement of the artery of interest. The subject’s circulation time can be determined by identifying the image with maximum enhancement (Figure II4-5).
of contrast can be visualized as a transient enhancement of the artery of interest. The subject’s circulation time can be determined by identifying the image with maximum enhancement (Figure II4-5).
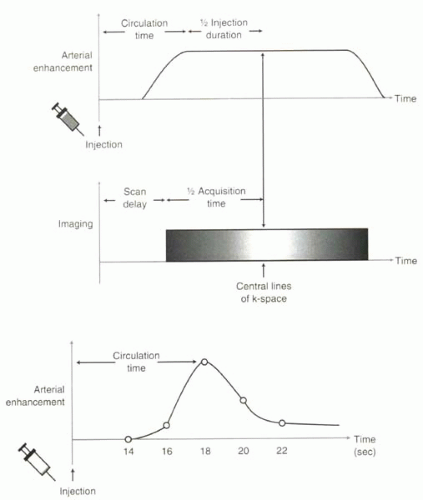 FIGURE II4-4. Synchronizing the MR acquisition with arterial enhancement. The duration of enhancement is assumed to be roughly equal to the duration of the injection. The central lines of k-space should be acquired during peak arterial enhancement. In this example the MR pulse sequence fills k-space in a sequential fashion. |
 FIGURE II4-5. Measurement of circulation time for abdominal aorta using a test bolus timing examination. Imaging is initiated at the start of injection of the test bolus of contrast material. The time of peak aortic enhancement is 18 sec (arrow), so the subject’s circulation time is 18 sec. |
The circulation time is used to determine the scan delay. The specific relationship between the two parameters depends on whether the 3D MRA sequence is designed to fill k-space sequentially or centrically. Some of the formulas that have been offered in the literature are discussed in the following paragraphs.
Sequential k-Space Filling
If k-space is filled sequentially, the central lines of k-space are filled in the middle of the acquisition period (Figure II4-4). Therefore, for a given scan delay, Tscan delay, the central lines of k-space will be filled at time Tscan delay + ½ Tacquisition. The midpoint of enhancement, or Tcirculation + ½ TGd injection, should be synchronized with the filling of the central lines of k-space:
where TGd injection refers to the duration of gadolinium chelate injection and is assumed to reflect the duration of arterial enhancement. Rearranging this formula
For example, consider the test bolus result shown in Figure II4-5, where the subject’s circulation time is 18 sec. A routine 20 sec renal MRA acquisition uses 20 mL contrast volume and the rate of injection of both the gadolinium contrast and saline flush is 2 mL/sec. What should be the scan delay time?
If the contrast volume is 20 mL and it is injected at 2 mL/sec, then TGd injection = 10 sec. If the acquisition time is typically about 20 sec, then the simple formula can be further simplified to
Using the simplified equation, the scan delay should be Tscan delay = Tcirculation time − 5 sec = 13 sec.
CHALLENGE QUESTION: Consider the same subject shown in Figure II4-5. Consider if the subject weighs about 70 kg (154 lb) and is referred for imaging of a large abdominal aortic aneurysm. How would the gadolinium-enhanced MR angiogram be performed differently, assuming the same imaging sequence is used?
View Answer
Answer: When the volume of the vessel of interest is large, a larger dose of gadolinium contrast should be used to fill that volume. With large aneurysms, a double dose of contrast may improve the image quality. Recall that doses are defined by subject weight. From Table II4-1, a double dose for this subject would be 40 mL. If the rate of injection is still 2 mL/sec, then TGd injection = 20 sec. The circulation time and acquisition times are the same:
Centric k-Space Filling
For centrically-ordered k-space filling, the relationship between circulation time and scan delay is different. The central lines of k-space are filled during the first half of the acquisition period, at a time defined as Tcenter of k-space. Therefore, for a given scan delay, Tscan delay, the central lines of k-space will be filled at time Tscan delay + Tcenter of k-space. The midpoint of enhancement, or Tcirculation + ½TGd injection, should be synchronized with the filling of the central lines of k-space:
where TGd injection refers to the duration of gadolinium chelate injection and is assumed to reflect the duration of arterial enhancement. Rearranging this formula,
Again, assuming a contrast volume of 20 mL is injected at 2 mL/sec (TGd injection = 10 sec), and the acquisition time is 20 sec, then the formula can be simplified by making the reasonable approximation that Tcenter of k-space is 5 sec:
The advantage of the test bolus method is that it can be implemented on any system without special software or hardware. It also allows for the opportunity to test the integrity of the intravenous catheter and vein. However, the test bolus approach does have the drawback of requiring an extra acquisition (typically 1 min) and a separate injection of contrast and saline flush. This is straightforward when an automated injector is available, but it can be cumbersome for manual injections. Residual gadolinium from the test dose also increases background signal for the subsequent MRA acquisition. For the test bolus to give an accurate guide to determining the best scan delay, the test bolus conditions must match those of the full contrast bolus—the rate of injection and amount of flush should be the same. It is also important to consider the effect of breath holding on circulation dynamics. When timing is critical and the MRA is to be acquired during suspended respiration, the test bolus should be given during the same phase of suspended respiration (end-expiration, for example, at least for the first 15-20 sec) as during the actual study.
IMPORTANT POINT:
With use of a test bolus, a subject’s circulation time for the organ of interest can be determined and used to optimize the scan delay time and ensure imaging during arterial enhancement.
This simplifies to
in the typical case where the contrast volume is 20 mL, injection rate is 2 mL/sec, and the acquisition time is 20 sec. For MRA sequences that fill k-space centrically, the formula for a single-dose injection is simply
Bolus Detection Methods
An alternative approach to the test bolus injection is to detect and monitor the appearance of the full contrast bolus in near real time. Fluoroscopic-type 2D images are acquired repeatedly in the vessel of interest. Once the leading edge of the bolus is seen in the aorta, the 3D MRA acquisition is initiated either by the operator or automatically (Figure II4-6). With automatic triggering, software repeatedly samples the signal intensity within a region of interest defined by the user (usually within the aorta). Once a predefined threshold is met, the acquisition is initiated by the system. For studies in the torso, the patient may be given a quick instruction to suspend respiration before starting the acquisition.
Because the bolus is already filling the vessels at the start of the acquisition, centric-ordered filling of k-space is usually performed. The bolus detection method is fast and efficient, but it requires software that may not be available on an MRI system. One slight disadvantage is the limited time for breath-holding instructions before the acquisition begins. However, the inability to hyperventilate is less of a problem if shorter acquisition times are used.
Guess Method
Some centers do not use any timing schemes, but rather rely on “guestimates” of a subject’s circulation time based on age and cardiac history. For example, young, relatively healthy subjects would be expected to have circulation times of about 12 sec, while older subjects or those with poor circulation might be assumed to have circulation times of 24-30 sec. Guessing works in about 85-90% of cases. Mistiming may result in artifacts that are discussed at the end of this chapter. The guess method is more forgiving with larger and slower boluses, because the duration of enhancement (Figure II4-2) is longer. Therefore, centers that use the guess method often resort to a double dose of gadolinium contrast as the default dose.
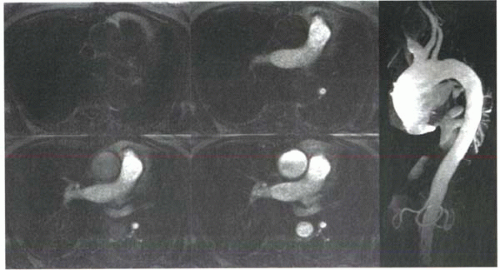 FIGURE II4-6. Bolus detection images showing the arrival of contrast in the pulmonary arteries and then the aorta (left). The 3D acquisition is triggered following the last image, either automatically or by the operator, to obtain a 3D MRA of the thoracic aorta (right). Although axial here, the “fluoroscopic” images can be positioned sagittally through the thoracic aorta. |
3D SPOILED GRADIENT ECHO MRA SEQUENCES
Imaging Parameters
The 3D spoiled gradient echo MRA sequences are preset by most vendors. A receiver bandwidth is selected to allow reasonable signal-to-noise ratios, and the associated minimum TR and TE values are then defined based on the bandwidth. TE times are typically 1-2 msec, depending on the system characteristics. Typical TR values may be between 2-6 msec. As introduced in Chapter I-4, the flip angle depends on the desired degree of contrast between the vessels and the background tissue. The higher the flip angle, the greater the background
suppression. However, higher flip angles also mean that the signal from gadolinium contrast material may become attenuated. In general, most MRA is performed with flip angles between 25°-40°.
suppression. However, higher flip angles also mean that the signal from gadolinium contrast material may become attenuated. In general, most MRA is performed with flip angles between 25°-40°.
Spatial Resolution and Isotropic Voxels
In setting up 3D MRA sequences, there are important tradeoffs among spatial coverage, resolution, and acquisition times. The ability of MRA images to depict accurately the degree of stenosis depends on the spatial resolution and contrast resolution. The smaller the vessels of interest, the higher the spatial resolution that is needed to diagnose and quantify the extent of vascular disease. In considering 3D MRA protocols, it is important to remember that the three dimensions are not interchangeable because one is a frequency-encoding direction and two are phase-encoding directions. Increasing the spatial resolution in the frequency-encoding direction does not increase acquisition time, but increasing the resolution in either phase-encoding direction does. Therefore, with 3D MRA, spatial resolution tends to be higher in one direction than in the other two. For MRA, the goal should be to attain isotropic spatial resolution. The 3D slab should be oriented with frequency encoding in the direction of largest field of view. The spatial resolution in the two phase-encoding directions should be adjusted to be approximately equal. As illustrated in the following example, with interpolated or partial Fourier 3D sequences, it is important to distinguish between the voxel size and the true spatial resolution.
▪ EXAMPLE 1
Consider the case of a 3D renal MRA acquisition with partitions oriented in the coronal plane (Figure II4-7).
Scenario A: The field of view is 400 mm craniocaudally, 300 mm left to right, and the slab thickness is 96 mm. The matrix of collected data is 512 × 144 (with the 75% rectangular FOV from left-to-right) × 24. With asymmetric k-space filling and 75% partial Fourier in the left-to-right direction and zip interpolation in the partition direction, the interpolated imaging matrix is 512 × 192 × 48. What is the acquisition time for a TR = 4 msec? What are the true spatial resolution and voxel size for this acquisition?
Answer: The acquisition time is:
The voxel dimensions are calculated as follows:
Frequency encoding: 400 mm/512 = 0.8 mm
Phase encoding: 300 mm/192 = 1.6 mm
Partition (Phase encoding 2): 96 mm/48 = 2 mm
Although the voxel dimensions might give the misleading impression that the spatial resolution is isotropic in two dimensions, in fact, the true spatial resolution is:
Frequency encoding: 400 mm/512 = 0.8 mm
Phase encoding: 300 mm/144 = 2.1 mm
Partition (Phase encoding 2): 96 mm/24 = 4 mm,
which is definitely not isotropic.
Scenario B: To make the spatial resolution more isotropic, the number of phase encoding steps must be adjusted so that the matrix of collected data is 512 × 96 × 36 and the interpolated matrix is 512 × 128 × 72. With this modification, what are the new voxel dimensions, spatial resolution, and acquisition time?
Answer: The voxel dimensions are
Frequency encoding: 400 mm/512 = 0.8 mm
Phase encoding: 300 mm/128 = 2.3 mm
Partition (Phase encoding 2): 96 mm/72 = 1.3 mm
The true spatial resolution is:
Frequency encoding: 400 mm/512 = 0.8 mm
Phase encoding: 300 mm/96 = 3.1 mm
Partition (Phase encoding 2): 96 mm/36 = 2.7 mm
Acquisition time will be the same:
Although the voxel size has become less isotropic in the two phase-encoding directions, the spatial resolution is closer to being isotropic than for Scenario A.
Scenario C: With an increase in acquisition time, Scenario A can be improved to generate an image with spatial resolution of less than 2.5 mm in all dimensions. For example, in Scenario C, consider a matrix of collected data of 512 × 144 × 40 which, using the same interpolation as in Scenarios A and B, would translate into an interpolated imaging matrix of 512 × 192 × 80. Compute the voxel size, true spatial resolution, and acquisition time.

