Chapter 14 Fundamental Concepts in Defibrillation
Sudden cardiac death (SCD) is a major health problem in developed countries.1 Most deaths are believed to be caused by ventricular fibrillation (VF).2 Currently, electrical defibrillation is the only effective means for terminating this fatal arrhythmia. The mortality rate from SCD has decreased in the past decade, partly because of the improved understanding of the nature of this fatality as well as the development of defibrillation devices. Recent advances in external defibrillators have led to the introduction of public-access defibrillators, which promises to significantly reduce the mortality rate of SCD. Recent advances in implantable defibrillators, such as the use of a biphasic waveform, have led to smaller intravenous devices that have been shown to significantly benefit certain groups of patients.2–4 Despite these wide applications of transthoracic and intracardiac defibrillators, a great need for better means of defibrillation still exists. With better understanding of the fundamental mechanisms of defibrillation, it may be possible to devise strategies to improve defibrillation efficacy. This chapter presents some factors that are believed to be important and, perhaps, crucial in determining the outcome of a defibrillation shock.
Shock Creates Nonuniform Potential Gradient Distribution in the Heart
The success of defibrillation is dependent on the strength of the shock and is thought to be achieved by shock changing the transmembrane potential of the myocardial fibers. This change in the transmembrane potential is caused by current flow between the extracellular and intracellular spaces that is generated by the electrical shock. When the shock is delivered, different amounts of current flow through different parts of the heart. The distribution of this current flow is directly related to the potential gradient, the change in shock potential over space, and the spatial derivative of the potential gradient generated by the shock across the heart.5–7 For shocks delivered from intracardiac electrodes, the distribution of the potential gradient is markedly nonuniform in that the high potential gradients are located near the electrodes that deliver the shock and the low potential gradients exist some distance away from the electrodes.8 Other factors such as myocardial fiber curvature and orientation, myocardial connective tissue barriers, blood vessels, and scar tissue also have been shown to directly influence the transmembrane potential.9–12
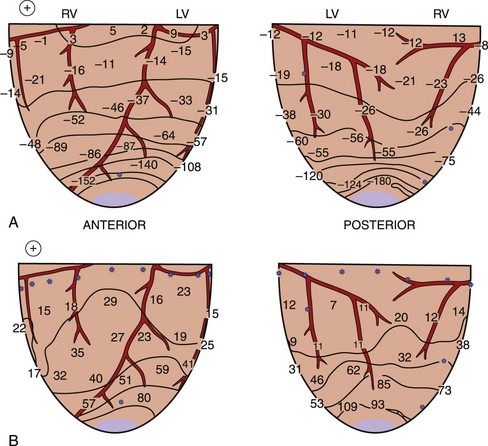
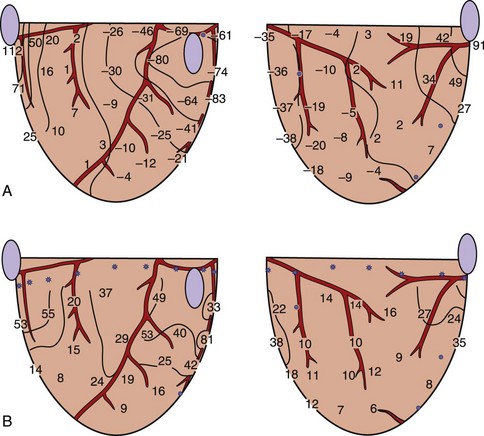
When a shock is delivered to the heart, the pattern of potential voltages and potential gradient distributions created by the shock depends on the configuration of the shocking electrodes. In the case of a 1-V shock delivered from the electrodes on the right atrium (anode) and on the left ventricular (LV) apex (cathode), the largest negative potentials are created by the shock at the apex. The voltage drop is also marked at the ventricular apex, the region where the defibrillation electrode is located (Figure 14-1, A).13 Figure 14-1, B, shows the potential gradients calculated from this potential distribution. For this configuration of the shocking electrodes, the potential gradient distribution is markedly uneven in that the potential gradient is much larger and changes faster (as indicated by narrow spacing between isogradient lines) in the apical portion than in the basal portion of the ventricles. For a 1.5-V shock delivered from electrodes at the lateral base of the right (anode) and left (cathode) ventricles (Figure 14-2), the voltage drop is marked at the regions close to the shocking electrodes (see Figure 14-2, A). The strongest potential gradient regions are in the basal portion of the ventricles near the electrodes, and the weakest gradient regions are near the apex, far from the shocking electrodes (see Figure 14-2, B).13 Thus, regardless of the shocking electrode configuration, the distribution of the potential gradient created by shocks has a similar pattern. The high potential gradient region with rapidly changing gradients is near the defibrillation electrodes, and the low potential gradient regions frequently occur far from the shocking electrodes.8,13
Physiological Responses of the Myocardium to Stimuli
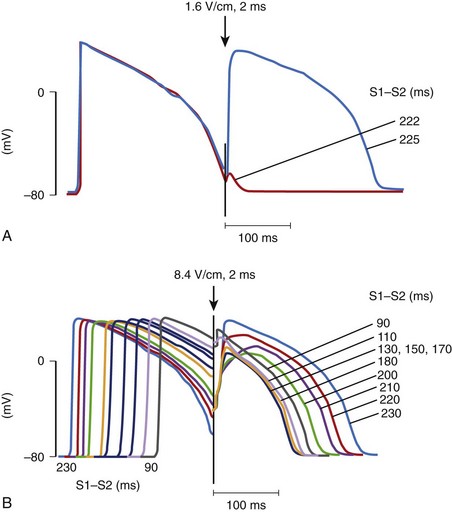
When an electrical stimulus is delivered to a myocardial fiber, several responses can be observed, depending on the stimulation strength, that is, the potential gradient created by a stimulus, and the phase of the action potential of the fiber at the time of stimulation.14 If the stimulus is strong (above threshold) and is delivered to a cell that is in its resting state or is relatively refractory, a new action potential will be generated (Figure 14-3, A).15 If the stimulus is weak (below the threshold) and is delivered to the cell at its resting state or refractory state, no response will be observed. However, if the stimulus is very strong (much above the threshold) and is delivered to a cell even at its highly refractory state, a graded response can occur (see Figure 14-3, B). The size of the graded response increases with the increase of the stimulus magnitude, the coupling interval, or both.16 This graded response prolongs the action potential duration as well as the refractory period of the cardiac cell.17,18 This type of cardiac response has been proposed to be a possible defibrillation mechanism, which is known as the refractory period extension (RPE) hypothesis.19,20 This hypothesis states that successful shocks must be sufficiently strong to prolong the refractory period of cardiac tissue across the heart so that ectopic activation occurring after the shock, if any, will be prevented from propagation that could lead to re-entry and VF. However, because of the uneven distribution of potential gradients, to prevent these ectopic activations, potential gradients generated by the shock are stronger than needed in most regions of the heart to achieve the minimum required potential gradient for refractory period extension where the shock field is weakest.
Myocardial Responses to the Shock Delivered During Ventricular Fibrillation
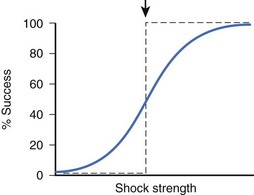
During early VF, many wandering activation fronts are present at all times on the heart.21 At different times during the same or different VF episodes, activation sequences are not constant and can differ markedly.22,23 When shocks of the same or different strengths are delivered during VF, myocardial responses to each shock can be different from one shock to the next, depending on the state of the ventricles when the shock is given. Since these responses are thought to be crucial in determining defibrillation success, shocks of the same strength delivered to a fibrillating heart can sometimes succeed and other times fail to defibrillate. As a result, no definite threshold in shock strength demarcates successful defibrillation from failed defibrillation. The relationship between shock strength and defibrillation success can, therefore, be characterized as probabilistic. Other factors that may contribute to the probabilistic nature of defibrillation success include changes in autonomic tone and changes in heart volume during VF.24,25 Although defibrillation success is probabilistic, as shock strength becomes stronger, the chance of defibrillation success becomes greater (Figure 14-4) for both transthoracic and intracardiac defibrillation.26,27
Regions of Immediate Postshock Activation
Defibrillation studies have demonstrated that the relationship between regions where activation appears on the heart soon after the shock and the extracellular potential gradient distribution created by the shock are well correlated. It has been proposed that for defibrillation to be achieved, it is necessary to raise the potential gradient throughout all, or almost all, of the ventricular myocardium to a certain minimum level.28 This statement is supported by the findings that following weak shocks that fail to defibrillate, the immediate postshock activations arise at multiple sites throughout the ventricles.29 With stronger shock strength, the numbers of sites of immediate postshock activation are decreased and are no longer found in the high potential gradient regions. Figure 14-5 demonstrates the sites of postshock activation recorded from the same animal as shown in Figures 14-1 and 14-2. In the study, shocks were delivered from two different electrode configurations; the site of the earliest recorded postshock activation was at the base of the ventricles for a shock given from the right atrial and ventricular apical electrodes (see Figure 14-5, A) and was at the apex of the ventricles for the shock given from the right and left ventricular basal electrodes (see Figure 14-5, B). Both regions correspond to the weak potential gradient area created by shocks delivered from each shocking electrode configuration (see Figures 14-1, B, and 14-2, B). These results suggest that the potential gradient field created by the shock is important in determining the immediate response of the myocardium to defibrillation shocks. Since the potential gradient field created by the shock is markedly uneven, a strong shock is normally required to create a potential gradient that reaches the optimal level at the region where the gradient field is weakest in the ventricles. However, this strong shock can be detrimental, since it can create excessively high gradient near the shocking electrodes and may damage the myocardium.30,31 Several studies have shown that this detrimental effect can lead to postshock conduction block and arrhythmias.32
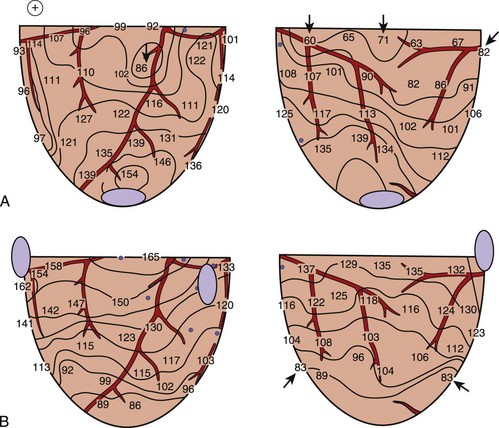
FIGURE 14-5 Isochronal maps of the first postshock activation. The thin solid lines are isochrones spaced 10 ms apart. Numbers represent activation times at each recording electrode in milliseconds relative to the shock onset. A, A 4.9-J failed defibrillation shock given via electrodes placed at the right atrium and the apex during ventricular fibrillation. The sites of earliest postshock activation were located at the base of the ventricles (arrows), the weak potential gradient region created by the shock delivered from this electrode configuration, as indicated by the gradient map shown in Figure 14-1, B. B, A 23.2-J failed defibrillation shock given via electrodes placed at the right and left ventricular bases during ventricular fibrillation. The sites of the earliest activation were located at the posterior and apical aspects of the ventricles (arrows), the weak potential gradient region for this configuration of the shocking electrodes, as indicated by the gradient map shown in Figure 14-2, B.
(From Chen PS, Wolf PD, Claydon FJ, et al: The potential gradient field created by epicardial defibrillation electrodes in dogs, Circulation 74:626–636, 1986.)
Why Do Shocks Fail to Defibrillate?
Following the near-threshold shocks that fail to defibrillate, the earliest recorded postshock activation that propagates throughout all, or almost all, of the myocardium always arises in the low potential gradient regions. After several such organized cycles in rapid succession, activation becomes more disorganized, allowing fibrillation to resume. Currently, two possible mechanisms are thought to explain the origin of these early postshock activation cycles in the low potential gradient regions. The first one is known as the critical mass hypothesis. According to this hypothesis, the gradient field created by the shock is too weak to halt the fibrillatory wavefronts present in those regions, allowing the fibrillation to continue propagation after the shock.33–35 The second hypothesis is known as the upper limit of vulnerability hypothesis for defibrillation. This hypothesis suggests that a shock of near-threshold strength is already strong enough to terminate all fibrillatory wavefronts, including those in the low gradient regions. However, this shock fails to defibrillate because it creates new activation fronts in these regions.29,36,37 These activations then spread out, eventually causing block and disorganized activations across the ventricles, degenerating back into VF. These two hypotheses continue to be debated.38–40 Whatever the mechanism is, these two hypotheses agree that since the direct effect of the shock at each myocardial region depends on both the strength of the shock (i.e., the potential gradient) and the phase of the cardiac cycle at the time the shock is delivered, the shock potential gradient or its derivative must be sufficiently high to stop fibrillatory fronts on the ventricles or not create new activations that allow fibrillation to resume, or both.29,36,37
The Critical Point Hypothesis: Classic Interpretation
Previous cardiac mapping studies demonstrated that following failed defibrillation with shocks near the defibrillation threshold (DFT) in strength, the pattern of activation after the shock was different from the VF activation pattern immediately prior to the shock.29,36 These findings suggest that the postshock activation was not the unaltered activation continuing from VF activation prior to the shock in that region. Rather, the shock terminated all VF activation fronts but failed to defibrillate because it generated a new activation in the weak gradient region that degenerated into VF. The critical point hypothesis has been proposed to explain how a shock generates a new activation in this weak gradient area that leads to fibrillation. The concept of this hypothesis is based on the relationships among the distribution of potential gradients created by the shock, the state of the myocardium at the time of the shock, and the myocardial response to the shock. This hypothesis was proposed theoretically by Winfree and later was demonstrated experimentally by Frazier et al.41,42 During the shock, different responses of cardiac tissue to an electrical stimulation can be observed. As a result, depending on the state of the cardiac tissue at the time of the shock, some regions of the myocardium can be directly activated by the shock field to undergo a new action potential, and other regions can undergo RPE caused by a graded response of the action potential.15,17,43,44 Thus, an activation front arises after the shock that terminates at a critical point on the boundary between these two types of regions. This blindly ending activation front propagates to form a functional re-entrant circuit.
Frazier et al tested this hypothesis by delivering a shock to the canine heart during paced rhythm (Figure 14-6).42 A row of epicardial stimulating wires on the right of the recording region is used to deliver S1 pacing. Figure 14-6, A, shows activation times and recovery times distributed across the mapped region during the last S1 pacing beat. Solid lines represent the spread of the activation front away from the S1 electrodes, and dashed lines represent the recovery times estimated from the refractory period to a local 2-mA stimulus. The S2 shock is delivered through a long narrow electrode placed near the bottom of the mapped region that is perpendicular to the activation front arising from the S1 pacing stimulus. The potential gradients created by a large premature S2 shock (Figure 14-6, B) demonstrate that the highest potential gradient is located in the region close to the S2 electrode and weakens with distance away from the S2 electrode. S2 shocks are delivered to scan the vulnerable period following the last S1.
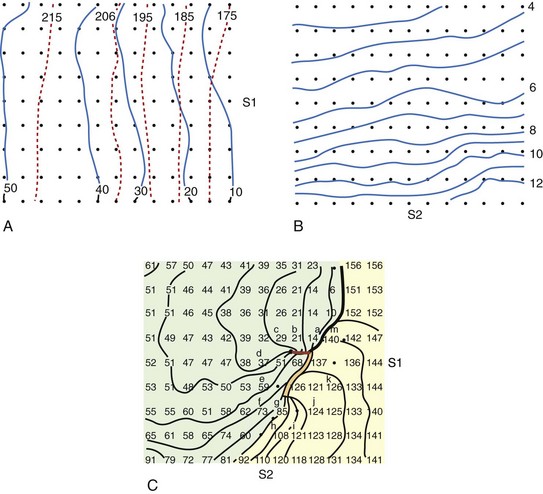
Figure 14-6, C, demonstrates the initial activation pattern when a re-entrant circuit is formed after the S2 shock is delivered at an S1–S2 coupling interval when a dispersion of refractoriness is present across the mapped region. Following the strong S2 stimulation, an activation front first appears a few centimeters away from the S2 electrode with one end terminating blindly at a point in the center of the mapped region where the S2 potential gradient is approximately 6 V/cm and where the tissue is just passing out of its absolute refractory period.42 This point is called the critical point for re-entry. This activation front then propagates away from the S1 electrode, pivots around the critical point, later spreads through the lower left quadrant, and forms a re-entrant circuit as it enters the right lower quadrant that continues for over 10 cycles before degenerating into VF.
The Critical Point Hypothesis: New Interpretation
Recent optical mapping studies have shown that when an electrical stimulus is applied to the myocardium, different polarities of transmembrane potential changes are observed near the stimulating electrode.6,10,45–47 During a defibrillation shock, it has been proposed that depolarized and hyperpolarized regions caused by the shock are interspersed throughout the heart.10,48,49 By using an optical mapping technique to investigate the mechanism of failed defibrillation, Efimov and colleagues recently demonstrated a different type of re-entrant circuit formation than that by the classic critical point.48 Their results showed that the formation of a critical point where a re-entrant circuit is observed depends on the magnitude and distribution of depolarization and hyperpolarization of the transmembrane potential created by the shock. A critical point is formed on the boundary between depolarized and hyperpolarized regions when the magnitude and rate of change of transmembrane polarization across this boundary are sufficiently large. In the region where the tissue is hyperpolarized by the shock, this hyperpolarization can “de-excite” tissue that was depolarized just before the shock, thus restoring the excitability of the myocardium in that region.6,48 According to these results, the potential gradient and refractoriness are not critical for re-entrant circuit formation. Figure 14-7 illustrates re-entrant circuit formation based on the classic and the new forms of the critical point hypothesis.
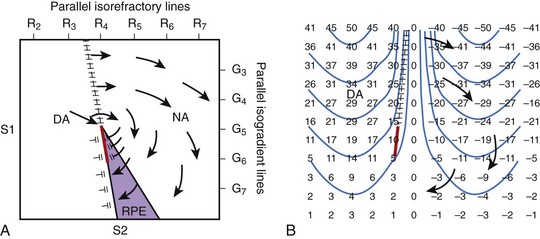
FIGURE 14-7 Two types of hypothesized critical points. A, Idealized diagram corresponding to the experiment shown in Figure 14-6 is shown with a critical point formed at the intersection of a critical shock potential gradient of G5 and a critical tissue refractoriness of R4. S1 pacing is performed from the left to cause a dispersion of refractoriness at the time of the S2 shock, with R2 representing less refractoriness and R7 more refractoriness. The S2 shock is given during the vulnerable period from the bottom of the region with large-gradient G7 at the bottom and small-gradient G3 at the top. The region labeled DA (directly activated) is sufficiently recovered so that it is directly activated by the gradient field. The area in the purple region, although more refractory, is exposed to a higher gradient and undergoes refractory period extension (RPE) so that activation in the DA tissue cannot propagate through this region. The region NA is too refractory to be affected even with a large gradient. Thus, propagation conducts unidirectionally from the DA region to the NA region at the top, encircling the critical point, re-entering the DA region to create a re-entrant circuit. B, An idealized diagram is shown of a critical point caused by adjacent regions of depolarized and hyperpolarized transmembrane potential changes. Numbers represent transmembrane changes with isolines spaced every 10 mV beginning at –45 mV. DA occurs to the left of the frame line where depolarized transmembrane potential changes are above the threshold. Where the gradient in transmembrane potential is high, as indicated by the closely spaced isolines at the top center of the panel, conduction can occur into the hyperpolarized region. Below, where the gradient in transmembrane potential is smaller, propagation cannot occur. A critical point is formed at the intersection of the frame (hatched) and block (red) lines where one end of the propagating activation front terminates in both panels.
(From Chattipakorn N, Ideker RE: Mechanism of defibrillation. In Aliot E, Clementy J, Prystowsky EN, editors: Fighting sudden cardiac death: A worldwide challenge, New York, 2000, Futura.)
Figure 14-7, A, illustrates the classic type of critical point formation as demonstrated by Frazier and colleagues.42 The S1 pacing electrode is located on the left, and the S2 shocking electrode is at the bottom of the mapped region. When the shock is delivered, the myocardium that is directly activated (DA) by the S2 shock is located near the S1 pacing electrode. Myocardium that has RPE is in the region near the S2 electrode. As a result, the activation arising in the DA region can propagate only unidirectionally in a clockwise manner around the critical point.
An idealized diagram illustrating the new type of critical point formation is shown in Figure14-7, B. When a shock is delivered, it creates regions of depolarization adjacent to regions of hyperpolarization.10,46,47 The magnitude of depolarization caused by the shock in the DA region is high at the top (large positive numbers) and gradually decreases toward the bottom (small positive numbers). Adjacent to the depolarized region is a region of hyperpolarization. The magnitude of hyperpolarization caused by the shock is also high (large negative numbers) and gradually decreases from the top toward the bottom (small negative numbers). The pattern of transmembrane potential distribution produced by the shock creates a large gradient between the depolarized and hyperpolarized regions, as indicated by the closely spaced isolines at the top center of the panel. The large gradient between the two adjacent transmembrane polarities allows an activation front to propagate from the depolarized region into the hyperpolarized region (arrow at the top). No propagation is present in the bottom half of the panel because the gradient in transmembrane potentials is too small. As a result, a critical point is formed at the intersection of the frame and block lines (indicated by hatched [black] and solid lines [red], respectively) where one end of the propagating activation front terminates. Thus, activation arising in the DA region propagates unidirectionally from the top toward bottom (arrows) and re-enters the DA region later, forming a clockwise re-entrant circuit.
Although these two interpretations suggest different mechanisms of critical point formation, they both indicate that defibrillation fails because of re-entrant activation caused by the shock, which later degenerates into VF. Most cardiac mapping studies using a large-animal model have shown that a re-entrant activation pattern is rarely observed after a shock that fails to defibrillate and that is near the defibrillation threshold in strength. 29,35,50–53 Epicardial focal activation patterns are commonly observed in these studies. Transmural or Purkinje-myocardial re-entry has been proposed to be the possible mechanism giving rise to the activation fronts with the epicardial focal activation pattern that is observed in these studies; this pattern is caused by epicardial breakthrough instead of having a true focal origin.29,35,51–53 To test this hypothesis, three-dimensional mapping is needed. Currently, only a few three-dimensional studies have been performed to investigate the defibrillation mechanism. Chen and colleagues performed a transmural cardiac mapping study and demonstrated that only a few episodes of fibrillation after a failed defibrillation shock are initiated by a re-entrant circuit.50 Many appear to arise from a focus. Consistent with this finding, a recent three-dimensional cardiac mapping study demonstrated that the earliest postshock activation after near–defibrillation threshold shocks arise in a focal pattern.54 These findings suggest that the current interpretations of critical point formation may only partially explain the mechanisms of defibrillation and that the relationship between the shock delivered to a fibrillating heart and cardiac responses to the shock is complex.
Upper Limit of Vulnerability and Defibrillation Mechanism
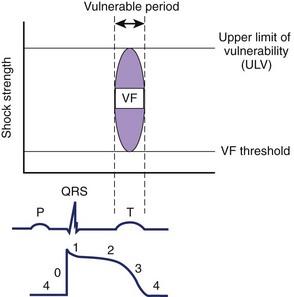
VF can be induced when an electrical stimulus within a certain range of strengths is delivered to the myocardium during the vulnerable period of the cardiac cycle in normal sinus or paced rhythm.55 The lowest stimulation strength that can induce VF is known as the VF threshold (Figure 14-8). As the stimulation strength is increased, VF can still be induced until the stimulus strength reaches a value above which VF can no longer be induced again. This strong stimulation strength that no longer induces VF, no matter when this stimulus is delivered during the vulnerable period of repolarization, is known as the upper limit of vulnerability (ULV) (see Figure 14-8).56 Table 14-1 shows the estimated threshold of the stimulus current and the voltage gradient required for different myocardial responses.28
Stay updated, free articles. Join our Telegram channel

Full access? Get Clinical Tree


