Absolute
Acute myocardial infarction (within 2 days)
High-risk unstable angina
Uncontrolled cardiac arrhythmias causing symptoms or hemodynamic compromise
Symptomatic severe aortic stenosis
Uncontrolled symptomatic heart failure
Acute pulmonary embolus or pulmonary infarction
Acute myocarditis or pericarditis
Acute aortic dissection
Relativea
Left main coronary stenosis
Moderate stenotic valvular heart disease
Electrolyte abnormalities
Severe arterial hypertensionb
Tachyarrhythmias or bradyarrhythmias
Hypertrophic cardiomyopathy and other forms of outflow tract obstruction
Mental or physical impairment leading to inability to exercise adequately
High-degree atrioventricular block
The Mason-Likar modification of the standard 12-lead electrocardiogram (ECG) is the most frequent lead system used for exercise testing. This modification involves moving the limb electrodes to the torso to minimize motion artifact. It should be noted that the Mason-Likar lead placement results in increased voltage in the inferior leads and a rightward axis shift. In some patients with a prior inferior Q wave infarction, this configuration can cause inferior Q waves to disappear and a Q wave in lead aVL to appear. Therefore, a standard resting 12-lead ECG with the electrodes placed at the extremities is usually obtained before performance of the exercise test. After the limb leads have been moved to the torso, tracings should be recorded with the patient in the supine and upright positions. The tracing in the upright position is usually selected as the baseline tracing from which exercise tracings are compared. Table 8.2 summarizes the main indications for termination of an exercise test [1].
Table 8.2
Indications for terminating exercise testing
Absolute indications |
Drop in systolic blood pressure of >10 mmHg from baseline blood pressure despite an increase in workload, when accompanied by other evidence of ischemia |
Moderate to severe angina |
Increasing nervous system symptoms (e.g., ataxia, dizziness, or near-syncope) |
Signs of poor perfusion (cyanosis or pallor) |
Technical difficulties in monitoring ECG or systolic blood pressure |
Subject’s desire to stop |
Sustained ventricular tachycardia |
ST elevation (>1.0 mm) in leads without diagnostic Q-waves (other than V1 or aVR) |
Relative indications |
Drop in systolic blood pressure of (>10 mmHg from baseline blood pressure despite an increase in workload, in the absence of other evidence of ischemia |
ST or QRS changes such as excessive ST depression (>2 mm of horizontal or downsloping ST-segment depression) or marked axis shift |
Arrhythmias other than sustained ventricular tachycardia, including multifocal PVCs, triplets of PVCs, supraventricular tachycardia, heart block, or bradyarrhythmias |
Fatigue, shortness of breath, wheezing, leg cramps, or claudication |
Development of bundle-branch block or IVCD that cannot be distinguished from ventricular tachycardia |
Increasing chest pain |
Hypertensive responsea |
Bicycle Ergometer Protocols
Bicycle ergometers have mechanical or electrical brakes to vary workloads that are calibrated in kiloponds (kpm) or watts (W). The initial power output is usually 25 or 50 W depending on the ability of the particular patient, followed by increases of 25–50 W every 3 min until the end point of the test is reached. Bicycle ergometers are usually less expensive, occupy less space, and make less noise than a treadmill. In addition, upper body motion is usually less than that with a treadmill, making it easier to measure blood pressure, auscultate the chest, and record the ECG. Bicycle ergometry is associated with a higher ischemic threshold compared to a standard Bruce protocol treadmill test [3]. Low peak metabolic equivalents (METs) and an abnormal ECG pattern during cycle ergometry are associated with an increased risk of death or myocardial infarction in elderly patients unable to perform standard treadmill exercise [4]. However, a significant proportion of patients experience difficulty in performing optimally on a bicycle compared with a treadmill. In addition, maximal oxygen uptake tends to be 5–10 % lower than with treadmill exercise, and maximal cardiac output and stroke volume are correspondingly reduced which result in a lesser challenge of cardiac reserve.
Treadmill Protocols
There are numerous different treadmill exercise protocols; it is important to select a protocol that is suited to the patient’s physical ability. An optimal protocol should last at least 6–12 min. The most popular is the Bruce protocol because of the extensive published data on the diagnostic and prognostic use of this protocol. In patients with limited exercise capacity, the Bruce protocol can be modified by adding an initial zero stage (1.7 mph at 0 % incline) and one-half stage (1.7 mph at 5 % incline). The main disadvantages of this protocol are the large increments in work that occur between stages and the additional energy requirements in patients who are required to run rather than walk in the fourth or subsequent stages of the protocol. Other treadmill protocols such as ramp protocols, the modified Balke, Naughton, or standard or modified Asymptomatic Cardiac Ischemia Pilot (ACIP) protocols were developed to provide a more linear increase in heart rate and oxygen consumption at progressively increasing workloads [5, 6]. In patients with severe limitation of exercise capacity, the 6-min walk test can be used to provide a more objective assessment of functional capacity than a subjective description of symptoms. Although the 6-min walk test is popular to test patients with more severe heart failure, it is not as objective as cardiopulmonary testing in establishing peak aerobic capacity.
Postexercise Period
It is important to be aware that some abnormal responses only occur in the postexercise recovery phase. To achieve maximal sensitivity to detect ST segment shifts, patients should be in the supine position during the postexercise period; however, this is not always desirable. In patients who experience severe angina, dyspnea, or ventricular arrhythmias during the exercise test, the lower preload associated with the sitting or erect position may be preferable. In other patients, particularly those patients who attain a high workload, it is preferable to have a cool-down period to avoid postexercise hypotension, which occasionally occurs. Monitoring should continue for approximately 5 min after exercise or until hemodynamic changes stabilize and the heart rate and ECG have returned close to baseline. If exercise-induced ST segment changes have improved but not completely returned to normal, the patient may be disconnected from the electrocardiograph, sit in a location proximate to the laboratory, and 20–30 min later have a repeat ECG done to confirm that the ECG has returned to baseline.
Interpretation
Symptoms
The quality, character, intensity and duration of chest pain induced by exercise may be helpful in establishing a diagnosis even in the absence of ST-segment depression. It is important to obtain an accurate account of symptoms, in particular, chest pain that occurs during or after exercise testing.
Physical Signs
Cardiac examination immediately after exercise may reveal a precordial bulge or third heart sound resulting from left ventricular dysfunction. Papillary muscle dysfunction due to transitory ischemia may result in a mitral regurgitation murmur.
Heart Rate and Blood Pressure Response
Blood pressure is dependent on cardiac output and peripheral resistance. Systolic blood pressure rises to 160–220 mmHg at peak exercise, whereas diastolic blood pressure does not usually change by more than ±10 mmHg from the resting value in normal subjects. An inadequate rise (<120 mmHg) or a progressive fall in systolic blood pressure (>10 mmHg) during exercise may be associated with severe CAD and ischemic dysfunction (Table 8.3). However, some normal subjects may have a transient drop in systolic blood pressure shortly after maximal exercise due to a mismatch between the rapid changes in cardiac output and autonomic tone that occur in the immediate post-exercise phase.
Table 8.3
Exercise parameters associated with an adverse prognosis and multivessel coronary artery disease
Duration of symptom-limiting exercise <5 METs |
Failure to increase systolic blood pressure ≥120 mmHg, or a sustained decrease ≥10 mmHg, or below rest levels, during progressive exercise |
ST segment depression ≥2 mm, downsloping ST segment, starting at <5 METs, involving ≥5 leads, persisting ≥5 min into recovery |
Exercise-induced ST segment elevation |
Angina pectoris at low exercise workloads |
Reproducible sustained (>30 s) or symptomatic ventricular tachycardia |
Acute systemic illness (pulmonary embolism, aortic dissection) |
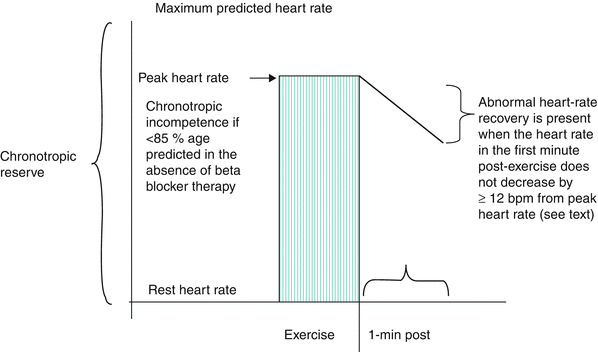
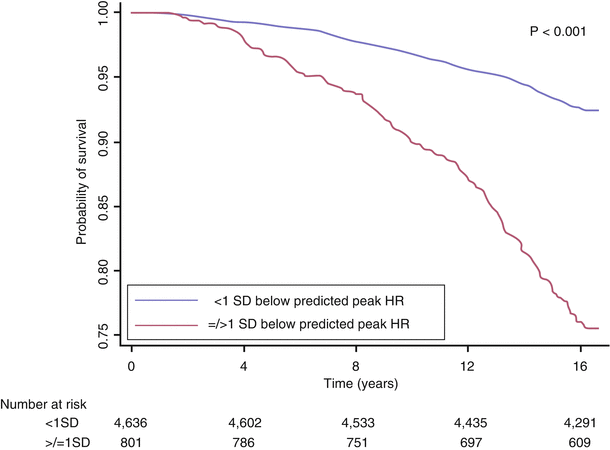
An inappropriate increase in the heart rate with exercise may be observed in patients with impaired left ventricular dysfunction. Alternatively, this response may be observed in patients who are physically deconditioned, hypovolemic, anemic, or in atrial fibrillation. A blunted heart rate response may be a sign of chronotropic incompetence, a variable associated with an increased risk of cardiac events in higher clinical risk patients (Fig. 8.1). Chronotropic incompetence is usually defined by inability to achieve 85 % of age-predicted maximum in the absence of beta-blocker therapy. Alternatively, chronotropic incompetence can be defined by the percent of heart rate reserve achieved (peak heart rate-rest heart rate)/220-age-rest heart rate). Values <80 % are considered abnormal [7]. Increased heart rate is the largest contributor to the increase in peak  with aerobic exercise. Thus, chronotropic incompetence often leads to symptomatic exercise intolerance [8]. The prognostic value of chronotropic incompetence has been assessed in different patient populations. A peak exercise HR >1 SD below the predicted mean was associated with decreased 5 year survival in a 5,000 patient series of asymptomatic women (Fig. 8.2) [8, 9]. Several different formulae have been proposed to estimate age-predicted maximal heart rate, a pre-requisite to assess chronotropic incompetence. For example, the Tanaka formula (APMHR = 208–0.7 × age) has been proposed for healthy subjects [8]. The Brawner equation has been proposed for patients with coronary artery disease on beta blocker therapy (APMHR = 164–0.7 × age) [8]. Another formula to assess inadequate heart rate reserve is the Wilkoff chronotropic index, an index that can be used when the patient does not attain 80 % of APMHR. The formula is as follows:
![$$ \begin{array}{c}\mathrm{Estimated}\;{\mathrm{HR}}_{\mathrm{stage}} = \left[\left(220-\mathrm{age}-{\mathrm{HR}}_{\mathrm{rest}}\right)\right]\times \\ {}\kern0.24em \left[\left({\mathrm{METs}}_{\mathrm{stage}}-1\right)/\left({\mathrm{METS}}_{\mathrm{peak}}-1\right)\right]+{\mathrm{HR}}_{\mathrm{rest}}\end{array} $$](/wp-content/uploads/2017/04/A301956_1_En_8_Chapter_Equa.gif)
 with aerobic exercise. Thus, chronotropic incompetence often leads to symptomatic exercise intolerance [8]. The prognostic value of chronotropic incompetence has been assessed in different patient populations. A peak exercise HR >1 SD below the predicted mean was associated with decreased 5 year survival in a 5,000 patient series of asymptomatic women (Fig. 8.2) [8, 9]. Several different formulae have been proposed to estimate age-predicted maximal heart rate, a pre-requisite to assess chronotropic incompetence. For example, the Tanaka formula (APMHR = 208–0.7 × age) has been proposed for healthy subjects [8]. The Brawner equation has been proposed for patients with coronary artery disease on beta blocker therapy (APMHR = 164–0.7 × age) [8]. Another formula to assess inadequate heart rate reserve is the Wilkoff chronotropic index, an index that can be used when the patient does not attain 80 % of APMHR. The formula is as follows:
Fig. 8.1
Example of chronotropic incompetence and abnormal heart rate recovery (see text)

Fig. 8.2
Survival in asymptomatic women by predicted peak heart rate. All-cause mortality based on being ≥1 SD below mean peak heart rate compared with those <1 SD from mean peak heart rate or peak heart rate greater than the mean peak heart rate (Reprinted from Gulati et al. [9], with permission from Wolters Kluwer Health)
![$$ \begin{array}{c}\mathrm{Estimated}\;{\mathrm{HR}}_{\mathrm{stage}} = \left[\left(220-\mathrm{age}-{\mathrm{HR}}_{\mathrm{rest}}\right)\right]\times \\ {}\kern0.24em \left[\left({\mathrm{METs}}_{\mathrm{stage}}-1\right)/\left({\mathrm{METS}}_{\mathrm{peak}}-1\right)\right]+{\mathrm{HR}}_{\mathrm{rest}}\end{array} $$](/wp-content/uploads/2017/04/A301956_1_En_8_Chapter_Equa.gif)
Correction of chronotropic incompetence to reduce cardiac events using therapy such as rate-adaptive pacing has not been adequately studied.
Occasionally, the heart rate response in the early post-exercise phase takes longer to decelerate. This form of abnormal heart-rate recovery is defined by a heart rate that fails to decrease by at least 12 beats per minute (bpm) in the first minute postexertion using a 2-min cool-down or by 18 bpm if the exercise test is stopped abruptly. Abnormal heart–rate recovery (HRR) is associated with increased long-term mortality even after adjustment for exercise–induced ST segment depression, angina, coronary disease extent, left ventricular dysfunction, and Duke treadmill score (DTS) (Fig. 8.3) [10, 11]. Some patients with abnormal HRR can be restored to normal HRR with conditioning (e.g. cardiac rehabilitation programs) resulting in survival rates similar to those with a normal baseline HRR response [12].
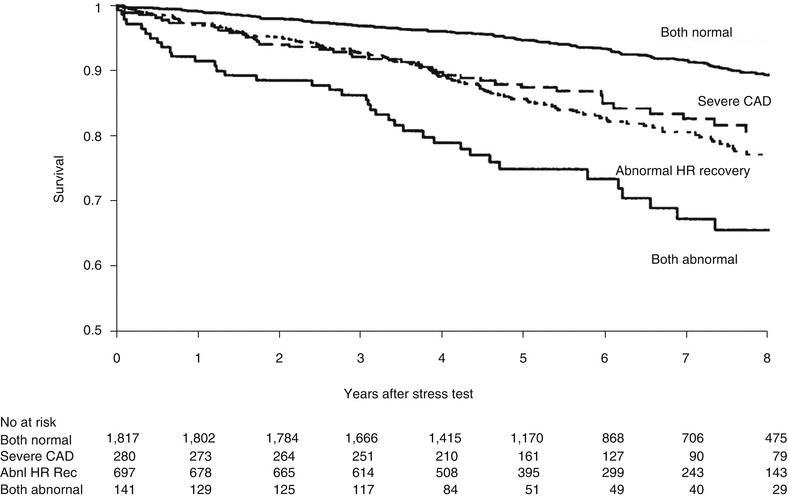

Fig. 8.3
Kaplan Meier plot showing heart rate (HR) recovery with severity of coronary artery disease (CAD) and the risk of death. The abnormal HRR was independent of gender, age, left ventricular systolic function (LVSF), functional capacity, exercise-induced angina, beta-blocker usage and severity of CAD in determining prognosis (From Vivekananthan et al. [10], reprinted with permission from Elsevier)
Electrocardiographic Changes
During exercise, there are changes in virtually all components of the ECG in normal subjects, including progressive shortening of the PR, QRS and QT intervals. The amplitude of the P wave increases and the amplitude of the T wave decreases during exercise. There is also a progressive rightward shift in the QRS axis. R wave amplitude changes have also been noted to occur during exercise. J-point depression may occur, particularly in older subjects, but the ST segment is rapidly upsloping (Fig. 8.4). Myocardial ischemia most often manifests itself as ST-segment shifts. To determine the magnitude of ST segment shift, the ST level should be measured relative to the PR segment. The PQ junction is often chosen as the point of reference (Fig. 8.5). The J point is then identified and the ST segment level is measured 60–80 ms after the J point, depending on heart rate (ST 60 is usually measured at heart rates >130–140/min). When the baseline ST-segment is depressed, an additional 0.1 mV (1 mm) of flat or downsloping ST segment depression is required to call the test “abnormal”. The standard criteria for abnormal ST segment depression are horizontal or downsloping ST-segment depression of 0.10 mV (1 mm) ≥60–80 ms after the J point in three consecutive beats (Fig. 8.6). In patients with early repolarization on the rest ECG manifest by J-point elevation, the magnitude of exercise-induced ST-segment depression should be determined using the PQ junction as the reference baseline. Thus, if the J-point at rest in a particular lead was +0.05 mV above the PQ junction, an additional −0.15 mV during or post-exercise would be required (i.e. –0.1 mV below the PQ junction), to be considered abnormal. A slow, upward sloping (>0.7–1 mV/s) ST-segment depressed 0.15 or more at 80 ms after the J point in three consecutive beats is also considered by some to be a manifestation of exercise-induced myocardial ischemia, particularly in patients with a high pre-test risk of disease (Fig. 8.5).
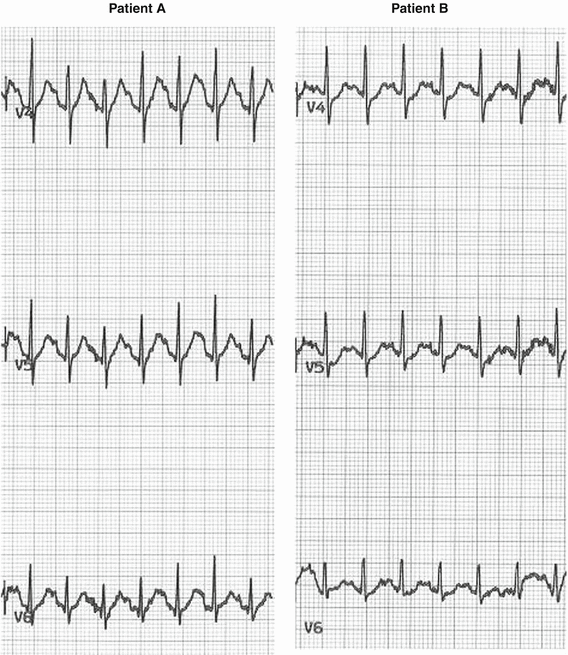
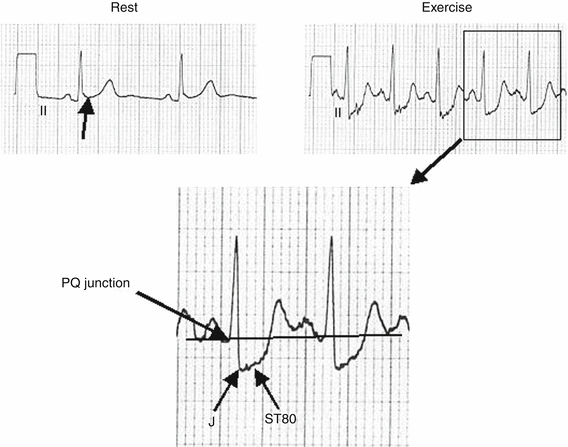
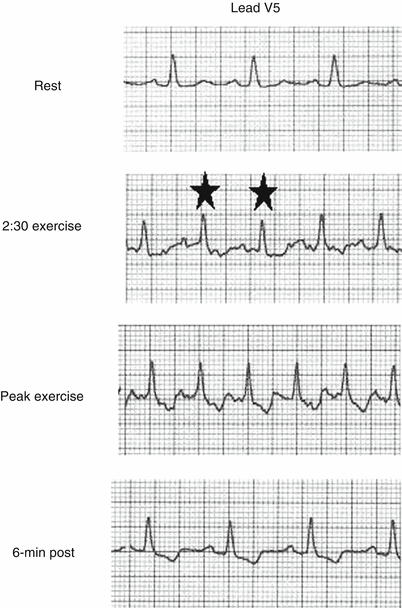

Fig. 8.4
Examples of two different patients with normal exercise electrocardiograms at peak exercise heart rates of 175–180 bpm. Patient A has no J-point or ST segment shift. Patient B has J-point depression of 1.6,1.4 and 0.7 mm in leads V4, V5, and V6; the ST segment is rapidly upsloping in patient B, depressed <0.5 mm at 60 ms after the J-point. Both tracings are normal responses to exercise. J-point depression is more common in older individuals

Fig. 8.5
A 74-year-old man referred for evaluation of stable angina. The rest ECG exhibits 0.9 mm ST segment elevation (early repolarization) (arrow). The exercise tracing shows J point depression of 3.2 mm ST depression and 2.5 mm ST segment depression (STD) at 80 ms after the J point (ST80). The PQ junction represents baseline. The test was stopped for angina at a heart rate of 135/min. This type of slow up-sloping STD (bottom panel) represents an ischemic response in symptomatic patients or individuals with an intermediate to high-risk pre-test risk. The top left panel shows the rest ECG which is a frame of reference from which to compare the exercise ECG (top right panel). It is the comparison that determines whether or not the test is abnormal

Fig. 8.6
A 58-year-old man with typical angina. The rest ECG is normal. At 2:30 s of exercise at a heart rate of 125/min, the patient manifests abnormal beats (star). At peak exercise, the ST segment is down-sloping, depressed 1.5 mm 80 ms after the J-point. The ischemic response persists at least 6 min in the postexercise phase. This type of ischemic pattern in a symptomatic patient with ST segment depression appearing early during exercise, worsening as exercise progresses, associated with down-sloping ST segments that persist late into the recovery phase is a high-risk study that normally warrants a cardiac catheterization if there are no clinical contraindications
In most laboratories, the exercise ECG is printed out in a 3 × 4 format or 2.5 s/3 lead group. To maximize the opportunity of meeting the above criteria, some laboratories have adopted a strategy of recording a full 10 s of ECG data with leads II, aVF, V5 when the tracing starts to show abnormal beats close to the ischemic threshold. A 10 as opposed to a 2.5 s tracing increases the likelihood of capturing consecutive abnormal beats with a stable baseline (Fig. 8.7). It will require future study to determine if 3 consecutive abnormal beats for the majority of beats in a 10 s study has the same diagnostic accuracy as 3 consecutive beats in a 3 × 4 format. Coronary artery disease severity is usually greatest in the presence of downsloping ST segment depression, followed by horizontal ST segment depression and finally slow-upsloping ST segment depression (Figs. 8.5 and 8.8). The magnitude of the ischemic response is related to coronary disease severity and extent. Patients with early onset of myocardial ischemia manifest as typical angina or an ST segment shift at low exercise workloads with an “ischemic” pattern that persists late into the recovery phase, have an increased risk of multivessel disease and future cardiac events. Rapid recovery of ST-segment depression (defined as recovery to baseline within 1 min in the recovery phase) is associated with less severe and extensive myocardial perfusion abnormalities compared to patients that have more prolonged recovery of ST-segment depression [13].
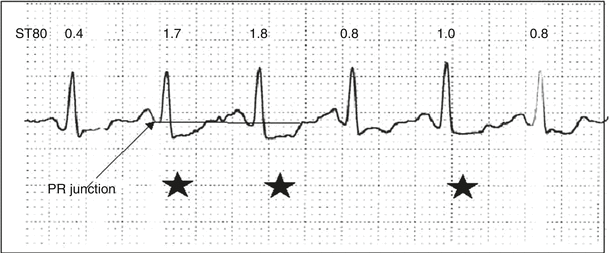
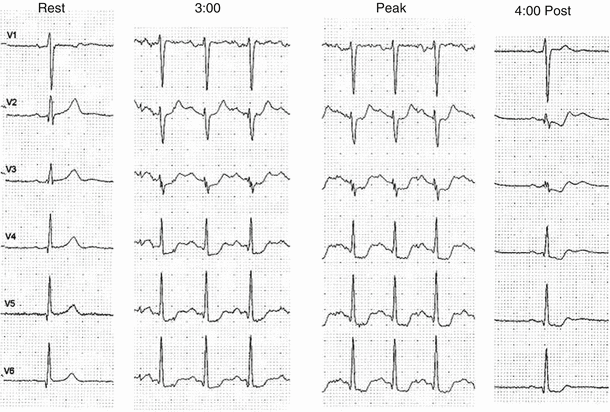

Fig. 8.7
Example of a continuous lead V5 recording during exercise. Of the six beats recorded with a relatively stable baseline, three are abnormal (star) with at least two consecutive beats that meet criteria for abnormality (J-point and ST80 ≥ 1 mm depressed). The remaining beats show lesser degrees of ST segment depression (0.4 and 0.8 mm ST80 depression) that do not meet criteria for abnormality. This type of ECG pattern with at least two consecutive abnormal beats and at least 50 % of all beats recorded abnormal should be considered an abnormal test in a patient that is at intermediate to high pretest clinical risk

Fig. 8.8
A 64-year-old man with chronic angina for 2 years is referred for testing because of decreased exercise tolerance over the last several months. The rest ECG is normal. The exercise ECG is abnormal in leads V3–V6 after 3:00 with slight worsening of the ST segment changes at peak. The ischemic abnormality persists 4:00 postexercise with downsloping ST segment depression. This classic ischemic response to exercise represents a high-risk study manifest by early onset of ischemic ECG changes involving five or more leads, persisting late into the recovery phase associated with ST segment depression ≥2 mm
ST-segment elevation may also indicate myocardial ischemia. Exercise-induced ST-segment elevation ≥1 mm occurring in a non-infarct territory usually indicates transmural ischemia and is associated with severe proximal coronary disease or coronary vasospasm. When ST-segment elevation >0.1 mV occurs in lead aVR, the likelihood of left-main or proximal left anterior descending (LAD) disease is increased [14]. While ST-segment depression does not localize the site of coronary ischemia, the localization of ST-segment elevation is relatively specific for the distribution of the coronary artery involved. ST-segment elevation ≥1 mm during exercise in Q wave leads from a prior myocardial infarction (MI) is often associated with more extensive wall motion abnormalities than patients without this finding; in most patients, this type of pattern does not represent an ischemic response (Fig. 8.9).
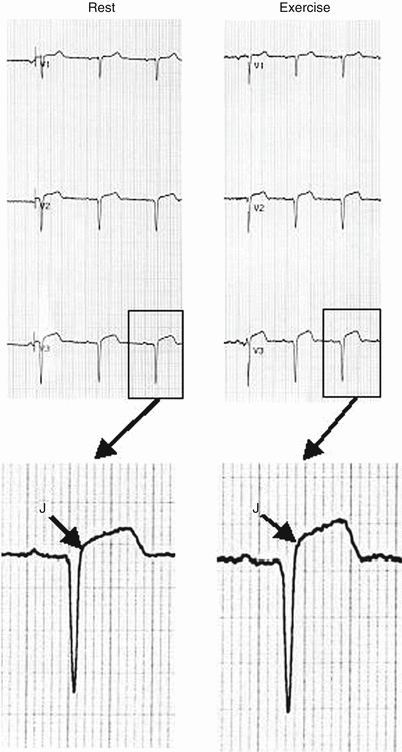

Fig. 8.9
A 46-year-old woman status post-anteroseptal myocardial infarction and percutaneous transluminal intervention (PCI) 4 days prior to testing. The rest ECG exhibits QS complexes in V1–V3 with J point elevation of 1.4 mm that becomes 2.5 mm at 80 ms after the J point. The post-exercise tracing (magnified) shows J-point elevation of 2.5 mm that becomes 3.5 mm at 80 ms after the J-point. Exercise-induced ST segment elevation in an infarct territory with QS complexes indicates a more extensive wall motion abnormality and decreased ejection fraction compared to post infarct patients without this finding. This type of abnormality does not generally indicate an ischemic response
T wave inversion, usually noted in the post-exercise phase, is not diagnostic of myocardial ischemia in the absence of ST segment depression criteria. The same is true for pseudonormalization of T waves (i.e. inverted T waves that become upright with exercise).
Exercise Testing in the Diagnosis of Coronary Artery Disease
Figure 8.10 illustrates how the sensitivity, specificity, and predictive accuracy of a noninvasive test can be determined. Sensitivity is decreased by false-negative results and specificity is decreased by false-positive results. In general, the sensitivity and specificity of a test are not influenced by the pretest likelihood of disease. However, the predictive accuracy of a test is highly dependent of the pretest estimate of disease according to bayesian theory [1].
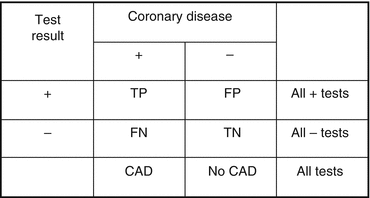

Fig. 8.10
Sensitivity = TP/CAD; specificity = TN/No CAD; predictive accuracy of a positive test = −TP/All + tests; predictive accuracy of a negative test = TN/All-tests; efficiency = (TP + TN)/All tests. FN false negative, FP false positive, TN true negative, TP true positive
In a meta-analysis of published trials of patients undergoing exercise testing and coronary arteriography, the mean sensitivity and specificity for the diagnosis of obstructive CAD ≥70 % were 68 and 77 %, respectively, and for 3-vessel or left main coronary disease ≥70 % were 86 and 53 % [15]. The sensitivity to detect obstructive CAD with exercise testing is increased when the coronary artery narrowing is more severe (e.g., stenosis ≥70 % vs. 50 %) and when CAD is more extensive (3 vessel vs. 1 vessel disease). The sensitivity for obstructive single vessel right or left circumflex is approximately 50 % even when the heart rate achieved is ≥85 % of age-predicted maximum. Thus, a patient should never be told he or she does not have obstructive coronary disease on the basis of a normal exercise ECG and normal exercise capacity. The sensitivity of the test is decreased when the level of exercise performed is submaximal, a limited lead set is used, or the ECG is abnormal with findings that reduce the potential to detect ST segment depression (i.e., extensive anterior Q-wave MI). Most published studies comparing non-invasive testing to coronary angiography suffer from posttest referral bias that increases sensitivity and decreases specificity since patients with a negative test tend not to be referred for catheterization, whereas patients with an abnormal test are referred for catheterization. When studies that avoid workup bias are examined, the sensitivity and specificity of horizontal or downsloping ST-segment depression ≥0.1 mV for obstructive CAD ≥70 % is 50 and 90 %, respectively [16, 17].
There are several situations in which the specificity of the exercise test to exclude CAD is reduced. Patients with left bundle branch block (Fig. 8.11), rest ST-segment depression ≥1 mm, Wolff-Parkinson-White syndrome (Fig. 8.12), left ventricular hypertrophy or patients on digitalis therapy, may have changes with exercise that are nondiagnostic for CAD; in this clinical setting it is best to perform the test in conjunction with an imaging procedure (i.e. nuclear or echocardiographic). During exercise, patients with right bundle branch block may manifest exercise induced ST segment depression in leads V1–V4, a non-specific finding for CAD (Fig. 8.13). Other causes of a false-positive test include severe anemia, hypoxia, and hypokalemia (Table 8.4). Mitral valve prolapse is associated with an increased incidence of false positives, particularly when the prolapse is moderate-severe. Women have a higher incidence of exercise-induced ST segment changes than men and in low-risk women, the presence of exercise induced ST segment depression is often a false-positive finding for CAD. When the diagnosis of CAD is in doubt, imaging studies should be considered. A negative ECG test in a woman with excellent exercise capacity carries similar diagnostic information as in men.
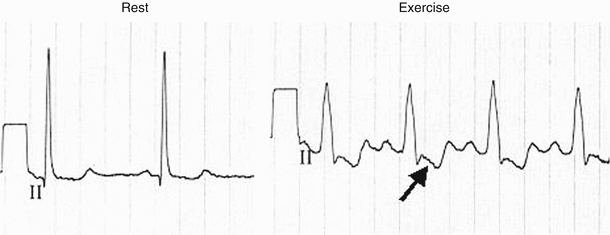
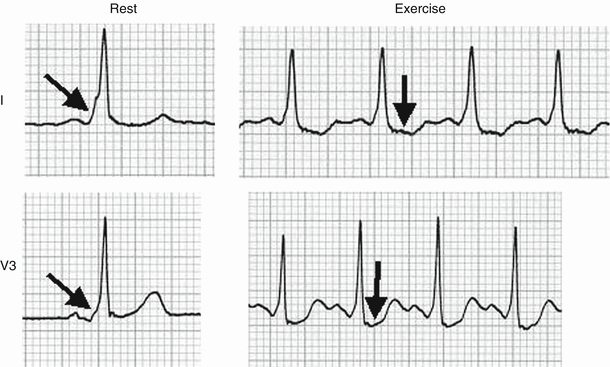
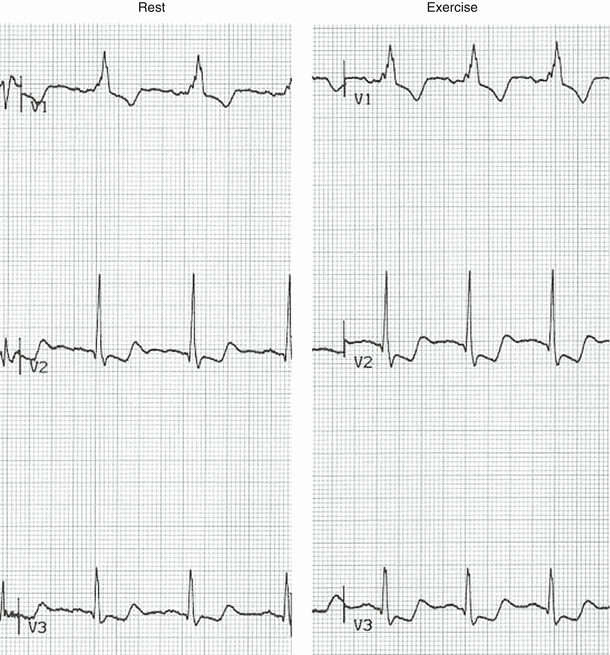

Fig. 8.11
A 63-year-old female with left ventricular hypertrophy (LVH) and QRS duration of 98 ms (rest) developed a rate-related left bundle branch block (LBBB) at a heart rate of 88/min that persisted throughout the exercise test. The ST depression observed (arrow) during the LBBB is non-diagnostic in the presence of the conduction disturbance

Fig. 8.12
This 42-year-old male was referred for atypical chest pain. The rest ECG shows a preexcitation pattern with a short PR interval and delta wave (arrow). The exercise tracing shows persistence of the delta wave and exercise-induced down-sloping ST segment depression of 0.9 mm in lead I (arrow) and horizontal ST segment depression of 1.9 mm in lead V3 (arrow). Exercise-induced ST segment depression is a non-diagnostic finding for coronary artery disease in patients with preexcitation syndrome

Fig. 8.13
A 62-year-old man referred for atypical chest pain 3 years after a coronary bypass procedure. The rest ECG exhibits right bundle branch block (RBBB). In lead V2 at rest, the J point and ST80 are depressed 0.8 and 1.3-mm. The postexercise tracing in lead V2 shows 2.3- and 3.1-mm depression respectively. Leads V1 and V3 are also more depressed than at rest. Exercise-induced ST segment depression in leads V1 to V4 is a non-specific finding in patients with RBBB
Table 8.4
Noncoronary causes of ST segment depression
Anemia |
Atrial fibrillation |
Cardiomyopathy |
Digitalis use |
Glucose load |
Hyperventilation |
Hypokalemia |
Intraventricular conduction disturbance (particularly left bundle branch block) |
Left ventricular hypertrophy |
Mitral valve prolapse |
Preexcitation syndrome |
Severe aortic stenosis |
Severe hypertension |
Severe hypoxia |
Severe volume overload (aortic, mitral regurgitation) |
Sudden excessive exercise |
Supraventricular tachyarrhythmias |
The posttest likelihood of CAD in a patient should be estimated from the data obtained from the exercise test and the pre–test likelihood of CAD. Since the sensitivity and specificity of exercise electrocardiography are less than 100 %, false-positive tests are more likely in patients with a low pretest likelihood of CAD such as young asymptomatic women without atherosclerotic risk factors than in older men with typical angina. The posttest likelihood of CAD is increased in subjects with more abnormal exercise test results (≥0.2 mV ST segment depression at low exercise workloads vs. a borderline abnormal ECG at high exercise workloads). Similarly, false-negative results are more common when the pretest likelihood of CAD is high. These bayesian principles should be used to estimate posttest likelihood of CAD and should also be applied when risk-stratifying patients for future cardiac event rates using the exercise test.
Prognostic Use of Exercise
Electrocardiography
A major indication for exercise testing is to estimate the prognosis and determine the need for subsequent workup that may include cardiac catheterization and coronary revascularization. If the posttest likelihood of a cardiac event, estimated using clinical and exercise test variables cannot be reduced by a coronary revascularization procedure (e.g. estimated 5-year risk of a cardiac event after exercise testing <0.8 %/year), then there is little need to proceed further. Exercise test variables associated with an increased likelihood of multivessel disease and future cardiac events include early onset of ischemia (Figs. 8.6 and 8.8), angina, or complex ventricular arrhythmias at low exercise workloads, inability to complete low levels of work (i.e., functional capacity <5 METs), extensive and profound exercise-induced ST segment abnormalities, hemodynamic instability such as a drop in systolic blood pressure during exercise, abnormal heart rate response (Fig. 8.1), and persistence of ischemic changes late into the recovery phase (Fig. 8.8, Table 8.3).
Functional capacity is one of the most important prognostic exercise test variables since it provides a global estimate of cardiac and pulmonary reserve. Patients that have the onset of ST segment depression at high exercise workloads (e.g., >10 METs) have a favorable prognosis regardless of whether or not abnormal ST segment depression is present [2]. Myers et al. [18] reported a 12 % increase in survival for every 1 MET increment in exercise capacity in a 6,213 patient cohort followed for a mean of 6 years (Fig. 8.14). Marshall et al. [19] reported an annual cardiac event rate of <0.5 %/year in 516 patients that were able to complete 9 min on a Bruce protocol. Cardiac event rates at these high workloads were similar regardless of the results of the exercise ECG or myocardial perfusion scan. The risk gradient for future cardiac events is greatest in individuals who cannot perform exercise, followed by those that are unable to complete the exercise protocol. The lower the exercise capacity, estimated in METs, the greater the risk. Patients with exercise-induced ischemia or hemodynamic compromise (e.g., hypotension) at low workloads (i.e., <5 METs) should be referred for cardiac catheterization and revascularization if there are no clinical contraindications. The likelihood of angiographic high-risk anatomy is high, and if present, would be an indication for coronary revascularization regardless of symptomatic status.
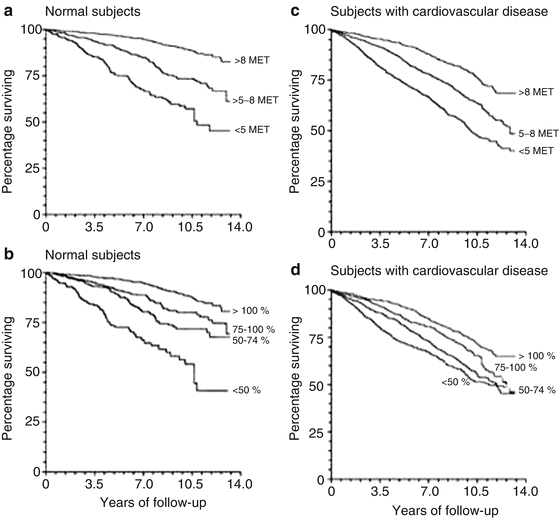

Fig. 8.14
Survival curves for normal subjects stratified according to peak exercise capacity (a) and according to the percentage of age-predicted exercise capacity achieved (b) and survival curves for subjects with cardiovascular disease stratified according to peak exercise capacity (c) and according to the percentage of age predicted exercise capacity achieved (d). These figures show that the survival rate was lower for patients with decreased exercise capacity (From Myers et al. [18] Massachusetts Medical Society. Reprinted with permission from Massachusetts Medical Society)
Exercise testing should never be categorized as positive or negative based solely on the ST segment response. The entire variable set that includes final exercise capacity, hemodynamic and heart rate responses, symptoms, and workload at which symptoms or the ischemic response become manifest is critical in order to provide the best prognostic estimates possible. Mark and colleagues [20] devised a treadmill score and applied it to 2,842 symptomatic inpatients who were being evaluated by treadmill exercise testing and cardiac catheterization. The treadmill score was calculated on the basis of the duration of exercise, the amount of maximal electrocardiographic depression, and the presence or absence of angina occurring during exercise. The authors found that the treadmill score was a better discriminator than clinical assessment alone and appeared to better distinguish patients who subsequently died from those who lived. Approximately one third of patients had scores indicating low risk (≥ +7) with a 93 % 5-year survival rate (i.e., annual mortality rate of 1.4 %). High-risk scores (≤ −11) occurred in 13 % of patients; the mortality rate in this group was 3 times greater, with a 67 % 5-year survival rate (i.e., annual mortality rate of approximately 7 %).
Stay updated, free articles. Join our Telegram channel

Full access? Get Clinical Tree


