The exercise heart rate (HR) profile and its relation to cardiac function and arrhythmias were investigated in patients with hypertrophic cardiomyopathy (HC). Chronotropic response (CR) and heart rate recovery (HRR) were computed during and after treadmill exercise testing in 273 patients with HC and 95 age-matched healthy controls. Patients with HC had higher prevalence of chronotropic incompetence and lower HRR 1–5min compared with controls. Exercise capacity, diastolic function (assessed by E/e’) and left atrial volume index were associated with HRR 1min and CR in HC. Septal myectomy was associated with reduction in chronotropic incompetence but did not affect HRR 1min . In conclusion, impaired CR and HRR 1min are associated with advanced disease and do not appear to be independent clinical markers indicating high-risk status in HC. Improving CR by titrating doses of negative chronotropic agents, myectomy, and atrial pacing may be useful to increase exercise capacity in patients with HC.
Hypertrophic cardiomyopathy (HC) is the most common genetic cardiovascular disorder, with a prevalence of approximately 1:500 in the general population and the most frequent cause of sudden cardiac death (SCD) in young patients. Hypertrophy, myocyte disarray, electrical remodeling, and fibrosis provide a substrate for reentrant arrhythmias, whereas alterations in autonomic function can serve as triggers for malignant ventricular arrhythmias. In this study, we used the exercise stress test to gather information on the state of the autonomic nervous system and its responsiveness in patients with HC. We measured the peak heart rate (HR) response during exercise to assess sympathetic drive to the heart and postsynaptic responsiveness of β-adrenergic receptors in the sinoatrial node and postexercise heart rate recovery (HRR) at 1 minute to noninvasively quantify parasympathetic function. Blunted chronotropic response (CR) and HRR have been demonstrated to predict mortality in patients with coronary artery disease. However, it is not known whether CR and HRR are markers of risk (mortality and ventricular arrhythmias) in HC. In this study, we assessed CR and HRR (HR profile) during and after a treadmill exercise test and examined the relation between the HR profile, cardiac function, and arrhythmias in 273 patients with a clinical diagnosis of HC.
Methods
This study was approved by the Institutional Review Board at Johns Hopkins. Written informed consent was obtained in all patients. Consecutive, unrelated, adult patients (n = 273; 190 men; mean age, 50 ± 15 years) who were seen in the Johns Hopkins HC clinic from 2006 to 2011 were retrospectively studied if they fulfilled the standard diagnostic criteria for HC, namely left ventricular hypertrophy in the absence of other causes, such as hypertension and/or valvular disease. Patients were excluded if they were atrially paced, pacemaker dependent, or had known pulmonary disease. Mean patient follow-up was 37 months. Clinical information, including baseline demographic characteristics, clinical status, and cardiac magnetic resonance (CMR), echocardiographic, and positron emission tomography (PET) results were abstracted from the medical record of each subject. The control group consisted of 95 age-matched healthy subjects (56 men; mean age 49 ± 17 years) without evidence of any manifest metabolic or clinical cardiovascular disease.
The clinical information recorded at the initial presentation included age, gender, symptoms, functional capacity according to the New York Heart Association (NYHA) classification, and risk factors for SCD. Based on previous studies, 5 clinical features were defined as risk factors for SCD in HC: (1) family history of ≥1 HC-related SCD, (2) ≥1 episode of unexplained recent syncope, (3) massive LV hypertrophy (thickness ≥30 mm), (4) nonsustained or sustained ventricular tachycardia (VT) on ambulatory 24-hour (Holter monitor) electrocardiography, and (5) hypotensive response to exercise.
Implantable cardioverter defibrillator (ICD) discharges and VT events were recorded by reviewing Holter and exercise electrocardiographic tracings, ICD interrogation reports, and clinic visit notes. Sustained VT was considered as VT with a rate >100 beats/min and duration >30 seconds or VT that resulted in an ICD discharge. Appropriate ICD discharges were all confirmed by an electrophysiologist and resulted from ventricular tachyarrhythmias, not arrhythmias, such as atrial flutter or fibrillation associated with a rapid ventricular response or device/lead malfunction.
Symptom-limited exercise was performed on a treadmill according to the standard or modified Bruce’s protocol. The most common reasons for termination of exercise were dyspnea and fatigue. A physician unaware of the baseline echocardiographic results was present during all studies to encourage maximal exertion. Exercise tolerance was defined by the achieved, estimated metabolic equivalent (MET).
Peak HR (HR peak ) was defined as the HR at the end of the exercise test, whereas baseline HR (HR baseline ) was the HR measured with the patient supine before the exercise test. HRR was measured as the difference between peak HR and HR at 1 to 5 minutes after exercise, in the supine position with no cool-down period at the end of exercise. Because there are no established criteria for HRR in HC, the lowest quartile in this HC cohort (≤20 beats/min) was used to define abnormal HRR at first minute after exercise, an approach that has been used previously.
Chronotropic response (CR) was assessed by calculating the percentage of HR reserve used: (peak HR − baseline HR)/(220 − age − baseline HR) × 100%. Chronotropic incompetence (CI) was defined as a low proportion of HR reserve used: a cut-off value of <80% was used in patients not receiving β blockers and <62% in patients receiving β-blocker therapy.
A normal BP response was defined as an increase of at least 20 mm Hg in systolic BP during exercise, with a gradual decrease during recovery. Impaired BP responses were defined as either (1) an initial increase in systolic BP with a subsequent decrease of >20 mm Hg compared with the BP value at peak exercise or a continuous decrease in systolic BP throughout the exercise test of >20 mm Hg compared with BP at rest (termed hypotensive responses) or (2) an increase of <20 mm Hg in systolic BP from resting state to peak exercise (termed a flat response).
A standard clinical scanning protocol was implemented in all subjects using a GE Vivid 7 ultrasound machine (GE Ultrasound, Milwaukee, Wisconsin) equipped with a multifrequency phased-array transducer. Complete 2-dimensional and Doppler echocardiograms were analyzed offline by a single observer who was blinded to patient factors. All echocardiographic parameters were averaged over 3 cardiac cycles or 3 measurements. Peak left ventricular outflow tract gradients were measured at rest and after exercise in all patients with HC.
A subset (n = 205) of patients with HC underwent CMR before and after administration of 0.2 mmol/kg of Gadopentate Dimeglumine (Magnevist; Shering, Germany), using a 1.5-T clinical scanner (Siemens Avanto, Erlangen, Germany) and a phased-array receiver coil placed on the chest. A semi-automated threshold technique using 6 SDs more than the mean signal intensity of the normal nulled myocardium was used to assess delayed enhancement (DE).
A subset (n = 51) of patients with HC underwent perfusion PET imaging using 13-NH3 to assess for inducible ischemia. PET was performed using a GE Discovery VCT PET/CT System (Waukesha, Wisconsin). Coronary vasodilation was achieved by administration of Dipyridamole (0.56 mg/kg) or Regadenoson (0.4 mg). For myocardial blood flow (MBF) quantification, volumetric sampling of the myocardial tracer activity was performed by manual definition of the long heart axis, followed by software computation and displayed as a static polar map. Subsequently, the static polar map–defined segments were reapplied to dynamic imaging series to create quantitative polar maps and, thus, myocardial time-activity curves. A small region of interest was positioned in the LV cavity to obtain the arterial input function. Using these data, MBF was calculated by fitting the arterial input function and myocardial time-activity curves from the dynamic polar maps to a well-established 2-tissue compartment tracer kinetic model. This model includes corrections for potential underestimation of tissue activity because of partial volume effect and spillover activity from the left and right ventricular cavities into the myocardial wall. Global left ventricular MBF during vasodilator stress and rest was measured in milliliters per minute per gram (ml/min/g).
Quantitative variables are expressed as central tendency and dispersion measures, opting for mean and SD or median and interquartile deviation (based on dispersion of data). Categorical variables are presented as relative frequencies. Student’s t test and analysis of variance were used as parametric tests. The fulfillment of normality assumption was evaluated using the Shapiro-Wilk test and homogeneity of variance. Nonparametric tests (Mann-Whitney U and Kruskal-Wallis tests) were used if the assumptions of normality were not met. To establish association between categorical variables, chi-square test was used; when Cochran’s rule was not met, Fisher’s exact test was used. Correlation between quantitative variables was assessed using the Pearson correlation coefficient. The Bonferroni correction was used in the case of multiple tests. A linear regression model was used to analyze factors that affect HRR 1min and CR. Residual analysis and identification of influential points were performed to establish the best model. A p value <0.05 was considered statistically significant.
HRR was defined as abnormal based on the lowest quartile of HR during the first minute of recovery in our study population, an approach that has been used before (≤20 beats/min). Statistical analysis was carried out using the computer software Statistical Program for Social Sciences (SPSS) 17.0 (Chicago, Illinos).
Results
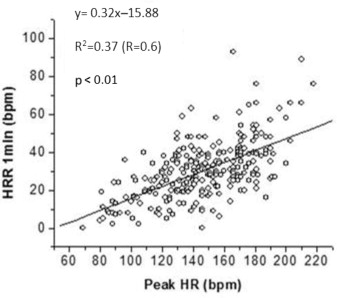
Consecutive patients with HC were studied. The control group consisted of 95 age-matched healthy subjects. All patients with HC and controls were in sinus rhythm. Patients with HC had a higher prevalence of CI (p <0.001) and lower HRR indices at 1 to 5 minutes after exercise ( Table 1 ). HRR 1min was positively correlated with peak HR during exercise ( Figure 1 ) in patients with HC. An abnormal BP response to exercise was seen in 10% of the patients with HC and 7% of the controls.
| Variables | HC (n=273) | Controls (n=95) | p-value |
|---|---|---|---|
| HRR 1min (bpm) | 29±9 | 34±6 | 0.004 ∗ |
| HRR 2min (bpm) | 46±12 | 58±7 | <0.0001 ∗ |
| HRR 3min (bpm) | 54±13 | 70±8 | <0.0001 ∗ |
| HRR 4min (bpm) | 58±13 | 76±8 | <0.0001 ∗ |
| HRR 5min (bpm) | 59±12 | 80±8 | <0.0001 ∗ |
| Percentage of CI | 0.52 | 0.15 | <0.001 † |
| Percentage with ABPR | 0.097 | 0.07 | <0.001 |
Patients with HC were classified into 2 groups (normal and blunted HRR) based on HRR at 1 minute ( Table 2 ). Patients with HC who exhibited a blunted HRR at 1 minute after exercise, presumably because of impaired vagal reactivation, had a higher proportion of NYHA class III/IV symptoms, angina, lower peak exercise capacity and HRs, higher LV mass, higher rest left ventricular outflow tract gradients (LVOTGs), worse diastolic function (larger left atrium, higher E/e’), and higher prevalence of DE by CMR than patients with HC with normal HRR ( Table 2 ), suggesting advanced disease.
| Variables | HRR 1min >20 bpm (n=203) | HRR 1min ≤20 bpm (n=70) | p-value | Chronotropic incompetence (n=142) | Normal CR (n=131) | p-value |
|---|---|---|---|---|---|---|
| Clinical Variables | ||||||
| Age(yrs) | 49±9 | 58±8 | <0.0001 ∗ | 52±13 | 47±16 | 0.0041 † |
| Gender (male) | 0.72 | 0.61 | 0.08 ‡ | 0.68 | 0.71 | 0.63 ‡ |
| NYHA class (3, 4) | 0.04 | 0.23 | <0.001 ‡ | 0.14 | 0.05 | <0.001 ‡ |
| Angina | 0.2 | 0.36 | 0.006 ‡ | 0.31 | 0.18 | 0.019 ‡ |
| Dyspnea | 0.4 | 0.72 | <0.001 ‡ | 0.63 | 0.34 | <0.001 ‡ |
| Beta-blockers | 0.6 | 0.63 | 0.6 ‡ | 0.73 | 0.58 | <0.001 ‡ |
| ABPR | 0.24 | 0.58 | 0.1 ‡ | 0.33 | 0.2 | 0.014 ‡ |
| Baseline HR(bpm) | 73±8 | 72±10 | 0.6 ∗ | 68±7.5 | 78±8 | <0.0001 ∗ |
| Peak HR(bpm) | 154±25 | 120±26 | <0.001 † | 130±13.5 | 170±13 | <0.0001 ∗ |
| Total Exercise Time(s) | 596±189 | 380±218 | <0.001 | 480±204 | 622±202 | <0.001 |
| METs | 11.3±2.5 | 6.85±1.6 | <0.0001 ∗ | 8.3±2 | 12.85±2.9 | <0.0001 ∗ |
| HRR Variables | ||||||
| HRR 1min (bpm) | – | – | – | 25±8.5 | 35±8 | <0.0001 ∗ |
| HRR 2min (bpm) | 50±8 | 26±5 | <0.0001 ∗ | 37±10.5 | 54±8.5 | <0.0001 ∗ |
| HRR 3min (bpm) | 59±19 | 33±7 | <0.0001 ∗ | 42±16 | 64±15 | <0.0001 † |
| HRR 4min (bpm) | 63±15 | 36±13 | <0.0001 † | 46±16 | 69±15 | <0.0001 † |
| HRR 5min (bpm) | 66±10 | 38±8 | <0.0001 ∗ | 46±10.8 | 70±16.8 | <0.0001 ∗ |
| Imaging Variables | ||||||
| Maximal IVS(cm) | 2±0.3 | 2.1±0.3 | 0.3 ∗ | 2±0.35 | 2±0.35 | 0.6608 ∗ |
| LV Mass(g) | 241±52 | 267±56 | 0.02 ∗ | 254±52.5 | 235±54 | 0.0398 ∗ |
| LVOT peak gradient-rest(mm Hg) | 12±10 | 21±17 | 0.003 ∗ | 19.5±18 | 10±7.5 | 0.0001 ∗ |
| LVOT peak gradient-stress (mmHg) | 43±39 | 54±39 | 0.305 ∗ | 56.5±37 | 36±26.5 | 0.0557 ∗ |
| LA Volume (ml) | 68±19 | 88±27 | 0.003 ∗ | 75±22 | 62±20 | 0.0089 ∗ |
| LAVI (ml/m 2 ) | 34±8.5 | 39±9 | 0.019 ∗ | 36±8.5 | 32±8 | 0.0161 ∗ |
| LVEF (%) | 68±7 | 69±5 | 0.5 ∗ | 70±6.5 | 67±7 | 0.0083 ∗ |
| MV E/A | 1.2±0.2 | 1.1±0.3 | 0.02 ∗ | 1.2±0.3 | 1.2±0.26 | 0.6226 ∗ |
| MV E/e’ | 15±4 | 18.5±6 | 0.003 ∗ | 18±5.5 | 14±3.5 | <0.0001 ∗ |
| Patients with DE on CMR (%) | 64 | 78 | 0.09 ‡ | 71 | 64 | 0.303 ‡ |
| Stress MBF (ml/min/gm) | 2.0±1.1 | 2.1±0.8 | 0.7 | 2.0±0.8 | 2.1±0.9 | 0.8 |
| Rest MBF (ml/min/gm) | 0.9±0.2 | 0.9±0.3 | 0.7 | 0.9±0.3 | 0.9±0.3 | 0.8 |
CI was seen in 31% of patients with HC. Patients with CI had lower HR at baseline, were older, with higher prevalence of NYHA class III/IV symptoms, and demonstrated lower exercise capacity, delayed HRR 1min after exercise, higher rest LVOTGs, and greater diastolic dysfunction (reflected by higher E/e’) than patients with HC who had a normal CR to exercise ( Table 2 ). However, there was no difference in left atrial (LA) volumes, prevalence of DE by CMR, and stress/rest MBF between the 2 groups.
Patients with HC with normal HRR 1min and CR were younger, had the highest exercise capacity, lowest rest LVOTGs, and better diastolic function (manifested by lowest LA volume index and E/e’), compared with the rest of the HC cohort ( Table 3 ). Impairment of CR and HRR 1min was seen in 20% of patients with HC—this subgroup had the highest prevalence of DE on CMR compared with the rest of the HC cohort. Isolated impairment of HRR 1min or CR was seen in 4% and 31% patients, respectively ( Table 3 ).
| Variables | Normal HRR 1min and CR (n=118) | Abnormal CR (n=85) | Abnormal HRR 1min (n=13) | Abnormal HRR 1min and CR (n=57) | p-value |
|---|---|---|---|---|---|
| Clinical Variables | |||||
| Age (yrs) | 46±15 | 49±12 | 61±14 | 57±12 | <0.0001 ∗ |
| Gender (male) | 0.73 | 0.72 | 0.54 | 0.63 | 0.3 ‡ |
| NYHA(3,4) | 0.03 | 0.05 | 0.15 | 0.19 | 0.001 |
| Angina | 0.18 | 0.24 | 0.23 | 0.4 | 0.01 ‡ |
| Dyspnea | 0.31 | 0.54 | 0.62 | 0.75 | <0.0001 ‡ |
| Beta-blockers | 0.47 | 0.78 | 0.54 | 0.65 | <0.0001 ‡ |
| Percentage ABPR | 0.21 | 0.29 | 0.08 | 0.4 | 0.02 ‡ |
| Baseline HR (bpm) | 78±13 | 68±12 | 93±16 | 71±13 | <0.0001 ∗ |
| Peak HR (bpm) | 170±17 | 134±16 | 156±14 | 114±21 | <0.001 |
| Exercise Time (s) | 649±189 | 529±171 | 379±154 | 406±227 | <0.001 |
| METs | 13±3 | 9.7±2 | 7.2±1.7 | 6.6±1.5 | 0.0001 † |
| HRR (bpm) | |||||
| HRR 2min | 56±8 | 44±6 | 33±3 | 24±5 | 0.0001 † |
| HRR 3min | 65±8 | 49±8 | 43±5 | 31±7 | 0.0001 † |
| HRR 4min | 68±8 | 54±7 | 48±10 | 34±6 | 0.0001 † |
| HRR 5min | 70±7 | 54±9 | 50±7 | 35±7 | <0.0001 † |
| Imaging Variables | |||||
| Maximal IVS(cm) | 2.0±0.5 | 2.1±0.5 | 2.3±0.7 | 2.1±0.5 | 0.6 ∗ |
| LV Mass(g) | 233±50 | 250±50 | 312±83 | 266±44 | 0.04 † |
| LVOT peak Gradient-rest (mm Hg) | 10±6 | 17±18 | 12.5±16 | 22±17 | 0.0003 † |
| LVOT peak Gradient-stress (mm Hg) | 36±25 | 53±36 | 32±50 | 62±37 | 0.2 † |
| LA Volume (ml) | 62±20 | 70±18 | 80±65 | 83±18 | 0.006 † |
| LAVI (ml/m 2 ) | 30±8 | 35±8 | 40±31 | 39±9 | 0.02 † |
| LVEF (%) | 66±11 | 697±10 | 65±9.54 | 69±10 | 0.06 ∗ |
| MV E/A | 1.2±0.2 | 1.2±0.2 | 0.99±0.2 | 1.1±0.3 | 0.1 † |
| MV E/e’ | 14±3.5 | 18±5 | 17±4.5 | 19±7 | 0.0001 † |
| Patients with DE on CMR (%) | 0.606 | 0.535 | 0.666 | 0.812 | 0.04 ‡ |
| Stress MBF (ml/min/gm) | 2.0±0.9 | 2.2±0.8 | 2.0±0.3 | 1.8±0.3 | 0.5 |
| Rest MBF (ml/min/gm) | 0.9±0.3 | 0.9±0.3 | 0.8±0.5 | 0.8±0.3 | 0.7 |
Stay updated, free articles. Join our Telegram channel

Full access? Get Clinical Tree


