The accepted definition of virtual histology intravascular ultrasound (IVUS-VH) thin-cap fibroatheroma (TCFA) is only a modest predictor of plaque rupture (PR). We sought to determine the relation between IVUS-VH findings and culprit lesions with PR using computational analysis. A total of 80 culprit lesions from 80 patients with stable angina (n = 37), unstable angina (n = 20), and myocardial infarction (n = 23) were divided into those with (n = 15) and without PR (n = 65). By use of automated computational analysis, the standard IVUS-VH TCFA criterion and 124 additional criteria were compared. The standard TCFA definition demonstrated modest ability to discriminate lesions with and without PR (sensitivity 87%, specificity 37%, PPV 0.24, and NPV 0.92). Of 124 additional IVUS-VH TCFA definitions, only 2 improved the discriminative ability even modestly. However, a positive correlation was demonstrated between cavity size and necrotic core percentage ( r = 0.78, p <0.01) and a negative correlation with percentage of fibrous tissue ( r = −0.81, p <0.01). In conclusion, IVUS-VH criteria were only modestly associated with PR, without significant improvement by varying IVUS-VH TCFA features, but IVUS-VH features of ruptured plaques were strongly correlated with cavity size.
Virtual histology intravascular ultrasound (IVUS-VH) provides a method for assessing plaque composition and morphometry using radiofrequency (RF) analysis. Previous observational studies have elucidated the association of IVUS-VH defined thin-cap fibroatheroma (TCFA) with an increased risk of cardiovascular events. However, definitions of TCFA through IVUS-VH have been based on attempting to mimic histopathologic findings and have shown some variation. In addition, this accepted IVUS-VH definition is subject to considerable interobserver variability. Our aim was to use computational analysis to determine whether the standard IVUS-VH TCFA definition or any pattern of IVUS-VH findings were more common in lesions with plaque rupture (PR) than those without PR. Our primary objective was to compare the relative value of the standard IVUS-VH TCFA definition to multiple IVUS-VH plaque characteristic patterns in its association to PR by analyzing 124 additional variations of the IVUS-VH TCFA definition through the use of proprietary software for automated computational analysis. Our secondary objective was to investigate whether any specific IVUS-VH features are associated with PR cavity size.
Methods
The Loyola University Medical Center Intravascular Imaging Database was created in 2007 and approved by the institutional review board for retrospective review of intravascular imaging procedures at the time of clinically indicated cardiac catheterization and coronary intervention, and all patients provided informed consent for inclusion in this registry. From this registry, 80 patients with stable angina (n = 37), unstable angina (n = 20), and myocardial infarction (n = 23) were selected for inclusion in this study based on the performance of preprocedure IVUS-VH imaging before culprit lesion modification and determination of high quality IVUS data with consistent and reliable automated pullback at least 30 mm in length.
Baseline demographic and clinical data were obtained for every patient. Hypertension was defined per the Eighth Joint National Committee guidelines. Hyperlipidemia was defined as a total serum cholesterol >200 mg/dl, low-density lipoprotein cholesterol >100 mg/dl, triglyceride level >200 mg/dl, or preexisting use of a lipid-lowering agent. Diabetes mellitus was defined as fasting blood glucose level of >125 mg/dl or an established diagnosis of diabetes mellitus treated with oral hypoglycemics and/or insulin.
Before revascularization of the culprit lesion, the vessel was wired with a 0.014 guidewire, and angiographic imaging was performed in multiple views. Traditional grayscale and RF (virtual histology, VH) IVUS was performed in standard fashion using the IVUS phased array probe (Eagle Eye 20 MHz 2.9 F monorail; Volcano Corporation, Rancho Cordova, California), IVUS console, In-Vision Gold software, and automatic pullback at 0.5 mm/s (research pullback, model R-l00). VH-IVUS uses spectral analysis of IVUS RF data to classify plaque into 4 components: fibrous (F), fibro fatty (FF), calcified (C), and necrotic core (NC). After administration of 200 μg of intracoronary nitroglycerin, the IVUS catheter was inserted into the target vessel beyond a distal fiduciary point and underwent automated pullback to the aorto-ostial junction. The proximal fiduciary point was the left main bifurcation in the left coronary artery and the ostium of the right coronary artery.
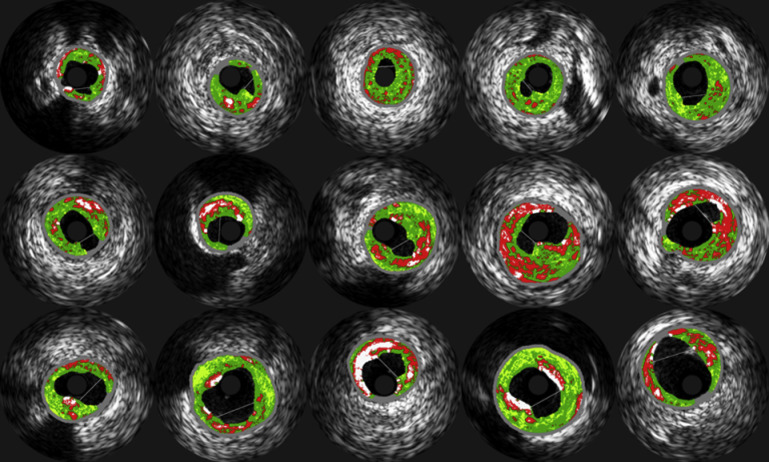
Original grayscale IVUS, with luminal and external elastic lamina vessel wall segmentation, as well as color-coded maps of IVUS-VH data were archived after onto DVDs after manual border correction of every frame by an expert reader and transferred to the University of Iowa Institute for Biomedical Imaging for quantitative data analysis. A proprietary in-house automated system was developed to obtain quantitative indexes of coronary morphology and plaque composition for all frames of each IVUS-VH pullback. Morphologic indexesand IVUS-VH–derived TCFA presence index were calculated in a 3-frame IVUS-VH segment, the center frame of which was identified as the culprit frame. Culprit frame location and PR was assessed by 2 independent experienced readers (TK and ZC) and differences were resolved by consensus. A ruptured plaque was defined as a cavity that communicated with the lumen containing an overlying residual fibrous cap fragment. To assess intraobserver variability, the EEM and lumen area of 10 randomly selected patients were measured twice on 2 separate sessions. Results were expressed as a linear regression correlation coefficient between the 2 measurements. The intraobserver correlation coefficient for EEM area was 0.96 and for lumen area 0.98. The mean (SD) differences were for minimal lumen area 0.08 mm 2 (±0.14 mm 2 ) and EEM 0.25 mm 2 (±0.42 mm 2 ). The identification of the culprit lesion location in each patient was based within the angiographic segment identified by the operator for the coronary intervention, with the IVUS culprit frame identified as the grayscale frame with either (1) the largest PR site or (2) in the case of non-PR lesions, the frame with the smallest minimal lumen area. All 15 PRs are demonstrated in Figure 1 .

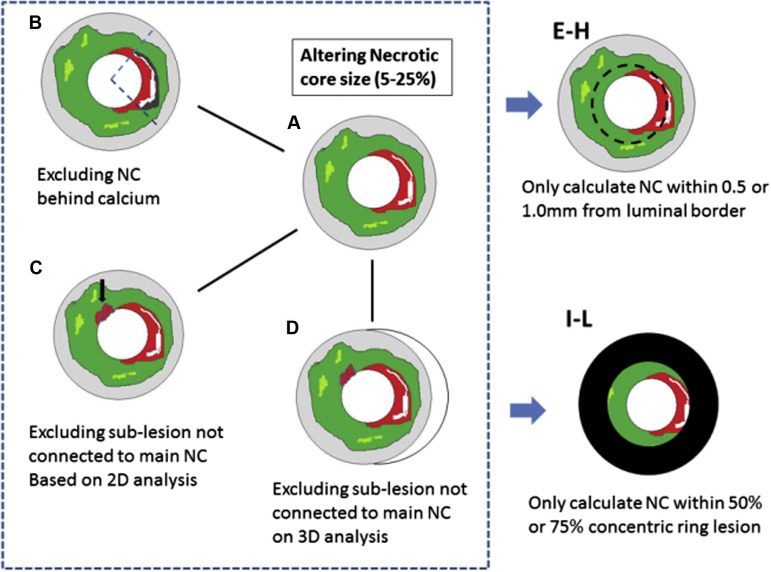
Conventionally, IVUS-VH TCFA is defined as containing tissue-stype/plaque morphology with the following characteristics: (1) necrotic core >10% of the plaque area, with (2) no overlying fibrous tissue on the luminal border in a frame with (3) >40% plaque burden. We defined and tested 124 additional IVUS-VH TCFA variants and subvariants to determine their comparative value in differentiating PR from non-PR lesions (NPR) compared with the traditional definition by computational analysis. The main IVUS-VH variants were labeled definition A through H. The only variable in definition A (n = 5) is the required minimum NC percentage (5%, 10%, 15%, 20%, and 25%), resulting in 5 subvariants. Definition B (n = 5) excluded any necrotic core on the abluminal side of calcification to exclude artifactual shadowing, otherwise following definition A rules. Definition C (n = 5) only considered NC content based on direct connectivity to the main necrotic core (“contiguous”), based on 2-dimensional analysis (i.e., within each IVUS-VH frame). Definition D (n = 5) further extended this contiguous analysis into 3 dimensions (i.e., added axial context along the pullback direction). Based on definitions A/B/C/D, 4 additional variants noted as definitions E/F/G/H (n = 40) were created that only considered the necrotic core threshold being met within 0.5 mm or 1 mm (2 subvariants) of the luminal border rather than requiring direct VH contact of the necrotic core with the lumen as in Definitions A-D. Similarly, definitions I to L (n = 40) only considered the necrotic core threshold when located within the luminal 50% or 75% of the plaque (2 subvariants; Figure 2 ). Finally, additional 25 criteria were created by assessing the necrotic core connectivity by polar coordinates instead of Cartesian coordinates.

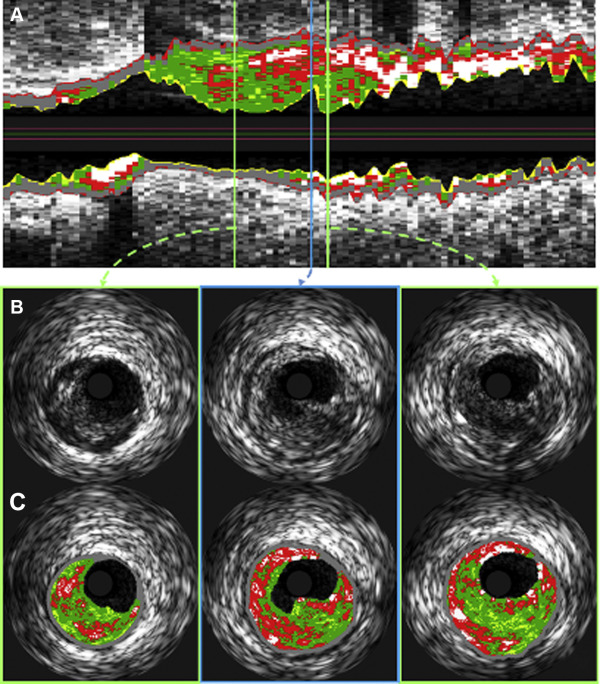
PR cavity area was defined as the area of the vessel lumen, which resulted from PR which fell outside the expected vessel wall contour. To determine the rupture cavity area, the postrupture lumen was separated into 2 subregions—a subregion depicting the original intact lumen and one with the newly formed cavity. For this purpose, a straight split line was drawn by an expert observer by connecting 2 lumen contour points corresponding to the points of transition from the original lumen to the rupture subregion as shown in Figure 3 . Cavity area was measured by automatically counting the number of pixels in the cavity region followed by conversion to mm 2 according to the calibration information present in the IVUS image DICOM files. The cavity angle was measured from the luminal center to the 2 expert-defined points and served as an indicator of the angular cavity extent. The combination of cavity area and cavity angle provides a ratio between depth and circumferential extent of the rupture. To examine which plaque depth is most important for rupture development, a layered analysis was performed in wall rings with adaptive radii of 10% up to 100%, in increments of 10%, representing the relative distance between the lumen and EEM borders. This concept is illustrated in Figure 3 , in which the green region shows an example of the 30% adaptive ring. The proximal and distal reference frames were defined as the closest adjacent non–ruptured IVUS-VH frames. For these frames, the plaque composition of the frame was recorded and compared against the plaque composition in the ruptured frame ( Figure 4 ).


Mean values ± SDs (or percentages) were calculated for all continuous variables and compared between PR and NPR groups by the Student t test. Categorical variables including variations in IVUS-VH TCFA definitions were compared by contingency tables with frequency distributions, with statistical significance calculated by Fisher’s exact test. R environment and SPSS software, version 21 (SPSS, Chicago, Illinois) were used for statistical computing. A p value of <0.05 denoted statistical significance.
Results
A total of 80 culprit lesions from 80 patients (age 62 ± 10, 57 men) were analyzed. Table 1 summarizes the clinical and lesion characteristics of these 80 patients. Patients with PR presented more often with non–ST elevation myocardial infarction compared with patients without rupture (46% vs 20%, p <0.05). There were no significant differences in clinical risk factors or medication use at the time of presentation. Grayscale and VH-IVUS measurements are summarized in Table 2 . There were no significant differences in lumen size and plaque morphology between plaques with rupture compared with plaques without rupture.
| Variable | Total | Rupture | p-value | |
|---|---|---|---|---|
| (n=80) | Yes (n=15) | No (n=65) | ||
| Age (years) | 62±10 | 63±9 | 62±11 | 0.57 |
| Men | 57 (72%) | 9 (60%) | 48 (74%) | 0.35 |
| White | 46 (58%) | 11 (73%) | 35 (54%) | 0.13 |
| Presenting symptoms | ||||
| Stable angina pectoris | 37 (47%) | 5 (34%) | 32 (49%) | |
| Unstable angina pectoris | 20 (25%) | 2 (13%) | 18 (28%) | 0.24 |
| Non ST-elevation myocardial infarction | 20 (24%) | 7 (46%) | 13 (20%) | 0.03 |
| ST-elevation myocardial infarction | 3 (4%) | 1 (7%) | 2 (3%) | 0.50 |
| Risk Factors | ||||
| Hypertension | 62/76 (82%) | 12 (80%) | 50/61 (82%) | 0.86 |
| Diabetes mellitus | 30/76 (40%) | 5/14 (36%) | 25/62 (40%) | 0.75 |
| Hyperlipidemia | 59/77 (77%) | 11 (73%) | 48/62 (77%) | 0.73 |
| End stage renal disease | 6/76 (8%) | 0 (0%) | 6/61 (10%) | 0.59 |
| Chronic renal failure (Cre>1.5) | 10/77 (13%) | 2 (13%) | 8/62 (13%) | 1.00 |
| Prior coronary artery disease | 40 (50%) | 8 (53%) | 32 (49%) | 0.14 |
| Previous revascularization | 30 (38%) | 5 (33%) | 25(39%) | 0.18 |
| Medications | ||||
| Ace inhibitor | 45 (56%) | 10 (67%) | 35 (54%) | 0.40 |
| Aspirin | 60 (75%) | 11 (73%) | 49 (75%) | 1.00 |
| Beta-blocker | 44 (55%) | 11 (73%) | 33 (51%) | 0.15 |
| Thienopyridine | 35 (44%) | 8 (53%) | 27 (42%) | 0.57 |
| Statin | 54 (68%) | 10 (67%) | 44 (68%) | 0.40 |
Stay updated, free articles. Join our Telegram channel

Full access? Get Clinical Tree


