Evaluation of Myocardial and Coronary Blood Flow and Metabolism


Evaluation of Myocardial and Coronary Blood Flow and Metabolism


Morton J. Kern

Michael J. Lim


Fundamental concepts of coronary physiology and myocardial blood flow, once the subject of research studies, are now used in daily clinical practice. The adoption of invasive coronary physiologic lesion assessment before percutaneous coronary intervention has become routine in many catheterization laboratories. Indeed, in the last decade, numerous studies have demonstrated favorable outcomes for revascularization decisions based on in-lab coronary physiologic evaluation in patients with a variety of difficult angiographic subsets. The rationale for the use of physiology in the cath lab is the necessity to overcome the limitation of angiography in reflecting the true ischemic potential of a coronary luminal narrowing. This chapter thus reviews the physiology of coronary blood flow, its regulation in response to cardiac metabolism, and the techniques most widely used to evaluate myocardial blood flow and metabolism. Catheter-based methods such as the intracoronary pressure and Doppler flow velocity guidewires, including clinical studies on the use of coronary physiology in the practice of PCI, are emphasized.


CONTROL OF MYOCARDIAL BLOOD FLOW: THE MYOCARDIAL OXYGEN SUPPLY AND DEMAND RELATIONSHIP

The control of myocardial blood flow is based on balancing the myocardial oxygen supply and demand relationship, which states that the heart requires a sufficient quantity (supply) of oxygen for any given oxygen need (demand), to prevent ischemia or infarction. The heart is an aerobic organ that relies almost exclusively on the real-time oxidation of substrates for energy generation, with little ability to accumulate
an oxygen debt as is seen with skeletal muscle. In a steady state, cardiac metabolic activity is thus accurately measured by myocardial oxygen demand (MVO2). The total metabolism of an arrested, quiescent heart is approximately 1.5 mL/minute per 100 gm, as required to support the physiologic processes not directly associated with contraction. In contrast, a beating canine heart has MVO2 ranging from 8 to 15 mL/minute per 100 gm.1, 2, 3

The heart metabolizes a variety of substrates such as glucose, free fatty acids, lactate, amino acids, and ketones. These substrates are critical for the generation of high-energy phosphates (ATP and creatine phosphate3,4) that supply the energy requirements of the myocardium. At rest, the rate of force development and the frequency of force generation per unit time accounts for approximately 60% of myocardial energy use; myocardial relaxation accounts for approximately 15% of energy use; electrical activity accounts for 3% to 5%; and basal cellular metabolism accounts for the remaining 20% of energy use5 (Table 24.1). As workload increases, myocardial contractile function consumes an even larger fraction of high-energy phosphate availability. Any compromise in substrate availability causes the myocardium to minimize energy expenditure on mechanical work and divert the remaining high-energy substrates for the continued maintenance of cellular integrity, thus setting the stage for myocardial “hibernation.”6,7

Under normal aerobic conditions, several substrates contribute simultaneously to meeting myocardial energy needs: free fatty acid (65%), glucose (15%), lactate and pyruvate (12%), and amino acids3,4 (5%), whereas glycolysis plays only a minor role. In fact, lactate is actually extracted by the myocardium, converted into pyruvate, and oxidized by way of the Krebs cycle. In the fasting state, when serum fatty acids are high, myocardial glucose uptake tends to be suppressed in favor of fatty acid utilization. But after an oral glucose load, or when a fall in myocardial blood flow or oxygen supply leads to a reduction or loss in mechanical function, glucose uptake is enhanced and fatty acid oxidation declines. Whereas glucose metabolism is preferentially aerobic, decreasing oxygen availability decreases high-energy phosphate and leads to the accumulation of ATP breakdown products (ADP, AMP, and other nucleosides). The myocardium then turns toward enhancing glycogenolysis and glycolysis to augment ATP production. In doing so, the pyruvate-lactate equilibrium is shifted toward lactate formation, causing net transmyo-cardial lactate production rather than extraction. Under extreme conditions, increasing cytosolic lactate and hydrogen ion concentrations lead to inhibition of residual glycolysis, deprive the cell of even anaerobic ATP production, and trigger a sequence of biochemical events that may lead to complete cessation of energy production with irreversible cellular injury.


Table 24.1 Myocardial Oxygen Consumption Components Total: 6-8 mL/min per 100 gm


Distribution


Basal


20%


Volume work


15%


Electrical


1%


Pressure work


64%


Effects on MVO2 of 50% increases in


Wall stress


25%


Heart rate


50%


Contractility


45%


Volume work


4%


Pressure work


50%


The table demonstrates the dominant contribution to myocardial oxygen consumption, MVO2, made by pressure work and prominent effects of increasing pressure work and heart rate on MVO2. (Reproduced with permission from Gould KL. Coronary Artery Stenosis. New York: Elsevier; 1991:8.)


The three major physiologic determinants of MVO2 are heart rate, myocardial contractility, and myocardial wall tension or stress2 (additional factors are shown in Table 24.2)

1. Heart rate is the most important determinant of MVO2. When heart rate doubles, myocardial oxygen uptake approximately doubles. Heart rate is a dominant factor in the O2 supply-demand ratio for two reasons: Increases in heart rate also increase oxygen consumption, and increases in heart rate reduce subendocardial coronary flow owing to shortening of the diastolic filling period. Subendocardial ischemia may thus occur
during tachycardia because of simultaneously increasing demand (tachycardia) and compromised flow for the subepicardium.3


Table 24.2 Determinants of MVO2


Heart rate


Contractile state


Tension development


Activation


Depolarization


Direct metabolic effect of catecholamines


Family history of coronary artery disease


Fatty acid uptake


Maintenance of active state


Maintenance of cell viability in basal state


Muscle shortening against a load (the Fenn effect)


2. Myocardial contractility is related to myocardial oxygen consumption by the degree of pressure work per heartbeat. The net effect of positive inotropic stimuli (e.g., Ca++ and catecholamines) on MVO2 is the result of wall tension (which declines with a reduction in heart size), and myocardial contractility (which is increased by inotropic stimuli). The decrease in MVO2 that might be expected to result from falling ventricular wall tension is opposed by the increase in contractility, which tends to augment MVO2. In the absence of heart failure, drugs that stimulate myocardial contractility elevate MVO2 because heart size and therefore wall tension are not reduced substantially and do not offset the effect of enhanced contractility.

3. Myocardial wall tension is proportionate to the aortic pressure, myocardial fibril length, and ventricular volume. Myocardial oxygen consumption doubles as mean aortic pressure increases from 75 to 175 mmHg, at constant heart rate and stroke volume. Comparing the relative effects of ventricular pressure, stroke volume, and heart rate on MVO2, researchers found that ventricular pressure development is a key determinant of MVO2. MVO2 per beat correlated well with the area under the LV pressure curve (time × pressure), termed the tension-time index, a more accurate determinant of MVO2 than is the developed pressure alone.3,5 Tachycardia elevates MVO2 by increasing the frequency of tension development per unit time, as well as by increasing contractility.

MVO2 is also influenced by the degree of myocardial shortening during stroke volume ejection, although less so than by tension development. The systolic pressure-rate product (also known as the double product) can be used as an estimate of MVO2 in a clinical setting, such as exercise or pacing tachycardia, recognizing its limited accuracy. MVO2 closely correlates with the LV systolic pressure-volume loop area, the external mechanical work, the end-systolic elastic potential energy in the ventricular wall, and the area enclosed by the systolic pressure-volume trajectory and the Emax line.


Determinants of Myocardial Oxygen Supply

Myocardial oxygen supply is provided by blood transiting the coronary and capillary circuit at an adequate perfusion pressure (mean arterial pressure) and with a satisfactory hemoglobin function and concentration to carry and deliver oxygen to the myocardial cells. A breakdown in any linkage of the supply side factors can result in an inadequate myocardial oxygen supply and myocardial ischemia.


MEASUREMENT OF MYOCARDIAL METABOLISM

Measurement of myocardial metabolism may be performed noninvasively (e.g., positron emission tomography scanning) or invasively by transmyocardial sampling techniques that involve acquisition of simultaneous arterial and coronary venous (e.g., coronary sinus) blood. Specialized blood products commonly used in the determination of changes in myocardial metabolism include serum pyruvate, lactate, oxygen, and other metabolic or hematologic blood components. Transmyocardial extraction of pharmaceutical agents after systemic or intracoronary delivery can also be determined by transmyocardial blood sampling for the measurement of arterial-venous concentration difference, along with measurement of blood flow per unit time.

In studies involving ischemic myocardial metabolism, the most commonly measured products are lactate and oxygen. Specialized chilled collection tubes containing an agent (perchloric acid) to stop red cell metabolism and prevent clotting are used for chemical assays to measure small differences in normal lactate levels across the myocardium. Clinical laboratory tests calibrated for the high lactate levels in lactic acidosis are unsuitable for the measurement of the small transmyocardial differences. Myocardial catecholamines (norepinephrine, epinephrine) and other vasoactive mediator products, such as prostaglandins, can be measured if sample tubes are placed immediately in ice to prevent platelet activation after blood withdrawal through a long narrow catheter lumen. Large-bore (≥6F) heparin-coated catheters may be required to assess platelet products. Measurement of myocardial metabolism requires preparation of the sampling tubes and other collection materials using advanced techniques.


Regulation of Coronary Blood Flow and Resistance

Coronary arterial resistance (R, pressure ÷ flow) is the summed up resistances of the epicardial coronary conduit (R1), and the precapillary arteriolar (R2) and intramyocar-dial capillary (R3) resistance circuits8 (Figure 24.1). Normal epicardial coronary arteries in humans typically taper from the base of the heart with diameters of typically 5 to 6 mm to the apex where the vessel diameter is typically down to 0.3 mm. The epicardial vessels do not offer appreciable resistance to blood flow (R1) in their normal state. Even at the highest level of blood flow, there is no detectable resistance as would be manifest as a pressure drop along the length of human epicardial arteries,9 making even large epicardial vessel resistance (R1) trivial until atherosclerotic obstructions develop. Most of the epicardial vessel wall consists of a muscular media that responds to changes in aortic pressure and modulates coronary tone in response to flow-mediated endothelium-dependent vasodilators, circulating vasoactive
substances, and neurohumoral stimuli. Large-conduit arteries are unaffected by myocardial metabolites because of their extramural location, but can produce episodic increases in resistance during severe focal or diffuse contraction (vasospasm) in the absence of atherosclerosis. One exception is myocardial bridging, in which intramyocardial vessel segments may offer increased resistance during systole owing to mechanical compression of the bridged segment during ventricular contraction.


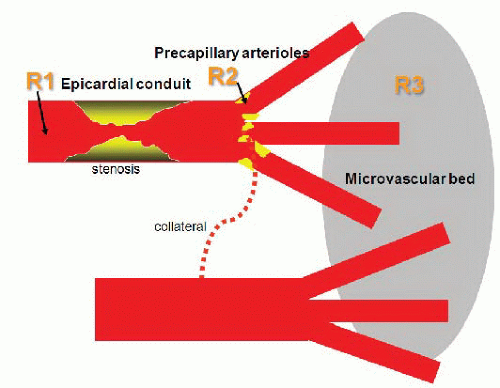
Figure 24.1 Diagram of coronary resistances. The epicardial arteries (R1) normally have negligible resistance until an atherosclerotic narrowing occurs (top artery). The precapillary arterioles (R2) regulate most of the coronary flow to the microvascular bed (R3). Diseased epicardial vessels are often connected to normal blood flow regions by collateral channels. (Modified from Dr. Bernard De Bruyne with permission.)

Changes in epicardial and arteriolar coronary resistances in response to physiologic or pharmacologic stimuli can be considered either primary or secondary vasomotor events. Primary vasodilation signifies an alteration in myocardial vessel tone and perfusion with no preceding change in myocardial oxygen demand. Secondary vasodilation refers to changes in vessel tone and blood flow that occur in response to alterations in myocardial oxygen consumption.10

Precapillary arterioles are resistive vessels (R2) connecting epicardial arteries to myocardial capillaries and are the principal controllers of coronary blood flow.8 Precapillary arterioles (100 to 500 µm in size) contribute approximately 25% to 35% of total coronary resistance. The prearteriolar resistance function autoregulates the driving pressure at the origin of the precapillary arterioles within a finite pressure range. This regulatory function is also influenced by myogenic and flow-dependent vasodilatation related to shear stress.

The microcirculatory resistance (R3) circuit consists of a dense network of about 4,000 capillaries per square millimeter, which ensures that each myocyte is adjacent to a capillary. Capillaries are not uniformly patent because precapillary sphincters regulate flow according to oxygen demand. Several conditions, such as LV hypertrophy, myocardial ischemia, or diabetes, can increase the microcirculatory resistance (R3) and blunt the normal maximal increases in coronary flow. Increased R3 resistance may also be associated with elevated resting blood flow above that expected for the existing myocardial oxygen demand, resulting in reduced coronary flow reserve (i.e., the hyperemic/basal flow ratio).

As in any vascular bed, blood flow to the myocardium depends on the coronary artery driving pressure and the resistance produced by the serial vascular components. Coronary vascular resistance, in turn, is regulated by several interrelated control mechanisms that include myocardial metabolism (metabolic control), endothelial (and other humoral) control, autoregulation, myogenic control, extravascular compressive forces, and neural control. These control mechanisms may be impaired in diseased states, thereby contributing to the development of myocardial ischemia (Tables 24.3 and 24.4).

Coronary vasodilatory reserve (CVR) is the ability of the coronary vascular bed to increase flow from a basal level to a maximal (or near maximal) hyperemic level in response to a mechanical or pharmacologic stimulus. Such
stimuli include the reactive hyperemia that follows transient coronary occlusion, exercise, and the administration of various pharmacologic agents. Coronary flow reserve is expressed as the ratio of maximal hyperemic flow to resting coronary flow—a ratio that averages from 4 to 7 in experimental animals and from 2 to 5 in man.11,12 In experimental animal studies, increasing conduit stenosis (R1) produces a predictable decline in coronary flow reserve, beginning at about a 60% artery diameter narrowing. At diameter stenoses of >80% to 90%, all available coronary reserve has been exhausted and resting flow begins to decline13, 14, 15 (Figure 24.2). (Factors responsible for reduced CVR in the absence of epicardial stenosis are listed in Table 24.5.) This relationship between increasing stenosis severity and reduced available flow reserve has been used in assessing the effective physiologic severity of any given coronary lesion and forms the basis of many noninvasive test modalities for ischemia. In clinical practice, however, for an individual patient, this relationship is unpredictable given the complex three-dimensional anatomy, imprecise correlation between angiographic estimate of diameter reduction owing to stenosis and true lumen cross-sectional area, and unknown status of microcirculation.


Table 24.3 Regulation of Coronary Circulation


Mechanism


Effector


Autoregulation


Intrinsic vasoconstrictor tone


Perfusion pressure


Aortic or poststenotic pressure


Metabolic activity


Exercise, ischemia


Myocardial compression and myogenic mechanisms


Systolic-diastolic interaction


Neural control


Sympathetic, parasympathetic, pain


Endothelium


EDRF, EDCF


Pharmacologic


Dipyridamole, adenosine, acetylcholine, α-, β-agonists and antagonists, and so on


EDRF, endothelial derived relaxing factor; EDCF, endothelial derived constricting factor. (Modified from Gould L. Coronary Artery Stenosis and Reversing Atherosclerosis, 2nd ed. New York: Arnold and Oxford University Press; 1998.)


Table 24.4 Mediators of Coronary Vasodilation


Stimulus


Epicardial Arteries


Arterioles


Acetylcholine


Nitric oxide


Endothelium


Flow shear


Endothelial


Nitric oxide


Exercise


Nitric oxide, neural


Metabolic, nitric oxide, neural


Pacing


Nitric oxide


Nitric oxide, metabolic


Ischemia or hypoxia


Metabolic, nitric oxide


Metabolic, nitric oxide


Perfusion pressure


Myogenic


Myogenic


Reactive hyperemia


Myogenic, flow shear


Myogenic, flow shear, metabolic, nitric oxide, prostacyclin


Dipyridamole, adenosine


No direct effect


Direct dilator, nitric oxide


Nitroglycerine


Direct dilator


No direct effect


BOLD indicates primary mechanism.


(From Gould L. Coronary Artery Stenosis and Reversing Atherosclerosis, 2nd ed. New York: Arnold and Oxford University Press; 1998.)


Furthermore, the influence of a stenosis on coronary blood flow is principally related to the morphologic features16 of the stenosis, with resistance to flow changing exponentially with lumen cross-sectional area (the most commonly used measure of severity) and linearly with lesion length (Figure 24.3). Additional factors contributing to stenosis resistance include the shape of the entrance and exit orifices, vessel stiffness, distensibility of the diseased segment (permitting active or passive vasomotion), and the variable lumen
obstruction that may be superimposed by platelet aggregation and thrombosis compromising lumen area, a process active in acute coronary syndromes (ACSs).16


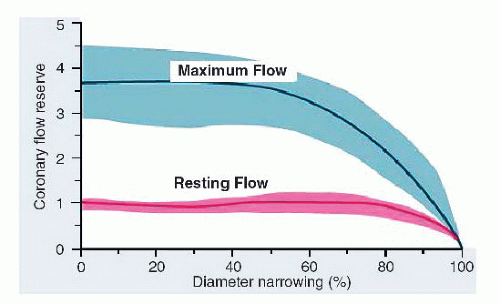
Figure 24.2 Coronary flow reserve expressed as ratio of maximum to resting flow plotted as a function of percent diameter narrowing. With progressive narrowing, resting flow does not change (dashed line), whereas maximum potential increase in flow and coronary flow reserve begin to be impaired at approximately 50% diameter narrowing. The shaded areas represent the limits of variability of data about the mean. (From Gould KL, Lipscomb K, Hamilton GW. Physiologic basis for assessing critical coronary stenosis: instantaneous flow response and regional distribution during coronary hyperemia as measures of coronary flow reserve. Am J Cardiol 1974;33:87-94.)


Table 24.5 Factors Responsible for Microvascular Disease and Reduction of Coronary Flow Reserve


Abnormal vascular reactivity


Abnormal myocardial metabolism


Abnormal sensitivity toward vasoactive substances


Coronary vasospasm


Myocardial infarction


Hypertrophy


Vasculitis syndromes


Hypertension


Diabetes


Recurrent ischemia


(From Baumgart D, et al. Current concepts of coronary flow reserve for clinical decision making during cardiac catheterization. Am Heart J 1998;136:136-149.)


As blood traverses a diseased arterial segment, turbulence, friction, and separation of laminar flow causes energy loss resulting in a pressure gradient (ΔP) across the stenosis. Using a simplified Bernoulli formula for fluid dynamics, pressure loss across a stenosis can be estimated from blood flow as follows:


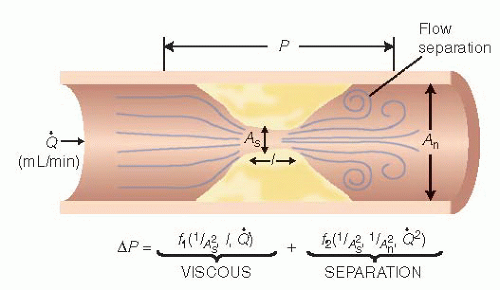
Figure 24.3 Diagrammatic illustration of the Bernoulli equation. ΔP, pressure gradient; As, area of the stenosis; An, area of the normal segment; L, stenosis length; Q, flow; f1, viscous friction factor (f); f2, separation coefficient (s). See text for details.


where ΔP is the pressure drop across a stenosis in millimeters of mercury (mmHg), Q is the flow across the stenosis in milliliters per second, and dsten is the minimal diameter of the stenosis lumen in millimeters. In Eq. (24.1), the first term (f) accounts for energy losses owing to viscous friction between the laminar layers of fluid and the second term (s) reflects energy loss when normal arterial flow is transformed first to high-velocity flow in the stenosis and then to the turbulent nonlaminar distal flow eddies at the exit from the stenosis (inertia and expansion).


Where As = stenotic segment cross-sectional area, p = blood density, µ = blood viscosity, L = stenosis length, and An = normal artery cross-sectional area.

It is important to note that the separation energy loss term (s) increases with the square of the flow while viscous energy loss (f) becomes negligible. Thus, increases in coronary blood flow increase the associated pressure gradient in an exponential manner. Despite augmentation of coronary blood flow, the increasing pressure loss across the stenotic segment reduces myocardial perfusion pressure and lowers the threshold for myocardial ischemia relative to demand.17

From Eq. (24.2), the trans-stenotic pressure drop is inversely proportional to the fourth power of the lumen radius. As a consequence, in a severe stenosis, relatively small change in luminal diameter (such as caused by active or passive vasomotion or transient obstruction by thrombus) can produce marked hemodynamic effects. For example, when the diameter stenosis increases from 80% to 90%, the resistance of a stenosis rises nearly threefold. For most stenoses, the length of the narrowing has only a modest effect on its physiologic significance. However, in very long narrowed segments, signi ficant turbulence occurs along the walls of the stenotic segment and energy is dissipated as heat when eddies form and impact on the vessel wall. In addition, a preserved arc of vascular smooth muscle in some diseased arteries may be compliant and subject to dynamic changes that can alter luminal caliber and stenosis resistance. Dynamic changes in stenosis severity and resistance can also occur passively in response to changes in intraluminal distending pressure or selective dilation of distal resistance vessels. Thus for a given stenosis, there is a family of pressure-flow relationships reflecting altered stenosis diameter and variable distending pressure (Figure 24.4).


MEASURING CORONARY AND MYOCARDIAL BLOOD FLOW IN THE CARDIAC CATH LAB

Catheter-based methods used in the evaluation of coronary flow include angiography, coronary venous (sinus) efflux measurements, and intracoronary sensor-wire pressure and flow velocity measurements.


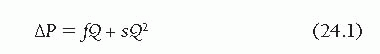
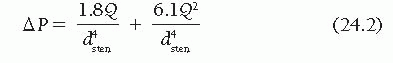
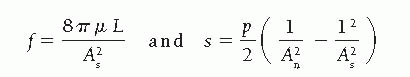
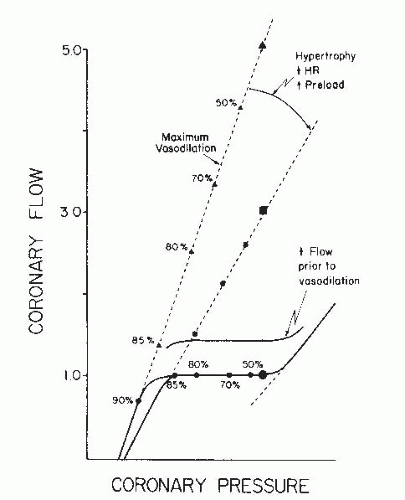
Figure 24.4 Resting and maximally vasodilated coronary pressure-flow relationships. Coronary flow reserve, the ratio of maximally vasodilated flow to resting flow, is a complex function of the actual position of the maximally vasodilated and resting flow curves. The slope of the maximal vasodilation curve can be shifted by hypertrophy and changes in hemodynamics as can the basal flow be altered by similar events, thus explaining different CFR (maximal vasodilation flow/basal flow ratio) under different conditions and in different patients. (With permission from Klocke FJ. Measurements of coronary flow reserve: defining pathophysiology versus making decisions about patient care. Circulation 1987;76:1183.)


Angiographic Blood Flow Estimation—Thrombolysis in Myocardial Infarction Flow and Thrombolysis in Myocardial Infarction Frame Count

Since its introduction by the Thrombolysis in Myocardial Infarction (TIMI) investigators in 1985,18 a simple, qualitative grading of angiographic coronary flow rates (Table 24.6) to assess the efficiency of reperfusion therapy has been widely used to gauge the restoration of perfusion in clinical trials. Improved TIMI flow grades are associated with improved outcomes.19, 20, 21


Table 24.6 Thrombolysis in Myocardial Infarction Flow Grade


Flow Grades


Description


TIMI 3


Normal distal runoff, contrast material flows briskly into and clears rapidly from the distal segment


TIMI 2


Good distal runoff, contrast material opacifies the distal segment, but flow is perceptibly slower than in more proximal segments and/or contrast material clears from the distal segment slower than from a comparable segment in another vessel


TIMI 1


Poor distal runoff, a portion of contrast material flows through the stenosed arterial segment, but the distal segment is not fully opacified


TIMI 0


Absence of distal runoff, no contrast material flows through the stenosis


TIMI, Thrombolysis in Myocardial Infarction


A quantitative method of TIMI flow counts the number of cine frames from the introduction of contrast in the coronary artery to a predetermined distal landmark. Cineangiography is performed with 6F catheters and filming at 30 frames per second. The TIMI frame count (TFC) for each major vessel is thus standardized according to specific distal landmarks. The first frame used for TIMI frame counting is that in which the contrast fully opacifies the artery origin and in which the contrast extends across the width of the artery, touching both borders with antegrade motion of the contrast. The last frame counted is that in which contrast enters the first distal landmark branch; full opacification of the distal branch segment is not required. The distal landmarks commonly used in analysis are the following: (i) for the left anterior descending (LAD) artery, the distal bifurcation of the left anterior descending artery; (ii) for the circumflex (CFX) system, the distal bifurcation of the branch segments with the longest total distance; (iii) for the right coronary artery (RCA), the first branch of the posterolateral artery22 (Figure 24.5).

The TFC can be further corrected (corrected TIMI frame count, or CTFC) by normalizing for the length of the LAD coronary artery in comparison with the two other major arteries; CTFC thus accounts for the distance the contrast has to travel in the LAD relative to the other arteries.22 The average LAD coronary artery is 14.7 cm long; the right, 9.8 cm; and the circumflex, 9.3 cm. CTFC divides the absolute frame count in the LAD by 1.7 to standardize the distance of contrast travel in all three arteries. Normal TFC and CTFC for LAD is 36 ± 3; for the CFX, TFC is 22 ± 4; and for the RCA, TFC is 20 ± 3; but CFX and RCA each has a CTFC of 21 ± 2. Table 24.7 provides reference values for CTFC. A high CTFC may be associated with microvascular dysfunction despite an open artery, whereas CTFCs of <20 frames are associated with normal microvascular function and a low risk for adverse events in patients following myocardial infarction (Table 24.7).


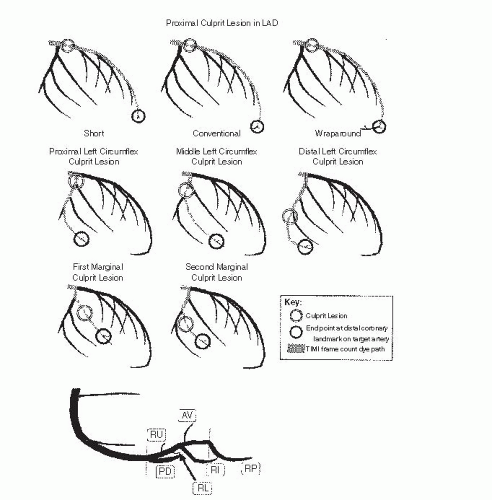
Figure 24.5 Top. Anatomic landmarks used for TIMI frame counting in the left anterior descending coronary artery. The distalmost branch in the left anterior descending coronary artery (referred to as the pitchfork, mustache, or whale’s tail) usually occurs at the apex of the heart. In a wraparound left anterior descending coronary artery, the branch closest to the apex of the heart is used. Second and third rows. Anatomic landmarks used for TIMI frame counting in the left circumflex coronary artery. The artery used for TIMI frame counting is the artery with the longest total distance along which dye travels in the left circumflex coronary artery system and yet passes through the culprit lesion. When the culprit lesion is proximal to two arteries with equal total dye-path distances, the artery that arises more distally from the left circumflex coronary artery is used. For example, when the culprit lesion is located in the proximal left circumflex coronary artery, the marginal branch with the longest total dye-path distance is used, regardless of whether it is the first, second, or third marginal branch. If these second and third marginals have equal total dye-path distances, the third marginal branch is the target artery. The target artery is always the first marginal branch when the culprit lesion is in the first marginal and, likewise, always the second marginal branch when the culprit lesion is in the second marginal. In left and balanced dominant systems, the target artery is no farther distal than the marginal branch that lies at the border of the inferior and lateral walls, usually the third or fourth marginal. The anatomic endpoint is the distalmost branch in the target artery. Usually, this endpoint branch can be found at approximately the midpoint of the distal third of the artery (five-sixths of the distance down the vessel from its origin), but occasionally is located just before the termination of the artery. Bottom. Anatomic landmarks used for TIMI frame counting in the RCA. The distal landmark is the first branch arising from the posterior lateral extension of the RCA after the origin of the posterior descending artery, regardless of the size of this branch. As shown, this branch will often be located just distal to the bifurcation and may be oriented either superiorly (RU) or inferiorly (RL). In some cases, this branch will lie farther along the extension of the distal RCA and either will course superiorly as the AV nodal artery (AV) or will be oriented inferiorly as the right inferior branch (RI). In the event that a very proximal posterior descending stenosis is the culprit lesion, the first branch off the posterior descending artery after the stenosis is the endpoint. Infrequently, the distal portion of the posterior descending artery is supplied by a proximally arising acute marginal branch, and the proximal portion of the posterior descending artery arises at the base of the heart. In these cases, it is the extension of the distal RCA past the posterior descending artery at the base of the heart, and not the proximal acute marginal branch, that is used for determining the TIMI frame count. In patients with left-dominant anatomy, the TIMI frame count endpoint is the distalmost branch of the RCA once it is no longer in the atrioventricular groove. (Adapted with permission from Gibson CM, Cannon CP, Daley WL, et al. TIMI frame count: a quantitative method of assessing coronary artery flow. Circulation 1996;93:879-888.)


Table 24.7 Reference Values for Thrombolysis in Myocardial Infarction Frame Counts


Average


RCA


LCx


CTFC (LAD)


LAD


Normal


21.0 ± 3.1


20.4 ± 3.0


22.2 ± 4.1


21.1 ± 1.5


36.2 ± 2.6


(16-31)


(16-26)


(16-31)


(18.8-24.1)


(32-41)


Nonculprit at 90 min


25.5 ± 9.8


24.6 ± 7.1


22.5 ± 8.3


30.6 ± 11.5


52.0 ± 19.6


(10-57)


(13-36)


(10-52)


(16.5-57.1)


(28-97)


Culprit at 90 min


39.2 ± 20.0


37.2 ± 19.3


33.7 ± 9.0


43.8 ± 22.6


74.5 ± 38.4


(13-164.7)


(13-112)


(19-51)


(17.1-164.7)


(29-280)


TIMI Frame Counts and Corrected TIMI Frame Counts (CTFC) in coronary arteries without epicardial stenoses (normal) and in nonculprit and culprit arteries 90 minutes after myocardial infarction.


RCA, right coronary artery; LCx, left circumflex coronary artery; LAD, left anterior descending coronary artery; TIMI, Thrombolysis in Myocardial Infarction.


Values are expressed as mean ± standard deviation and 95% confidence intervals. (Adapted with permission from Gibson CM, Cannon CP, Daley WL, et al. TIMI frame count: a quantitative method of assessing coronary artery flow. Circulation 1996;93:879-888.)


The TMC method has several limitations. Gibson et al.23 and Kern et al.24 suggested that visual estimates of TIMI flow in the usual clinical setting bear little relationship to the quantitative TMC or measured Doppler flow velocity and that even noninfarct-related coronary arteries may show prolonged frame counts as compared with normal values. Most likely, these prolonged TMCs are associated with microvascular dysfunction, even in the presence of an open artery.25 CTFCs >20 but <40 frames per second (the cutoff value for TIMI grade 3 flow) marked a higher risk for adverse outcome. 26 Prolonged CTFCs 4 weeks after myocardial infarction appear to be associated with impaired infarct-artery-related flow at 1 year.26

Injection technique can also have an impact on the CTFC. Using 7F diagnostic catheters, a mean increase of 1.0 mL/second on standard hand injections (10th to 90th percentile of left coronary injections: 1.5 to 2.5 mL/second; right coronary injections: 1.1 to 2.1 mL/second) induced a decrease of two frames in the CTFC.27

To measure absolute angiographic coronary flow velocity, a guidewire can be used to determine the intravascular distance between ostium and TIMI landmark.23 The guidewire tip is positioned distally and marked with one Kelly clamp. The wire is withdrawn to the coronary ostium and marked with a second clamp, and the distance between the clamps is measured. Velocity is then calculated using the following formula:


The angioplasty guidewire velocity takes into account specific artery length in a particular patient, but its usefulness in clinical practice remains to be evaluated. In general, TIMI frame counting is a simple, reproducible method for the assessment of angiographic coronary flow, which is widely applicable and provides additional information related to treatment success and clinical outcome.


Thrombolysis in Myocardial Infarction Blush Score

Angiographic successful reperfusion in acute myocardial infarction has been defined as TIMI 3 flow. However, TIMI 3 flow does not always result in effective myocardial reperfusion. Myocardial blush grade (MBG) is an angiographic measure of myocardial perfusion at the capillary level.28 MBG is defined as follows: 0 indicates no myocardial blush or contrast density; 1 indicates minimal myocardial blush or contrast density; 2 indicates moderate myocardial blush or contrast density, but less than that obtained during angiography of a contralateral or ipsilateral non-infarct-related coronary artery; and 3 indicates normal myocardial blush or contrast density, comparable with that obtained during angiography of a contralateral or ipsilateral non-infarct-related coronary artery.29 When myocardial blush is persistent (staining), it suggests leakage of contrast medium into the extravas-cular space and is also graded 0. To determine blush grading, the length of the angiographic run needs to be extended in order to visualize the venous phase of the contrast passage. When the left coronary artery is involved, use of the left lateral view is preferred, and for the right coronary artery, the right oblique view. MBG after primary angioplasty for acute myocardial infarction appears to be an important prognostic feature and should be added to the commonly used TIMI flow
grading to define successful angiographic reperfusion following primary angioplasty for acute myocardial infarction.29


Coronary Venous (Sinus) Efflux

The principal use of coronary venous measurements is determination of transmyocardial metabolism of blood products or drugs using the arterial-coronary sinus differences per unit flow. The measurement of coronary venous flow can be performed using the coronary sinus thermodilution technique. Coronary sinus blood flow (CSBF) is an approximation of blood flow to the left ventricle. Approximately two-thirds of LAD coronary artery flow drains into the great cardiac vein, the continuation of the anterior intraventricular vein as it reaches the atrioventricular groove. The great cardiac vein then becomes the coronary sinus at the point marked by the valve of Vieussens and the oblique vein of Marshall (a left atrial venous remnant of the embryonic left-sided superior vena cava). The remaining portion of LAD venous drainage enters the coronary sinus along with blood from the circumflex territory by way of the left marginal vein and circumflex venous branches. Great cardiac vein flow thus represents primarily LAD venous outflow, whereas coronary sinus flow represents a mixture of both LAD and left circumflex coronary artery outflow, accounting for 80% to 85% of total left coronary outflow drained by this route.30

The principle of thermodilution flow measurement states that the heat loss by the blood equals the heat gained by a cold indicator solution. Room-temperature fluid (5% dextrose or normal saline) is continuously infused by a control pump upstream in the coronary sinus. Coronary venous flow is then computed by the temperature reduction of blood/indicator mixture flowing over the proximal catheter thermistor. A full discussion of CSBF is available elsewhere.31, 32, 33 Regional myocardial oxygen consumption (MVO2) is computed as follows10:

MVO2 = Q × (AO2 − CSO2)

where Q equals coronary venous flow, AO2 is arterial oxygen content, and CSO2 is coronary sinus oxygen content.

Standard techniques for cannulation of the coronary sinus from either the superior or the inferior vena cava approach can be used. Reproducible coronary sinus flow measurements require a stable catheter position, avoiding variable inclusion of blood entering from venous tributaries adjacent to the temperature thermistor.


MEASUREMENTS OF INTRACORONARY PRESSURE AND FLOW VELOCITY USING SENSORTIPPED GUIDEWIRES

Measurements of intracoronary blood flow velocity or pressure can be used to describe the coronary physiologic responses to mechanical or pharmacologic interventions, determine the functional significance of a coronary stenosis, and assess the microcirculation and collateral flow. Directly measured physiologic data provide critical information, complementary to the anatomic findings and highly useful for clinical decision-making.34


Technique of Angioplasty Sensor-Guidewire Use

After diagnostic angiography or during angioplasty, the sensor angioplasty guidewire is passed through a standard Y connector attached to either the diagnostic or the guiding catheter (5F or 6F catheters are suitable). Standard anticoagulation is given as in the case of angioplasty (e.g., 60 units of unfractionated heparin per Kg) before introducing the guidewire. Intracoronary (IC) nitroglycerin (100 to 200 µg) given before guidewire introduction vasodilates and fixes the epicardial vessel diameter for 10 to 15 minutes. Nitroglycerine has no effect on fractional flow reserve (FFR) unless the stenosis is vasotonically constricted, and thus is useful to reduce guidewire-induced vasospasm but not mandatory for an accurate FFR measurement.35

For flow velocity, the Doppler sensor, located at the very distal guidewire tip (Figure 24.6), is advanced at least 5 to 10 artery-diameter lengths (>2 cm) beyond the stenosis to measure laminar flow (otherwise the turbulent flow close to the stenosis may underestimate true velocity). Resting flow velocity is recorded, and then coronary hyperemia is induced by IC or IV adenosine (or other suitable agents) with continuous recording of the flow velocity signals. CVR is computed as the ratio of maximal hyperemic to basal average peak velocity (APV; Figure 24.7). Because of the highly position-dependent signal, poor signal acquisition may occur in 10% to 15% of patients even within normal arteries. As with transthoracic echo Doppler studies, the operator must adjust the guidewire position (sample volume) to optimize the velocity signal.

To measure translesional pressure gradients for the calculation of the pressure-derived FFR,34 the pressure wire sensor, located 3 cm proximal to the wire tip, is first zeroed to atmospheric pressure on the table, along with the guide catheter pressure, and then advanced through the guide catheter to the coronary ostium. The sensor pressure is matched to the guide catheter pressure (by electronically equalizing or normalizing the two pressures). The guidewire is then advanced into the artery with the sensor beyond the stenosis. The distance beyond the stenosis should be 2 to 3 cm distal to the lesion. Baseline pressure is recorded, followed immediately by induction of coronary hyperemia, continuously recording both guide catheter and sensor-wire pressures. FFR is computed as the ratio of distal coronary to aortic pressure at maximal hyperemia occurring at the lowest distal coronary pressure (Figure 24.8). If a small (<5F) guide catheter is being used, flushing the catheter liberally with saline will reduce pressure wave damping. Signal drift can be detected by observation of the pressure waveform.35

The safety of intracoronary sensor-wire measurements is excellent, with benign problems related mostly to adenosine.
Severe transient bradycardia after IC adenosine occurs in <2.0% of patients, coronary spasm during passage of the Doppler guide wire in 1%, and ventricular fibrillation during the procedure in 0.2% of patients.36


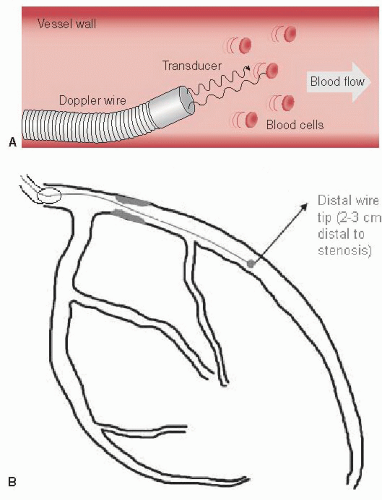
Figure 24.6 A. Schematic depiction of a Doppler flow wire emitting ultrasound signals along the direction of the vessel with return of the signals after interacting with flowing red blood cells to produce a Doppler-derived blood flow velocity in a coronary artery. B. Depiction of a coronary tree with a stenosis and Doppler flow wire advanced through the guiding catheter, across the stenosis and with the tip distal to the stenosis. In this way, coronary flow reserve (CFR) can be determined to evaluate the significance of the stenosis. The same setup can be used to measure fractional flow reserve (FFR) if a pressure wire is used instead of a Doppler flow wire.

Only gold members can continue reading. Log In or Register to continue

Stay updated, free articles. Join our Telegram channel

Jun 26, 2016 | Posted by in CARDIOLOGY | Comments Off on Evaluation of Myocardial and Coronary Blood Flow and Metabolism

Full access? Get Clinical Tree

Get Clinical Tree app for offline access