Introduction
Knowledge regarding the major risk factors for cardiovascular disease (CVD), which include elevated blood pressure, elevated cholesterol, cigarette smoking, and diabetes, have been derived from epidemiologic studies conducted primarily in white populations.1 Globally, non-white populations constitute the majority of the world’s population. Ethnicity-related CVD research compares and contrasts levels of known risk factors and new risk factors, effects of risk factors, efficacy of treatments and preventive strategies and healthcare utilization patterns to explore the reasons for differences in CVD rates among ethnic populations.2 Such research can lead to specifically tailored CVD preventive strategies for different populations and therefore are of major public health importance.
Defining ethnic groups
The concept of race was based on the belief that members of a race were homogeneous with respect to biologic inheritance.3 However, over the past 20 years, as our ability to unravel the genetic code has increased, little evidenc has arisen to support the contention that the historical “racial” divisions represent differences in genetic make-up.3,4
Ethnicity, on the other hand, is a term used to describe a group of people whose lifestyles are characterized by distinctive social and cultural traditions which are maintained within the group and passed on from generation to generation. Therefore ethnicity has both sociocultural and biologic components.5 Given that variations in disease rates between populations may be explained by socio-economic, sociocultural, biologic, and genetic factors, classification by ethnic origin rather than race is desirable.6
Interpretation of studies in ethnic populations
The methodologic limitations of studies of ethnic populations must be recognized.7 Mortality statistics often provide the first clues of differences in CVD rates between ethnic groups. Most developed countries have methods of collecting reliable mortality statistics.8 However, in developing countries, these systems are less well organized and information on some selected populations may only be available from sample registration systems, community surveys and hospital admissions.
Worldwide patterns of disease
In 2001, 59% of the total global mortality was attributable to non-communicable diseases (NCD) such as CVD, cancer, and diabetes; this was 10% higher than estimates in 1990, and projected to rise to 69% by 2030.9,10 Approximately 80% of global NCD mortality occurs in developing countries. In 2005 NCD accounted for about 61% of deaths, 50% of disease burden and 46% of premature death (deaths in people less than 70 years) in low-and middle-income countries (LMIC).11 Coronary heart disease (CHD) and stroke are now the leading causes of deaths in LMIC. More than half of all cardiovascular deaths in LMIC occur among people aged 30 to 69 years, compared to about one-quarter in high-income countries (HIC).12
In most HIC, CVD rates are declining due to preventive strategies that target the most potent cardiovascular risk factors (CVRF). For example, tobacco use has declined in many HIC because of legislation and policy,13 and the proportion of high-risk patients receiving evidence-based secondary prevention therapies has increased.14 However, in LMIC increasing life expectancy associated with a decline in childhood and adult deaths from infections and coupled with lifestyle changes secondary to rapid industrialization and urbanization have lead to increasing CVRF and CVD.
Differences in CVD mortality rates across countries are influenced by differences in the physical, social, political and cultural environment.15 Ethnic variations in disease rates are closely tied to geographic patterns of disease. These geographic differences have provided many of the initial hypotheses of the association between lifestyle factors, which are strongly influenced by culture and ethnicity, and CVD. One of the first epidemiologic studies to highlight the variation in CHD rates between countries was the Seven Countries Study.16 This study of 16 cohorts of men aged 49–59 years found substantial differences in CHD mortality between countries, for example very low rates in Japan and the Mediterranean countries and very high rates in Finland and the USA. Similarly, the WHO MONICA study in 26 countries17 documented a more than 14-fold difference in CHD mortality among men and more than 11-fold differences in CHD mortality for women between countries. More recent data indicate that there is still wide variation across both space and time18 (Table 19.1). The enduring differences in CHD rates across world regions have raised questions as to whether they are due to biologic factors, sociocultural factors, differences in environment or other risk factors.
Table 19.1 Trends in age-standardized (world population) death certification rates per 100 000 for coronary heart disease in all age groups in selected areas of the world 1965–199818
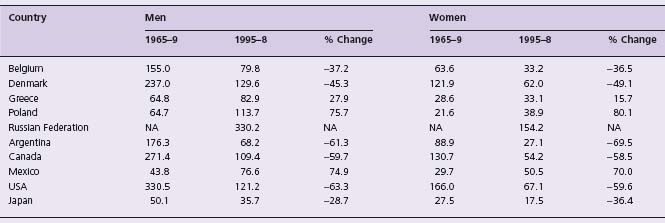
NA, not available.
Migrant groups
Observational studies have found that when members of a given ethnic group migrate to a new environment they often adopt new behaviors and risk factors and lose behaviors common to their native land. This suggests that environmental influences are very powerful factors in CVD causation. Conversely, despite different environments, similarities in disease rates within an ethnic group suggest an inherent propensity towards or protection from CVD that could be related to genetics. Comparing the mortality rates of long-settled migrants to the disease rates in their country of origin helps to establish the relative contribution of genetic and environmental influences to differences in mortality rates. The Ni-Ho-San Study of Japanese migrants to Hawaii and San Francisco revealed that changes in disease rates in this population likely reflected changing environmental influences.19 The age-adjusted CHD mortality rate rose as the Japanese moved from Japan to Hawaii and California. More than half of the increase in CHD was attributable to different levels of conventional risk factors, as the US cohort had a higher fat diet and higher mean serum cholesterol compared to the Hawaii or Japan cohorts.19 This suggests that the low rates of CHD mortality in Japan may be retained in Japanese migrants if they kept their risk factors at similar levels to those in Japan, which likely would require maintenance of their traditional lifestyle.
A major contribution to our understanding of ethnic variation in risk factors for CHD is the findings of the INTER-HEART study. INTERHEART was a large case–control study involving about 14 000 cases of first myocardial infarction (MI) and 14 000 matched controls from 52 countries. It was designed to study the importance of conventional and emerging risk factors in different geographic regions and ethnic groups.20 The principal findings of this study were that nine modifiable risk factors, including abnormal lipids, smoking, hypertension, diabetes, abdominal obesity, psychosocial factors, consumption of fruits and vegetables, alcohol intake and regular physical activity, account for more than 90% of the risk of MI worldwide, in both sexes, and at all ages, in all regions, and in all major ethnic groups. This study challenged the conventional belief that different ethnic groups had different CVRF and provided evidence that while the frequency of risk factors varied by ethnic group, the strength of association with MI was similar. Thus the differences in CVD rates across different regions and/or ethnic groups are attributable to the difference in distribution of established CVRF (Table 19.2).
Table 19.2 Population attributable risk associated with nine risk factors in males and females. Source: reference 20
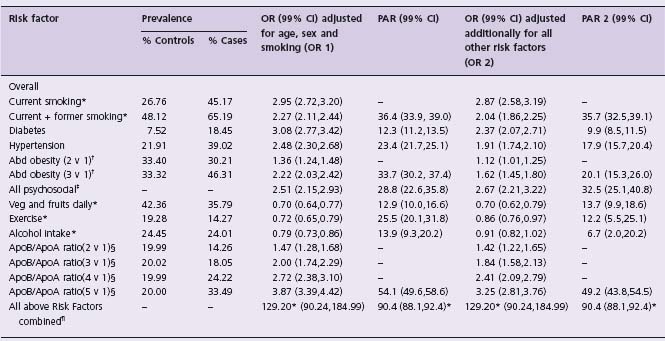
* The median waist /hip ratio was 0.93 in cases and 0.91 in controls (P < 0.0001), and the median ApoB/ApoA1 ratio was 0.85 in cases and 0.80 in controls (P < 0.0001). Percentage of controls with four or five factors positive is 2.2% compared with 29.2% in cases.
* PARs for smoking, abdominal obesity, and ApoB/ApoA1 ratio are based on a comparison of all smokers vs never, top two tertiles vs lowest tertile, and top four quintiles vs lowest quintile. For protective factors (diet, exercise, and alcohol), PARs are provided for the group without these factors.
† Top two tertiles vs lowest tertile.
‡ A model-dependent index combining positive exposure to depression, perceived stress at home or work (general stress), low locus of control, and major life events, all referenced against non-exposure for all five factors.
§ Second, third, fourth, or fifth quintiles vs lowest quintile.
¶ The model is saturated, so adjusted and unadjusted estimates are identical for all risk factors. The odds ratio of 129.20 is derived from combining all risk factors together, including current and former smoking vs never smoking, top two tertiles vs lowest tertile of abdominal obesity, and top four quintiles vs lowest quintile of ApoB/ApoA1. If, however, the model includes only current smoking vs never smoking, the top vs lowest tertile for abdominal obesity, and the top vs lowest quintile for ApoB/ApoA1, the odds ratio for the combined risk factors increases to 333.7 (99% CI 230.2–483.9).
The following sections review the CVD profile of seven major ethnic groups. Based on the best available data, we document their disease burden and changes in disease rates over time, and review common/influential CVD risk factors. We then discuss ethnic group-specific preventive strategies that need to be further developed or reinforced.
European origin (including North Americans)
People of European origin include those who originate from Northern Europe such as the Nordic countries and Germany, Western Europe including the United Kingdom and France, Southern Europe including Spain and Italy, and Eastern Europe (which includes the Slavic countries).
Disease burden
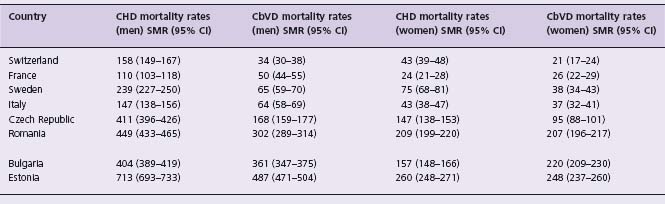
Differences in the age-standardized mortality rates (ASMR) vary widely between European populations, with the highest rates observed in Eastern Europe (e.g. Bulgaria, the Russian Federation) and the lowest in France and Switzerland (Table 19.3). In a recent update on regional variation in mortality rates across Europe, the rate ratio of dying from CHD between the countries with the highest mortality compared with the lowest mortality is 7.1 (95% confidence interval (CI) 6.6–7.6) for men (Latvia v France) and 9.9 (95% CI 8.5–11.5) for women (Estonia v France). There is still a clear north-east to south-west gradient in mortality from CHD.21 For cerebrovascular disease (CbVD), the rate ratio is 14.5 (95% CI 12.7–16.4) for men (Estonia v Switzerland) and 12.0 (95% CI 10.2–14.1) for women (Estonia v Switzerland). With regard to CbVD, there appears to be a “green” circle of reduced mortality in the centre of Western Europe (France, northern Italy and Spain). Although in all countries the CVD mortality rates are much lower among women, substantial between-country differences persist. Over the past 30 years most European countries, the United States and Canada have experienced substantial declines in the CVD mortality rates.22 However, the Eastern European countries, including Ukraine, the Russian Federation, Hungary, and the Czech Republic, continue to have among the highest rates of CHD and CbVD in the world, with a few showing a decline (Poland) and several showing an increase (Ukraine).23,24
Table 19.3 Age-standardized CVD mortality rates (45–74 years) in selected European countries, 200021
Common risk factors
Throughout European populations the high rates of CVD are mainly attributable to high rates of a combination of risk factors including elevated serum cholesterol, elevated blood pressure, diabetes, diets high in saturated fat and smoking. More recently, high rates of overweight and obesity are likely to perpetuate the high rates of associated risk factors and disease. The epidemic of CVD in the Eastern European countries is in part related to high levels of smoking, diets high in animal fats, along with excessive alcohol consumption and social disparity.25,26 Research to explain why the Italian and French populations remain relatively “protected” from CHD has yielded numerous hypotheses. It is likely that dietary differences may explain the disparity. For example, the high consumption of olive oil and antioxidants may explain low CHD rates in Italy. In France, however, despite similar saturated fat consumption and levels of serum cholesterol, blood pressure and smoking, the CHD mortality rate remains low.27 This immunity to CHD has been attributed to high consumption of wine which may offer cardioprotection by increasing HDL cholesterol levels, or by inhibiting postprandial hyperlipidemia and platelet aggregation.28 Others believe the lower rate of CHD mortality may simply be due to a time lag as increases in consumption of animal fat and elevations in serum cholesterol have only occurred recently in France.29
Influential factors
CHD, like other epidemics, relates closely to social conditions and its prevalence appears to be more strongly related to the social and cultural conditions of a society than its genetic make-up. This is evidenced by the rapid decline in the rates of CHD in parallel to economic changes in the United States and Japan, and the increase in CHD rates in the Eastern European countries. These changes have occurred too quickly for changes in gene frequencies to have occurred.26 Therefore, rather than explaining differences in CHD rates between populations largely on genetic differences, rapid changes in CHD rates can occur and are usually explained by changes in diet (including alcohol consumption) and smoking that are influenced by economics.
Special approaches to prevention
It is clear that major lifestyle changes, and vigilant treatment of risk factors, result in declines in CVD rates. In Finland, an impressive 60% reduction in CHD and stroke mortality was observed between 1972 to 1994, and it is estimated that approximately 75% of this decline can be explained by a substantial lowering of serum cholesterol by 13% (0.88 mmol/L) in men and 18% (1.19 mmol/L) in women, a lowering of diastolic blood pressure by 9% (6.6 mmHg) in men and 13% (12.2 mmHg) in women, and a significant reduction in smoking rates (30% in men) which have occurred as a result of individual and population-targeted interventions.30
In the USA, a 34% decline in CHD mortality occurred between 1980 and 1990. One-quarter of this decline is attributed to primary prevention efforts, such as decline in smoking due to effective policies,13 and 29% is explained by secondary prevention efforts, such as treatments to lower cholesterol and blood pressure. Furthermore, 43% of this decline is attributed to improved medical and surgical management in patients with established CHD.31 However, it is important to note that despite the general success in reducing CVRF in the US population, not all segments of society are benefiting equally and improvements may have slowed. Smoking and diabetes rates are particularly high among people with a lower socio-economic status. To further reduce CVD in the US, programs need to be targeted at these high-risk groups.
Population health interventions to reduce CVRF levels seem to be very effective in achieving long-term CVD prevention. In Finland the decline in CVRF and CVD was associated with the launch of the national demonstration project in North Karelia in the 1970s and with subsequent major national activities thereafter.30 More recently in Poland, during the 1990s, a rapid decrease (about 25%) in CHD deaths in early middle age was observed. This sudden decline is attributed to rapid political and economic changes in Poland (and surrounding countries) that made fruit and vegetables more accessible and affordable and oppositely impacted foods of animal origin, which led to improved diets.32 By contrast, a marked increase in death rates from CVD, accidents, violence, and infectious diseases has been observed in Russia over a relatively short time period, and is thought to be due to socio-economic upheaval.33 Such examples substantiate the claim that societal factors contribute greatly to CVD burden.
Japanese
Disease burden
Mortality rates from CVD are much lower in Japan than Western countries.23 Initial data from the Seven Countries study confirmed that the Japanese experience lower rates of CVD compared to Western populations.16 The pattern of CVD in Japan also differs from Western populations, as they tend to experience relatively higher proportions of stroke (ASMR: M 79, F 41/100 000) and less CHD (ASMR: M 57, F 21/100 000).
Temporal trends
In parallel with a rise in economic prosperity, the CHD rates in Japan have declined like other OECD (Organization for Economic Co-operation and Development) countries. For CHD the ASMR decreased from 47/100 000 in 1995 to 42/100 000 in 1997 among males, and from 25 to 21/100 000 during the same time period among females.23 Given the low rate of CHD in Japan, the life expectancy in Japan is among the highest in the world.34 The mortality from stroke in Japan has also declined substantially since 1950.26 Between 1995 and 1997, ASMR decreased for both men from 82/100 000 in 1995 to 79/100 000, and in women from 54/100 000 to 41/100 000 during the same time period. Low cholesterol levels and declining levels of blood pressure (due to reduction in salt intake and increased use of blood pressure-lowering treatments) and smoking (82.3% among men in 1965 to 45.5% in 2005) in a socially stable environment are probably responsible for the declines in CHD and stroke in Japan.26,34,35
Common risk factors
A review of CVRF in the Japanese population suggest that high blood pressure is a major determinant of CVD (particularly high rates of stroke), more so than cholesterol and cigarette smoking.34 Low serum cholesterol related to a diet low in saturated fats is probably also an important contributing factor. Despite the fact that two-thirds of Japanese men smoke, CHD rates have remained unexpectedly low. Smoking rates and rates of hypertension are declining (prevalence of severe hypertension in men 60–69 years fell from 21% in 1965 to 4% in 1990), but the prevalence of type 2 (non-insulin dependent) diabetes in Japanese males and females is higher than rates in most Western countries. The National Nutrition Survey of 2000 reported that 22.6% (20.7–24.5) of men and 22.3% (20.7–23.9) of women aged 20 years and over had diabetes according to WHO 1999 criteria.36 The same survey reported the prevalence of overweight (Body Mass Index (BMI) 25–29.9kg/m2) to be 24.5% in men and the rates of obesity (30 kg/m2) as 2.3%. The corresponding rates in females were 17.8% and 3.4% respectively. Rates of obesity have increased in men over the last three decades but have been stable or decreased in women. In the last decade average BMI has increased in men by 0.45 kg/m2 (0.42–0.47), but decreased in women by 0.08 (0.6–0.11) kg/m2.37 Therefore, obesity and type 2 diabetes appear to be emerging and may influence trends in CVD in the future for Japan.
Influential factors
Over the past 30 years blood pressure levels have declined in Japan due to primary prevention efforts.38 However, “Westernization” of Japanese diets during this period likely explains the two-to threefold increase in glucose intolerance and type 2 diabetes, as well as obesity and more recently hypercholesterolemia.34,39 Studies have documented that the average serum cholesterol concentration among Japanese has increased from 1980 to 1989, from age-adjusted total serum cholesterol levels of 4.84 to 5.22 mmol/L in men and from 4.91 to 5.24 mmol/L in women. These concerning trends combined with the substantial use of tobacco among Japanese males (59%) suggest that Japan may soon experience a rise in CVD.34 Studies of Japanese migrant groups show they are susceptible to changing environments. Brazil-born Japanese had a higher proportion of fat in their diet (similar to the general Brazilian population) compared to Japan-born participants (first-generation migrants) and compared to data from Japan,40 and this was associated with more adverse lipid profiles41 and a higher prevalence of diabetes (also higher than the general Brazilian population).42 Similar patterns have been observed in Japanese migrants to Hawaii and California.19,43,44
Special approaches to prevention/treatment
With increasing adoption of Western lifestyles in Japan,38 the pattern of CVRF may become more and more like that of Western countries. A number of studies have shown the protective benefit of the traditional Japanese diet, particularly the Okinawan diet. People in Okinawa (South Island of Japan) enjoy the longest average life expectancy in Japan. Okinawans have less salt in their diet, low animal fat and marked soy bean and fish consumption.45 Therefore, maintenance of traditional Japanese low-fat diets, high in soy, seaweed and green vegetables,45 and control of cigarette smoking may be what Japan needs to focus on to prevent CVD.
Chinese
Disease burden
Although the overall mortality from CVD is less in China than in Western countries, CVD is the most common cause of death in China and Taiwan. When compared to Western populations, Chinese, like Japanese, experience higher stroke rates and lower rates of CHD. In urban China in 1999, the ASMR for CHD in men aged 35–74 was 106/100 000 and for women 71/100 000,23 fivefold lower than the highest rates documented in the MONICA project from Europe.23 In contrast, the ASMR for stroke in this period and age group was 217/100 000 in men and 147/100 000 in women.23 CHD incidence in China is also relatively low (highest incidence reported in Sino-Monica 1987–1989 was 109/100000 in men 35–64 years) whereas stroke incidence is high (highest incidence of stroke from the same study 553/100 000 for men 35–64 years). Hemorrhagic strokes are about two to three times more common in China compared to the West.46 Only 6–12% of strokes in whites are reported as hemorrhagic compared to 25–30% of strokes among Chinese.24
Temporal trends
In parallel with increasing average life expectancy to 71.4 years in 2000 compared with 68.6 years a decade earlier,47 death rates from CVD (particularly CHD) are increasing in China.48 The proportion of all deaths due to CVD in China increased from 86/100 000 (12.8% of total death) in 1957 to 214/100 000 (35.8%) in 1990.49 A recent study of a large representative cohort from China of 169 871 men and women 40 years and over found that CHD accounted for 22.5% and stroke for 21.3% of all deaths.50 Although Japan has reported a decline in stroke mortality, the decline in stroke deaths in China has not been as striking. The relatively stable incident stroke levels may be due to the balance of falling rates of hemorrhagic stroke with rising rates of ischemic stroke and there is some evidence for this from Beijing and Shanghai where hemorrhagic stroke rates have fallen by 12.0% and 4.4% but ischemic stroke rates have increased by 5.0% and 7.7% respectively.51
Common risk factors
Data from the Sino-MONICA project (a 7-year study monitoring trends and determinants of CVD in geographically defined populations in different parts of China) indicate that mean blood pressure levels are high by international standards but total cholesterol and BMI are low.52
The rise in CVD in China is likely attributable to adverse changes in health behaviors such as falling levels of physical activity and dietary change associated with rapid urbanization. Risk factor levels are lower in rural compared to urban areas (Table 19.4). Amongst a representative sample of 15 540 Chinese adults, aged 35–74 years from the International Collaborative Study of Cardiovascular Disease in Asia, 78.1% and 21.8% of rural and urban residents, respectively, were physically active. Cigarette smoking is highly prevalent among Chinese males. Over 60% of men smoke and some evidence suggests rates are increasing.53 Smoking rates among women are much lower, but about a third of smoking-related deaths in women are due to passive smoking.54 While underweight is still a problem among some Chinese, the prevalence of overweight is increasing, particularly in urban areas.55
Table 19.4 Cardiovascular risk factors levels in China from the INTERASIA China Study 2001
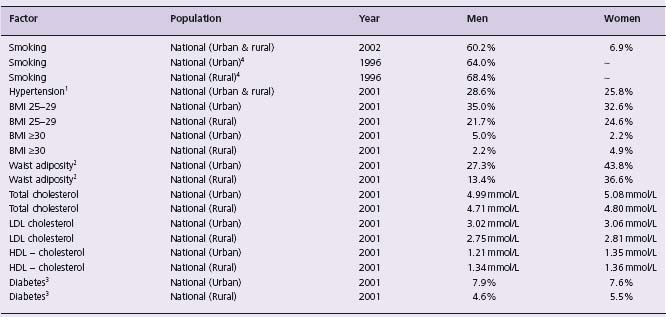
1. SBP ≥ 140 and/or DBP ≥ 90 and/or on antihypertensive medication.
2. Waist adiposity for men waist > 90 cm and women waist > 80 cm.
3. Self-report diabetes or fasting plasma glucose ≥ 7.0 mmol/L. From references 52, 61–65..
The strength of association of established CVRF (e.g. cholesterol, blood pressure, smoking, BMI) and CHD/stroke has been shown to be similar for populations from Chinese and Western populations in the APCSC (Asia Pacific Cohort Studies Collaboration).56 The INTERHEART study included 3030 cases of first MI and 3056 controls from China and Hong Kong and indicates that the same risk factors that are responsible for CHD in other world regions explain the majority of CHD in China, as the nine INTERHEART risk factors explained 88.8% of the PAR for China and Hong Kong.20 Thus in a study that modeled the impact of changes in risk factors and medical/surgical treatments on CHD mortality in Beijing between 1984 and 1999, most of the increase (∼ 77% or 1397 additional deaths) was attributable to substantial rises in total cholesterol levels (more than 1 mmol/L), plus increases in diabetes and obesity.57 Blood pressure decreased slightly, whereas smoking prevalence increased in men but decreased substantially in women. Changing levels of treatments seemed to have less impact; in 1999, medical and surgical treatments together prevented or postponed ∼ 642 deaths, mainly from initial treatments for acute myocardial infarction (41%), hypertension (24%), angina (15%), secondary prevention (11%), and heart failure (10%).
Influential factors
Absolute rates of CVD are still lower in China and Chinese migrant populations. However, the burden of CVD is unlikely to have been fully realized in China. Smoking-related mortality and morbidity are climbing. A large national study in 1990 found that smoking was already causing about 12% of Chinese male mortality in middle age and predicted that this proportion would rise to about 33% by 2030.58 China has the largest production and consumption of tobacco worldwide. It has witnessed a dramatic increase in tobacco consumption over the past two decades, with more than 34.8 million cartons of cigarettes being produced and 34.7 million sold annually. The continuous, rapid increase in the number of Chinese smokers is largely due to teenagers taking up smoking. The average daily consumption of tobacco per person in China rose from one cigarette in 1952 to 10 cigarettes in 1990.59 Passive smoking as well as the effects of both indoor and outdoor air pollution are also likely to be important influencing factors for CVD in China in the future.54 These together with the continuing high rates of hypertension and early evidence of effects of urbanization on health behaviors and subsequent falling levels of physical activity and increasing obesity and diabetes are concerning signs of what may come. In one urban cohort from China, acquisition of a motorized vehicle was associated with 80% higher odds of becoming obese.60 Higher rates of CHD in Chinese populations with prolonged exposure to urban lifestyles such as in Singapore indicate that Chinese are not immune to the effects of CHD.
Migrant patterns
Data from Chinese migrants to Singapore and Mauritius provide evidence that exposure to urban environments leads to adverse risk factor profiles.66,67 A comparison of rural Chinese in China to urban Chinese subjects living in Hong Kong and Australia found that despite a slightly better risk factor profile among the urban Chinese (based on HDL cholesterol and lower blood pressure), carotid intima media thickness (a measure associated with cardiovascular risk) was lower among the rural subjects (0.50 + 1.0 mmHg) than among urban subjects (0.56 + 0.12 mmHg).68 Together with urbanization, increased levels of metabolic risk factors and CHD in Chinese populations outside China may be due to cultural dietary differences such as the higher consumption of coconut and palm oil, mainly containing saturated fat, in Singapore.69 Diabetes rates and mean serum cholesterol were also higher in Mauritius Chinese (5.5 mmol/L) than in Beijing Chinese (4.4 mmol/L), whereas the prevalence of hypertension and smoking was greater in Beijing.66 Therefore, although the prevalence of hypertension and smoking may decline for these migrant populations, the rates of obesity, late-onset diabetes, elevated serum cholesterol, and CHD increase. However, Chinese migrants to the United States and Canada have lower rates of CHD relative to other migrant groups, and have low or similar rates of stroke, indicating they may still retain some level of protection from CVD compared to other populations.44
Approaches to prevention
Economic modernization in China is resulting in increased rates of CVRF common among Western populations becoming apparent in urban populations of China. This offers a major challenge for future prevention efforts in China as increasing populations are exposed to rapid urbanization. Important prevention strategies for the Chinese will include smoking cessation/prevention, maintenance of traditional Chinese lifestyles including diet (high in leafy green vegetables and fish, low in saturated fat) and regular physical activity to prevent continuing adverse changes in BMI, diabetes, serum cholesterol and blood pressure.
South Asians
South Asians include people who originate from India, Sri Lanka, Bangladesh, and Pakistan.
Disease burden
There are relatively few mortality studies from India as there is no uniform completion of death certificates and no centralized death registry for CVD.70 However, the WHO and the World Bank data indicate that mortality attributable to CVD has increased in parallel with the expanding population in India, and now accounts for a large proportion of disability-adjusted life years (DALY). Of all deaths in 1990, approximately 25% were attributable to CVD, which is greater than the 10% due to diarrheal diseases, the 13% due to respiratory infections, and the 8% due to tuberculosis.71 In 2006 the Global Burden of Disease Studies (GBDS) reported detailed cause of death estimates for the South Asian region based on 2001 data.72 CHD was reported to be the number one cause of death in South Asia, accounting for 13.6% of all deaths, and CbVD was the fourth leading cause of death, accounting for 6.8% of all deaths.72
Temporal trends
In South Asia CHD is expected to rise in parallel with increasing life expectancy, increase in per capita income, and decline in infant mortality.72,73 There are few direct measures of CHD incidence from India, which makes evaluation of trends difficult. However, indirect comparisons of studies in which CHD incidence was defined using ECG indicate that CHD incidence is probably increasing in India.74
Common risk factors
Historically most populations from South Asia have documented low levels of CVRF, particularly blood lipid levels, diabetes and hypertension. However, over the past several decades, the prevalence of these risk factors has increased, especially in urban areas.75 For example, a recent survey of six major cities of India including 11 216 participants ≥20 years reported a diabetes prevalence of 12.1% and impaired glucose tolerance prevalence of 14.1%,76 in contrast to rates of diabetes reported in urban studies in the 1970s of 1–3%.77 There is also evidence that diabetes rates are increasing in rural areas. In comparison to the rates reported by the PODIS study (including 41 270 adults ≥ 25 years conducted between 1999 and 2002) of 1.9% in rural and 4.6% in urban areas, recent rural studies from select states report rates as high as 13%.78,79 Similarly, rates of hypertension have increased from about 5% in urban areas in the 1960s to 12–15% in the 1990s.80 Recent studies have also documented high rates of abdominal obesity in select urban and rural areas. In a survey of employees aged 20–59 years in a large industry near Delhi (n = 2935), 43% had central obesity (waist > 90 cm) and the metabolic syndrome was present in 28–35% of individuals depending on the diagnostic criteria used.81 In a survey of rural adults from Andhra Pradesh (n = 4535), the prevalence of central obesity (waist >90cm in men, > 80 cm in women) was 26.0% and the prevalence of metabolic syndrome ranged from 24.6% to 30.2% depending on the definitions used.82
Smoking rates are also high in India, particularly amongst men. Rural rates of smoking are higher than urban rates and may reflect socio-economic differences. In a cross-sectional survey (n = 19 973) of Indian industrial employees and family members from urban and peri-urban areas, tobacco use was significantly more prevalent in low versus high education groups (56.6% v 12.5%).83 While previous evidence has indicated the possible importance of novel risk factors, such as higher levels of lipoprotein (a), homocysteine, fibrinogen, and plasminogen activator inhibitor (PAI-1),84 in South Asian populations that may be driving the epidemic of CVD in South Asians, recent findings suggest otherwise. The INTERHEART study found protective factors were lower in South Asian controls than in controls from other countries (moderate-or high-intensity exercise, 6.1% v 21.6%; daily intake of fruits and vegetables, 26.5% v 45.2%; alcohol consumption once/wk, 10.7% v 26.9%). However, some harmful factors were more common in South Asians living in India than in individuals from other countries (elevated apoB/apoA-I ratio, 43.8% v 31.8%; history of diabetes, 9.5% v 7.2%). Similar relative associations were found in South Asians compared with individuals from other countries for the risk factors of current and former smoking, apoB/apoA-I ratio for the top versus lowest tertile, abdominal obesity as measured by the WHR for the top versus lowest tertile, history of hypertension, history of diabetes, psychosocial factors such as depression and stress at work or home, regular moderate-or high-intensity exercise, and daily intake of fruits and vegetables. Alcohol consumption was not found to be a risk factor for acute MI in South Asians, likely because the reported use of regular alcohol intake is low. The combined odds ratio (OR) for all nine risk factors was similar in South Asians (123.3, 95% CI 38.7–400.2) to individuals from other countries (125.7, 95% CI 88.5–178.4). The similarities in OR for the risk factors explained a high and similar degree of population attributable risk in both groups (85.8%, 95% CI 78.0–93.7%) versus 88.2% (95% CI 86.3–89.9%), respectively. When stratified by age, South Asians had more risk factors at ages younger than 60 years, which explained the younger mean age of MI in South Asians compared with other countries (Fig. 19.1).85


