Chapter 17 Essentials of Imaging and Imaging Technologies Related to Arrhythmias
A. Cardiac Computed Tomography
Introduction
Recent advances in imaging technology are starting to have a profound effect on the practice of electrophysiology. Radiological scans, such as computed tomography (CT) and magnetic resonance imaging (MRI), offer high-quality anatomic visualization with high spatial and temporal resolution and can thus enhance efficacy and reduce the risks associated with procedures such as LA ablation for AF through more precise anatomic depiction, aiding accurate planning of ablation.1
Segmentation
Technical Considerations
Most medical images are in a digital format and are made up of an array of small square or rectangular elements called pixels.2 Each pixel has associated image intensity. This provides the coordinate system of the image, and an element in the image can be assessed by its two-dimensional position within this array. For example, a typical CT slice is formed of 512 × 512 pixels, each corresponding to a portion of the cut through the patient measuring about 0.5 × 0.5 mm2. The matrix and the pixel size are related to the display field of view (FOV). If, for example, the FOV is 25 cm, each pixel will be FOV/matrix size 25/512 = 0.48 mm2. This dimension determines the limiting in-plane spatial resolution of the image. The two-dimensional axial slices are then stacked together to form a three-dimensional volume. Each pixel corresponds to a small volume element called a voxel. The height of the voxel is determined by the slice thickness. If the axial slice thickness in the above example is 1.5 mm, the voxel size would be 0.48 × 0.48 × 1.5 mm3.
Computed Tomography Imaging
In a CT imaging system configuration, an x-ray projects a fan-shaped beam that is collimated to lie within an x-y plane of a Cartesian coordinate system and generally referred to as the imaging plane.1,2 Thus, during CT imaging, the anatomy of interest passes through this imaging plane, and the image data of interest are acquired and reconstructed. This acquisition is typically accomplished by obtaining different views as the x-ray source and detectors rotate around the anatomy or volume. Reconstruction of these data generates a two-dimensional array of quantized grayscale values or pixels. Pixel values are a measure of the x-ray attenuation in Hounsfield units (HU), where the HU = 1000 – (4µ/µw – 1), µ being the average linear attenuation coefficient of the volume element represented by the pixel and µw the linear coefficient of water for the effective energy at the beam exiting the patient. Thus, water has an HU number of 0, and a region with a CT number of 100 HU has a linear attenuation coefficient that is 1% greater than the linear attenuation coefficient of water.
Image Segmentation
Following scanning, cardiac images are generated by postprocessing of one phase of axial image datasets. The cardiac chamber volumes are based on the boundary between the contrast-enhanced blood pool, which is of bright appearance because of the contrast, and the endocardium, which is not contrast enhanced. This allows for clear differentiation of the lumen and the myocardial wall. The process of dividing images into different regions to visualize areas of interest is called segmentation.3,4 Image segmentation methods can be grouped into thresholding, boundary detection, and region identification.
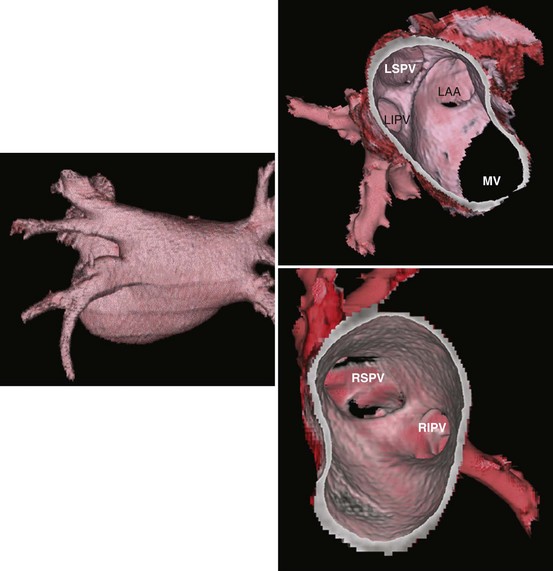
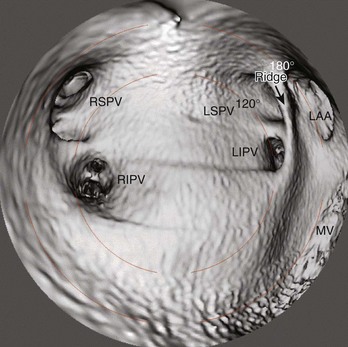
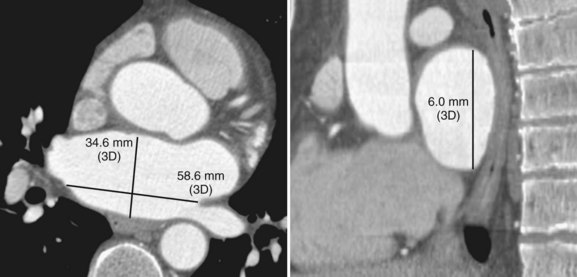
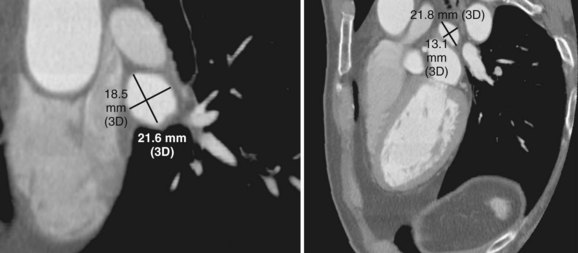
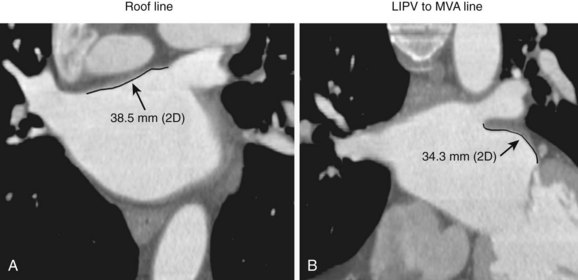
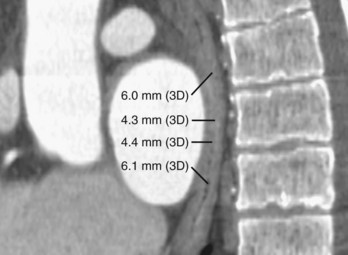
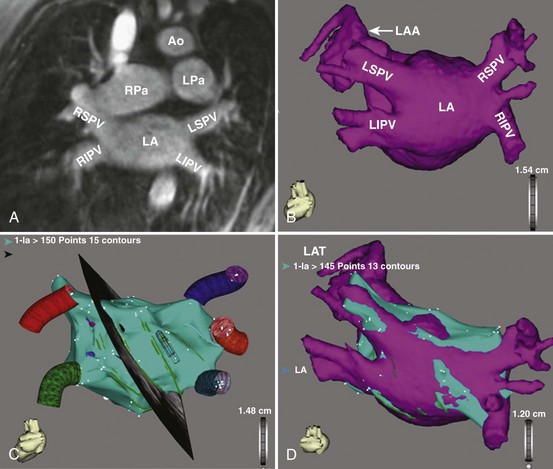
Three-dimensional endocardial views, navigator views, and various measurements can be obtained from the imaged and segmented data (Figures 17-1 and 17-2). Cut planes can be used to remove a portion of the surface. The resultant model can show endocardial surface and pulmonary veins (PVs) as if from inside the chamber. Cutting away the anterior surface, for example, gives a good view of the posterior LA endocardium. Left and right anterior views can provide excellent delineation of right and left PVs, respectively. The navigator view shows the LA from the perspective of a virtual endoscope. Several measurements such as the LA volume (Figure 17-3), PV ostium (Figure 17-4), mitral isthmus and distance between the superior PVs (Figure 17-5), and relationship of the esophagus to the LA (Figure 17-6) can be made due to their relevance to some of the linear and other lesions performed in some AF procedures in these areas. For LA dimension measurement, a series of three lines or axes are drawn in the LA to measure chamber dimensions and to serve as the basis for creating a coordinate system in the LA. First, a line is drawn near the posterior portion of the LA connecting the junction point of the right superior and inferior veins to the junction point of the left superior and inferior veins. This creates the x-axis. Next, a line is drawn through the mid-portion of the x-axis, forming the y-axis. Finally, drawing a line through the intersecting points of the x– and y-axes creates a z-axis of the coordinate system. The length of these lines serves as the LA dimensions. In the case of measuring mitral isthmus dimensions, for example, markers can be placed on the three-dimensional volume at the inferolateral aspect of the left inferior PV, the posterolateral aspect of the mitral annulus, and midway between these two points help define the optimal line. Then, a cut plane that passes through these points is defined. Finally, the distance along this surface reaching from the left inferior PV to the mitral annulus is measured. PV ostial dimensions are measured using a standard double-oblique approach. An initial oblique cut is made along the shaft or lumen of the vessel. A second oblique cut is then made and positioned orthogonally to the first cut plane. The long and short axes are then measured. For LA esophageal measurement, axial slices are scanned. A point is deposited in the center of the esophageal lumen. An oblique cut plane is then created through this point, orthogonal to the posterior LA and the esophagus. Four measurements are made of the distance between the posterior LA endocardium and the esophagus.
Imaging of the Atrium and Pulmonary Veins
A thorough understanding of the morphologic characteristics of the LA and PVs in detail will not only help achieve a more efficient ablation but also prevent procedure-related complications such as PV stenosis and others by delineating the relationship of the LA to surrounding structures such as the esophagus and by helping to choose the right tools for mapping and ablation. A survey given to task force members for the AF ablation consensus document revealed that approximately two thirds of centers are routinely obtaining MRI or CT scans in patients scheduled to have an AF ablation.5
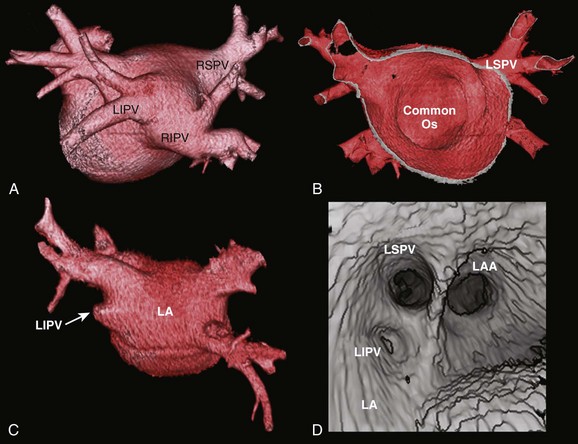
Detailed imaging studies have shown that anywhere from 65% to 80% of patients have four PVs, and some have left common and right middle PVs as well (Figure 17-7).6 Part of the main trunk of the right superior PV passes immediately behind the right superior vena cava (SVC) junction. It has also been shown that the right superior PV trunk branches out significantly sooner than do the left PVs. The right inferior PV arises inferiorly and laterally to the right superior PV. It divides almost immediately, within 5 to 10 mm, into superior and inferior branches. The distance between the right superior and right inferior PVs across the canal ridge varies from 2 to 8 mm. In 18% to 29% of cases, a supernumerary right PV may arise independently on the right side.7
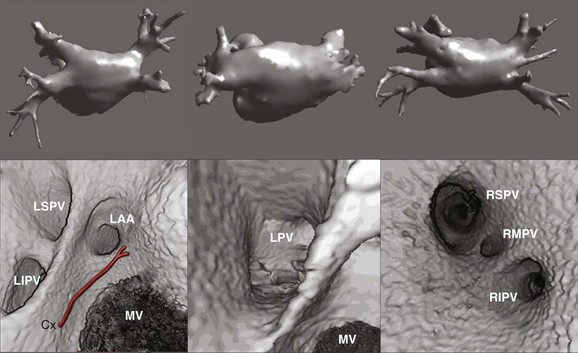
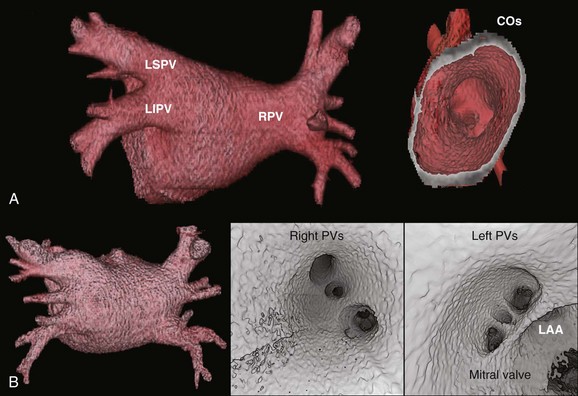
The left superior PV lies superiorly and posteriorly to the LA appendage. It enters the LA in a more vertical direction. It usually has multiple branches, which ordinarily arise 10 to 20 mm from their base. The left inferior PV enters the LA more horizontally from a posterolateral position and branches almost immediately. A common antrum of the left superior and inferior PVs is seen in 3% to 30% of patients. Some studies have suggested this number may be even higher. In a series of more than 500 CT scans done at the author’s institution, in addition to the left common and right middle PVs, other unusual anatomies, including one common right PV, three PVs on the right and left, and one common ostium of the left inferior PVs, were seen.8 Examples are depicted in Figures 17-8 and 17-9.
PV ostia are ellipsoid, with a longer superoinferior dimension, and funnel-shaped ostia are frequently noted in AF patients. PVs are larger in patients with AF versus those without AF, in men versus women, and in persistent versus paroxysmal patterns.9 The understanding of these anatomic relationships is essential for accomplishing safe access to the LA using the trans-septal puncture, for placement of appropriate mapping tools such as a circular mapping catheter or multi-electrode basket catheter as well as Cryo balloons, and for application of energy around or outside the PV ostia. The variability of PV morphologies could substantially influence the success rate of catheter ablation if the variant veins are inadequately treated. Multiple ramifications and early branching observed in right inferior PVs possibly account for the lower incidence of focal origin of AF from this vein. These anatomic variations are important in planning catheter ablation of AF (Figure 17-10). Localization of the true LA PV, the LA appendage, and the ridge between the PV and the LA appendage in these patients can be more accurate with the assistance of three-dimensional CT images before mapping and ablation procedures.10
Left Atrial Registration
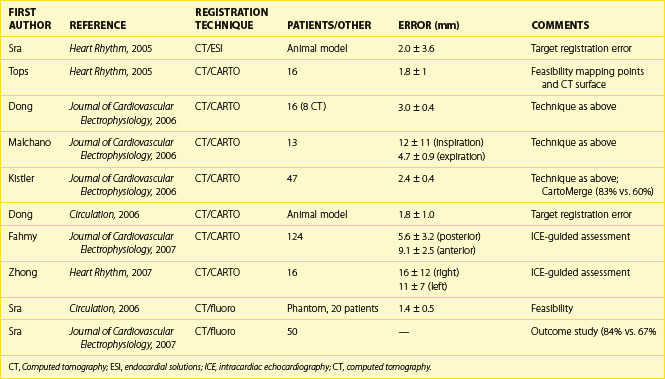
To improve intraprocedural guidance using current imaging techniques for ablation, cardiac image registration is currently under investigation and is in clinical use for AF ablation. Table 17-1 depicts some of the studies published in this regard. Cardiac image registration, which involves integration of two images in the context of the LA, is intermodal with the acquired image and the real-time reference image residing in different image spaces and involves optimization, where one image space is transformed into the other. Unlike rigid body registration, cardiac image registration is unique and challenging because of cardiac motion during the cardiac cycle and respiration motion. Registration algorithms involve the optimization of a cost function by the choice of a transformation, which transforms one image space into the other. The transformation can be either linear or nonlinear. Linear transformations are shape preserving and are composed solely of rotations, translations, and isotropic scaling. Nonlinear transformations may deform both the shapes and sizes of images. A linear transformation between three-dimensional spaces is defined by six parameters (or degrees of freedom), where two positions of a rigid body can always be related to one another in terms of three translations and three rotations. As the voxel sizes in each image may not be similar for calibration purposes, three extra degrees of freedom, equating to scaling in each direction, are needed. A simplified rigid body registration involves translation, scaling, and rotation, where the centroid, or the center part, is aligned in each image. Subsequently, scaling is performed to calibrate both images. This is followed by rotation to align the fiducial points. A nonlinear transformation will require more degrees of freedom.
Many steps have been taken recently to develop methods of integrating three-dimensional structural details from acquired cardiac images with the real-time view of the interventional systems. The main modalities for catheter viewing, mapping systems, fluoroscopy, and ultrasound have been used in these techniques.11 The following section describes some recent advances in the registration of acquired, structurally revealing three-dimensional images with real-time images.
Registration Using Anatomic Mapping Systems
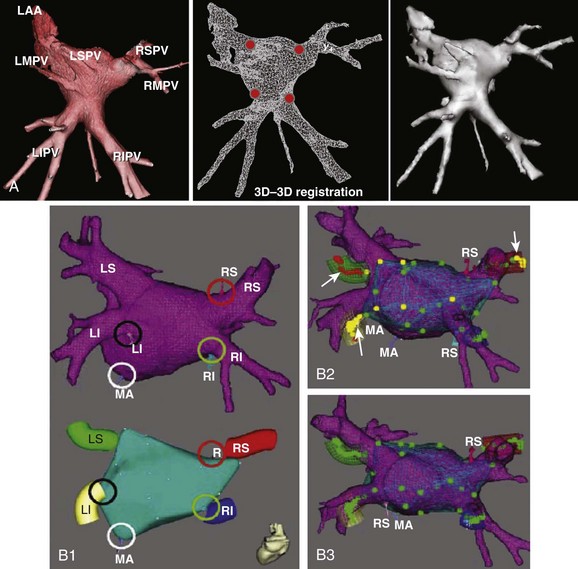
Anatomic mapping systems provide the three-dimensional position of a navigational catheter within the cardiac chamber of interest and, in some instances, can also be used to construct three-dimensional maps of the cardiac chamber. Magellan and CARTO (Biosense Webster Inc., Diamond Bar, CA) use the electromagnetic position of the catheter tip, based on an electromagnetic locator pad, which is placed below the patient, and a reference catheter is placed at a fixed external (usually posterior) location. LocaLisa (Medtronic Inc., Minneapolis, MN) and NavX (St Jude Medical Inc., St Paul, MN) catheters are used to register the image. Previous results of this method have indicated that registration of the left ventricle alone results in inaccurate alignment. Inclusion of the aorta in the registration process rectifies this error. A clinical application of this technique that uses the CARTO system (CartoMerge), the multi-electrode catheter, and the NavX with either CT or MRI is now available.11,12 A combination of landmark and surface registrations is used to register CT with the CARTO system. Initially, several landmarks, usually three, are manually chosen and annotated. After this, the reconstructed three-dimensional image of the LA using CT or MRI is superimposed on the electroanatomic map created by the CARTO mapping system. Figure 17-11 depicts an example of CARTO and CT registration using landmark (fiducial point) and surface registrations.
X-Ray Registration
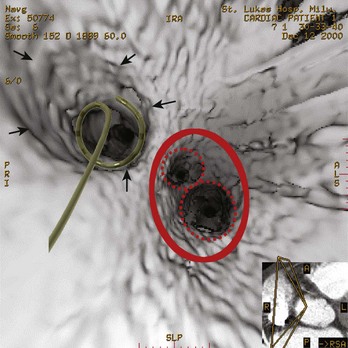
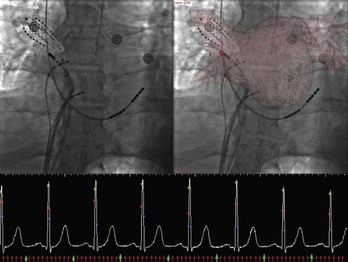
Registration with fluoroscopy can be performed in the exported three-dimensional model by using a transformation to align the coronary sinus catheter seen on fluoroscopy with the SVC and the coronary sinus in the exported three-dimensional CT model. The author’s center has recently described an implementation of a semi-automated three-dimensional/two-dimensional CT-fluoroscopy registration strategy.13 The accuracy of this system was found to be within 1.4 mm in phantom studies. This strategy was also assessed in patients undergoing AF ablation. Twenty consecutive patients underwent ECG-gated, contrast-enhanced CT scanning. The LA and the PVs were segmented using the semi-automated method described before. The segmented images of the LA PV were then registered in real time on acquired digital cine or fluoroscopic images by superimposing the coronary sinus catheter, as seen on the cine image, over the SVC and coronary sinus as described before. Accurate registration was confirmed by PV angiography as well as by the position and recordings on a 64-pole basket catheter located in the PVs (Figure 17-12). The author’s center has continued to use this strategy for PV isolation and LA linear ablation procedures on patients with AF. In a recent study, 50 patients with AF undergoing ablation were randomized to standard ablation techniques or ablation guided by CT-fluoroscopy registered images. Fluoroscopy time and total procedure time were significantly reduced in the CT-fluoroscopy group, and a trend toward better outcomes was observed. The complex translational, rotational, and conformational changes that occur with cardiac and respiratory motions will introduce error into the registration process when, as in three-dimensional/two-dimensional registration, a static image is “aligned” with the real-time fluoroscopic image. Attempts at gating the registration process so that image integration occurred during the same phase of the cardiac cycle were successfully implemented in experiments conducted in the author’s laboratory; thus, fluoroscopic images can be taken at the same phase as the segmented CT images, that is, during diastole (see Figure 7-12). Synchronizing registration to the respiratory cycle during expiration or inspiration, the phase during which CT imaging has been done, could potentially eliminate movement of the LA during respiration.
Other Applications in Cardiac Arrhythmias
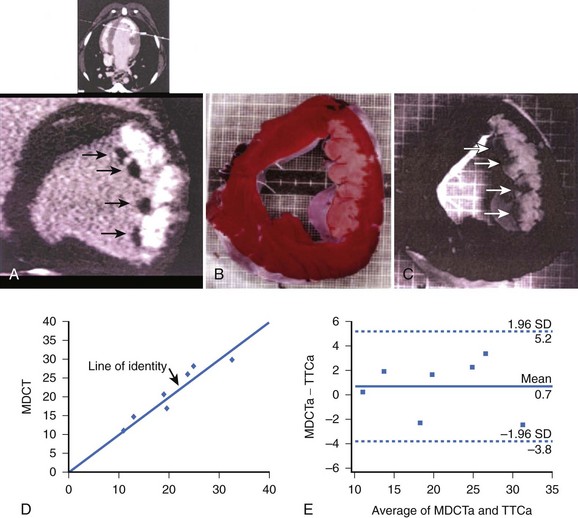
The ability to distinguish the dysfunctional but viable myocardium from nonviable tissue may have important prognostic implications after myocardial infarction (MI). A study by Lardo et al validated the accuracy of contrast-enhanced multi-detector CT (MDCT) for quantifying myocardial necrosis, microvascular obstruction, and chronic scar after occlusion or reperfusion MI.14 In this study, 10 dogs and 7 pigs underwent balloon occlusion of the left anterior descending (LAD) coronary artery followed by reperfusion. Contrast-enhanced (Visipaque, 150 mL, 325 mg/mL) MDCT (0.5 mm, 32-slice) was performed before occlusion and 90 minutes (canine) or 8 weeks (porcine) after reperfusion. MDCT images were analyzed to define infarct size and extent and microvascular obstruction and compared with postmortem myocardial staining (triphenyltetrazolium chloride) and microsphere blood flow measurements. Acute and chronic infarcts by MDCT were characterized by hyper-enhancement, whereas regions of microvascular obstruction were characterized by hypo-enhancement. MDCT infarct volume compared well with triphenyltetrazolium chloride staining (acute infarcts, 21.1% ± 7.2% vs. 20.4% ± 7.4%; mean difference, 0.7%; chronic infarcts, 4.15% ± 1.93% vs. 4.92% ± 2.06%; mean difference 0.76%) and accurately reflected the morphology and the transmural extent of injury in all of the animals (Figure 17-13). Peak hyper-enhancement of infarcted regions occurred 5 minutes after contrast injection. MDCT-derived regions of microvascular obstruction were also identified accurately in acute studies and correlated with reduced-flow regions as measured by microsphere blood flow. This study thus suggested that the spatial extent of acute and healed MI could be determined and quantified accurately with contrast-enhanced MDCT. This feature, combined with existing high-resolution MDCT coronary angiography, may have important implications for the comprehensive assessment of cardiovascular disease.
Other studies have shown the role of CT in imaging coronary sinus and left ventricular anatomy and function to define sites for biventricular pacing in patients with congestive heart failure (Figures 17-14 to 17-17). CT imaging has also been used to perform left ventricular functional analysis using post-processing algorithms or detailed left ventricular motion analysis, thus enabling identification of sites where left ventricular pacing should improve efficacy of biventricular pacing.15
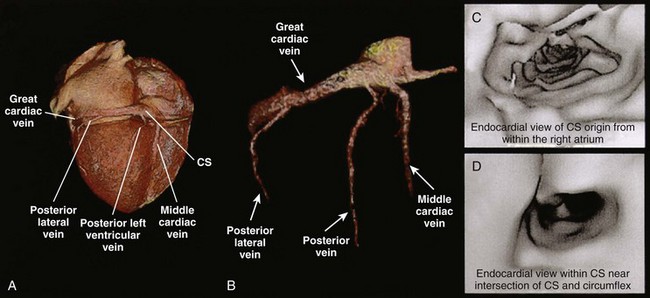
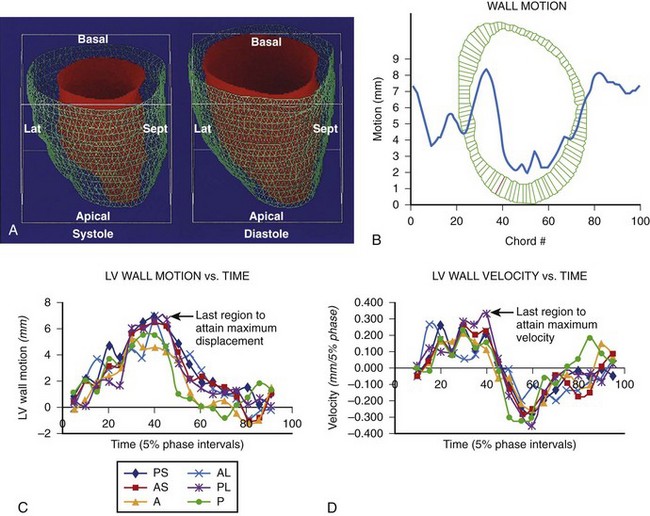
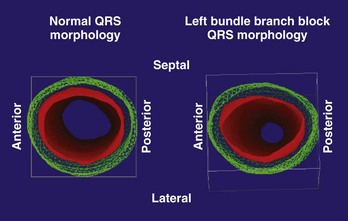
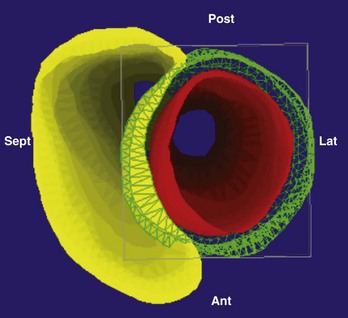
FIGURE 17-17 Right and left ventricular wall motion during left bundle branch block in the patient with left bundle branch block, as shown in Figure 17-16. The right ventricle is shown in yellow. During systole, asynchronous contraction of the left ventricle is seen. Post, Posterior; Lat, lateral; Ant, anterior; Sept, septal.
B. Cardiac Magnetic Resonance Imaging
Introduction
Three-dimensional mapping systems became available in the mid-1990s, allowing the real-time display of a catheter tip within a mathematically reconstructed cardiac chamber.16 However, they lacked the anatomic detail desired for complex ablation procedures. Therefore, cardiac imaging was increasingly used in patients undergoing complex ablations such as AF ablations. Today, pre-procedural MRI or CT is used to characterize the individual anatomies of the LA and the PV and has become standard-of-care in many arrhythmia centers. This allows for a tailored, patient-specific ablation approach. Detailed anatomic information gained from cardiac imaging is being made available during the ablation procedure by integrating these images with three-dimensional mapping systems. In addition, imaging is used in the detection of procedural complications and postprocedural patient care.
Current Technology of Image Integration
The ability to visualize the true three-dimensional anatomy from cardiac imaging fueled the integration of these datasets with clinical three-dimensional mapping systems to provide the electrophysiologist with patient-specific cardiac anatomy during the ablation procedure. Before the era of three-dimensional mapping, catheter navigation was guided by fluoroscopy with its known limitations with regard to visualization of soft tissue, catheter contact, and patient exposure to ionizing radiation. In the late 1990s, three-dimensional mapping systems that significantly reduced fluoroscopy time up to 82% for atrial flutter and 49% for AF became available.17,18
The two most commonly used three-dimensional mapping systems are Biosense Webster’s CartoMerge and St. Jude Medical’s Ensite NavX navigation system. The former uses electromagnetic fields to locate an endocardial catheter, whereas the latter uses electrical signals transmitted through the patient’s body. Image integration refers to a process in which the detailed three-dimensional anatomy from MRI or CT is extracted and superimposed on the endocardial shell created from catheter recordings (Figure 17-18). To create the endocardial shell with a three-dimensional mapping system, a roving catheter is moved sequentially along the endocardial surface, and location points are acquired. On the basis of the collected points, an electroanatomic shell which approximates the actual cardiac anatomy is mathematically reconstructed. An accurate registration (alignment of the MRI-derived dataset with the catheter-created shell) is critical for accurate anatomic catheter placement. Registration is performed by selecting several corresponding, well-defined anatomic landmarks such as the PV ostia and the posterior LA wall on the catheter-derived shell and the MRI-derived three-dimensional model. Depending on the mapping system, additional proprietary algorithms can adjust the three-dimensional model position to achieve the minimal average registration error between the shell and three-dimensional model points (surface registration) or will adjust points of the catheter-derived map to fit into the three-dimensional anatomic model (dynamic registration).12,19 The resulting registration accuracies have been reported in the range of 1 to 4 mm.12,19
Stay updated, free articles. Join our Telegram channel

Full access? Get Clinical Tree


