Endothelial progenitor cells (EPCs) are released from the bone marrow during cardiac ischemic events, potentially influencing vascular and myocardial repair. We assessed the clinical and angiographic correlates of EPC mobilization at the time of primary percutaneous coronary intervention in 78 patients with ST elevation myocardial infarction and the impact of both baseline and follow-up EPC levels on left ventricular (LV) remodeling. Blood samples were drawn from the aorta and the culprit coronary artery for cytofluorimetric EPC detection (CD34+CD45dimKDR+ cells, in percentage of cytofluorimetric counts). Area at risk was assessed by Bypass Angioplasty Revascularization Investigation myocardial jeopardy index, thrombotic burden as thrombus score and microvascular obstruction (MVO) as a combination of ST segment resolution and myocardial blush grade. Echocardiographic evaluation of LV remodeling was performed at 1-year follow-up in 54 patients, whereas peripheral EPC levels were reassessed in 40 patients. EPC levels during primary percutaneous coronary intervention were significantly higher in intracoronary than in aortic blood (0.043% vs 0.0006%, p <0.001). Both intracoronary and aortic EPC were related to area at risk extent, to intracoronary thrombus score (p <0.001), and inversely to MVO (p = 0.001). Peripheral EPC levels at 1-year follow-up were lower in patients with LV remodeling than in those without (0.001% [0.001 to 0.002] vs 0.003% [0.002 to 0.010]; p = 0.01) and independently predicted absence of remodeling at multivariate analysis. In conclusion, a rapid intracoronary EPC recruitment takes place in the early phases of ST elevation myocardial infarction, possibly reflecting an attempted reparative response. The extent of this mobilization seems to be correlated to the area at risk and to the amount of MVO. Persistently low levels of EPC are associated to LV remodeling.
Endothelial progenitor cells (EPC) are bone marrow–derived cells with ability to repair the damaged endothelium, possibly participating in vascular and myocardial repair. In the last decade, several studies have documented a rapid mobilization of EPC into the blood stream during an acute ischemic event, and a continuous EPC release during the chronic phase of coronary artery disease, mirroring vascular health and impacting on long-term prognosis. EPC mobilization after ST segment elevation myocardial infarction was associated with reduced left ventricular (LV) remodeling and better clinical outcome, and we recently demonstrated that the extent of ischemic myocardium (and not the final infarct size) is a predictor of EPC release. However, little is known on the other determinants of EPC mobilization in ST elevation myocardial infarction. In particular, although it is conceivable that EPC are mobilized to help in repairing the damaged endothelium, no relation between EPC mobilization and microvascular obstruction (MVO), a feared complication of primary percutaneous coronary intervention (PCI), has previously been shown. We sought to test whether EPC, assessed during primary PCI in the intracoronary and aortic blood and at 1 year in the peripheral blood, correlated with the effectiveness of reperfusion and/or predicted LV remodeling.
Methods
Seventy-eight consecutive patients with ST elevation myocardial infarction, treated with primary PCI with thrombus aspiration were prospectively enrolled from 170 primary PCIs performed in our institution during August 2009 to December 2010 ( Supplementary Figure 1 ). All patients were admitted to our coronary care unit with chest pain, new persistent ST segment elevation, high-sensitivity cardiac Troponin T >0.0015 ng/ml, and/or new regional wall motion abnormalities. Exclusion criteria for all patients were age >80 years, infarction secondary to ischemia due to an imbalance of oxygen supply and demand, previous electrocardiographic abnormalities that could interfere with ST segment analysis and interpretation, recent or chronic infective or inflammatory diseases, malignancy, surgery or trauma in the previous month, or coronary anatomy judged unfavorable for thrombus aspiration. Patients undergoing rescue PCI were also excluded. All patients received aspirin (250 mg intravenous) and clopidogrel (600 mg or 300 mg if already on clopidogrel), plus standard heparin to maintain activated clotting time >300 seconds. Glycoprotein IIb/IIIa antagonists were administered at physicians’ discretion after thrombus aspiration. Local ethical committee approved the study, and all patients signed an informed consent. All procedures were followed in accordance with the ethical standards of the responsible committees on human experimentation and with the Declaration of Helsinki.
The identification of the infarct-related artery was based on angiographic characteristics, clinical and electrocardiographic findings. Area at risk, corresponding to ischemic myocardium distal to the culprit lesion, was assessed using the Bypass Angioplasty Revascularization Investigation myocardial jeopardy index (BARI) as previously described (for details, see Supplementary Materials ). Angiographic collateral flow was assessed by Rentrop classification, assigning a score from 0 to 3, in which 0 indicated total absence of visually identifiable collateral vessels and 3 indicated a complete retrograde filling of the infarct-related artery. Thrombus score (TS) was calculated as described elsewhere (for details, see Supplementary Materials ).
Thrombolysis In Myocardial Infarction flow grade and corrected Thrombolysis In Myocardial Infarction frame count (cTFC) were calculated at the end of primary PCI as previously described. Myocardial blush grade (MBG) was assessed and scored as MBG 0, 1, 2, and 3 in all patients at the end of each procedure. We also assessed a more reproducible angiographic measurement of microvascular perfusion, the quantitative blush evaluator (QuBE) score. All patients enrolled had paired electrocardiograms recorded at baseline and at 90 minutes after primary PCI for ST resolution (ΣSTR) calculation, classified as complete (≥70%), partial (30% to 70%), or absent (<30%) (for further details see Supplementary Materials ). MVO was defined as a combination of ΣSTR <70% and either Thrombolysis In Myocardial Infarction flow grade <3 or Thrombolysis In Myocardial Infarction flow grade 3 with MBG <2.
Two blood samples were sequentially obtained: one from the guiding catheter in ascending aorta before culprit coronary artery cannulation and another from the culprit coronary artery through the thrombectomy catheter. Assessment of hematocrit (%) and white blood cell count (n/μl) was performed on coronary and aortic blood samples. Cardiac Troponin T was quantitatively determined by the Clinical Chemistry Laboratory at Gemelli Hospital (Rome, Italy) using a 1-step electroimmunoassay according to the electrochemiluminescence technology (Elecsys 2010, Roche Diagnostics, Milano, Italy), with a lower detection limit of 0.001 ng/ml. Cytofluorimetric detection of CD34+CD45dimKDR+ cells was performed as recently described (for further details see Supplementary Materials ).
Conventional 2-dimensional echocardiography was performed <24 hours from admission and at 1-year follow-up to assess LV volumes, LV regional and global function (for details see Supplementary Materials ). LV remodeling was defined as an increase in LV end-diastolic volume ≥20% at 1-year follow-up compared with baseline. At 1 year, clinical assessment and echocardiography were performed in 54 of the 78 patients enrolled. At the same time point, CD34+CD45dimKDR+ EPC levels in peripheral venous blood were measured in 40 of the 54 patients ( Supplementary Figure 1 ).
All variables are expressed as mean ± SD or as median accompanied by interquartile range, as appropriate. CD34+CD45dimKDR+ cell levels, BARI score, cTFC, and QuBE values are shown as median and interquartile ratio, as Shapiro-Wilk test showed that the data were not normally distributed but positively skewed. To allow the use of parametric techniques, common logarithmic transformation was applied. After transformation, paired samples t test was performed to compare intracoronary and aortic CD34+CD45dimKDR+ cells levels.
Frequencies were compared with chi-square or Fisher’s exact test, as appropriate. Trends in proportions were assessed with a linear-by-linear association test. Analysis of variance with p for linear trend calculation was used to assess the relation between CD34+CD45dimKDR+ cells levels and Rentrop Score, MBG, and TS, with Scheffe’s posthoc comparisons. Correlations between CD34+CD45dimKDR+ cells levels, BARI score, cTFC, and QuBE values were assessed by Pearson’s R correlation coefficient. Moreover, to evaluate whether CD34+CD45dimKDR+ cells levels were independently associated to LV remodeling, a multivariate logistic regression model was used to estimate the odds ratios and 95% confidence intervals. Initially, a univariate exploratory analysis was performed, comparing intracoronary and aortic CD34+CD45dimKDR+ cells levels in the acute phase and at 1-year follow-up with the variables potentially related to LV remodeling, including TS, anterior myocardial infarction, total ischemic time, Killip class, MVO, and previous myocardial infarction. Afterwards, only those variables with a probability value <0.05 were entered en block into the multivariate model, with age and gender as background variables. Statistical analysis was performed using SPSS 17.0 (SPSS, Inc. Chicago, Illinois), and p values <0.05 were considered statistically significant.
Results
Clinical and angiographic characteristics of enrolled patients are listed in Tables 1 and 2 , respectively.
| Baseline Characteristics | All Patients | MVO | p | |
|---|---|---|---|---|
| No (n = 56) | Yes (n = 22) | |||
| Men | 59 (76) | 43 (77) | 16 (73) | 0.71 |
| Age (yrs) | 63 ± 13 | 62 ± 12 | 66 ± 15 | 0.34 |
| Diabetes mellitus | 20 (26) | 16 (29) | 4 (18) | 0.34 |
| Hypertension ∗ | 55 (71) | 40 (71) | 15 (68) | 0.77 |
| Smoker | 31 (40) | 24 (43) | 7 (32) | 0.67 |
| Family history of coronary artery disease | 29 (37) | 19 (34) | 10 (45) | 0.34 |
| Hypercholesterolemia † | 32 (41) | 20 (36) | 12 (54) | 0.13 |
| Total cholesterol (mg/dl) | 178 (150–210) | 172 (150–212) | 192 (147–218) | 0.74 |
| LDL (mg/dl) | 106 (82–134) | 102 (84–131) | 119 (76–140) | 0.54 |
| HDL (mg/dl) | 44 (38–50) | 43 (34–50) | 46 (40–49) | 0.31 |
| Triglycerides (mg/dl) | 125 (81–161) | 142 (95–169) | 86 (73–133) | 0.06 |
| Killip class | ||||
| I | 50 (64) | 41 (73) | 9 (41) | 0.05 |
| II | 17 (22) | 9 (16) | 8 (36) | |
| III | 8 (10) | 4 (7) | 4 (18) | |
| IV | 3 (4) | 2 (4) | 1 (5) | |
| Preinfarction angina pectoris | 37 (47) | 27 (48) | 10 (45) | 0.83 |
| Total ischemic time (h) | ||||
| ≤3 | 37 (47) | 32 (58) | 5 (23) | 0.004 |
| 3–5 | 16 (20) | 12 (21) | 4 (18) | |
| ≥6 | 25 (33) | 12 (21) | 13 (59) | |
| Serum creatinin (mg/dl) | 1.1 (0.9–1.2) | 1.1 (0.9–1.3) | 1.1 (0.8–1.2) | 0.43 |
| Troponin T peak (ng/ml) | 6.83 (2.58–12.30) | 6.49 (2.32–9.64) | 8.22 (3.39–19.92) | 0.07 |
| Troponin T at admission (ng/ml) | 0.14 (0.02–1.39) | 0.23 (0.02–1.42) | 0.18 (0.02–1.32) | 0.22 |
| Ejection fraction (%) | 50.0 (44.0–55.0) | 50.0 (45.0–56.0) | 50.0 (46.0–52.2) | 0.68 |
| Wall motion score index (absolute units) | 1.44 (1.20–1.69) | 1.50 (1.19–1.75) | 1.40 (1.26–1.62) | 0.95 |
| LV remodeling | 17 (47) | 4 (7) | 13 (59) | 0.001 |
∗ Includes blood pressure >140/90 mm Hg.
† Includes total cholesterol level >200 mg/dl and/or low-density lipoprotein cholesterol level >130 mg/dl.
| Baseline Characteristics | All Patients | MVO | p | |
|---|---|---|---|---|
| No (n = 56) | Yes (n = 22) | |||
| Culprit coronary artery | ||||
| Left anterior descending | 36 (46) | 29 (52) | 7 (32) | 0.02 |
| Circumflex | 10 (13) | 10 (18) | 0 (0) | |
| Right | 32 (41) | 17 (30) | 15 (68) | |
| Culprit vessel size (mm) | ||||
| <2.50 | 10 (13) | 6 (11) | 4 (18) | 0.27 |
| 2.51–3.00 | 29 (37) | 21 (37) | 8 (36) | |
| 3.01–3.50 | 20 (26) | 12 (22) | 8 (36) | |
| >3.51 | 19 (24) | 17 (30) | 2 (10) | |
| Number coronary arteries narrowed | ||||
| 1 | 41 (53) | 29 (30) | 12 (55) | 0.38 |
| 2 | 18 (23) | 15 (27) | 3 (13) | |
| 3 | 19 (24) | 12 (43) | 7 (32) | |
| Radial access | 66 (85) | 48 (86) | 18 (82) | 0.52 |
| Thrombus aspiration | 78 (100) | 56 (100) | 22 (100) | 1.00 |
| Glycoprotein IIb/IIIa antagonists | 45 (58) | 29 (52) | 16 (73) | 0.13 |
| Direct stenting | 60 (77) | 44 (79) | 16 (73) | 0.53 |
| Bare-metal stent | 46 (59) | 31 (55) | 15 (68) | 0.06 |
| Drug-eluting stent | 19 (24) | 18 (32) | 1 (4) | |
| Plain old balloon angioplasty | 13 (17) | 7 (13) | 6 (27) | |
| BARI area at risk (%) | 24.1 (21.5–28.7) | 22.1 (19.3–25.4) | 29.4 (27.8–33.2) | 0.001 |
| Rentrop score | ||||
| 0 | 49 (63) | 36 (64) | 13 (59) | 0.62 |
| 1 | 18 (23) | 11 (20) | 7 (33) | |
| 2 | 7 (9) | 6 (11) | 1 (4) | |
| 3 | 4 (5) | 3 (5) | 1 (4) | |
| TS | ||||
| 1/2 | 12 (15) | 11 (20) | 1 (4) | 0.001 |
| 3 | 23 (35) | 19 (34) | 4 (18) | |
| 4 | 31 (39) | 23 (41) | 8 (36) | |
| 5 | 12 (11) | 3 (5) | 9 (42) | |
| TIMI flow before primary PCI (%) | ||||
| 0 | 46 (59) | 29 (52) | 17 (79) | 0.20 |
| 1 | 15 (19) | 12 (21) | 3 (13) | |
| 2 | 6 (8) | 5 (9) | 2 (8) | |
| 3 | 11 (14) | 10 (18) | 0 (0) | |
| TIMI flow after primary PCI (%) | ||||
| 0 | 1 (1) | 0 (0) | 1 (4) | 0.007 |
| 1 | 7 (9) | 0 (0) | 7 (33) | |
| 2 | 11 (14) | 0 (0) | 11 (50) | |
| 3 | 59 (76) | 56 (100) | 3 (13) | |
| MBG (%) | ||||
| 0/1 | 22 (28) | 0 (0) | 22 (100) | 0.001 |
| 2 | 22 (28) | 22 (39) | 0 (0) | |
| 3 | 34 (44) | 34 (61) | 0 (0) | |
| QuBE score (absolute units) | 12.2 (6.6–14.6) | 12.8 (10.3–15.9) | 5.6 (3.4–8.0) | 0.001 |
| cTFC (median, IQR) | 27.5 (20.0–40.5) | 23.5 (18.0–37.2) | 33.0 (24.0–88.0) | 0.001 |
| ΣSTR | ||||
| None (%) | 25 (32) | 12 (21) | 13 (59) | 0.006 |
| Partial (%) | 15 (19) | 6 (11) | 9 (41) | |
| Complete (%) | 38 (49) | 38 (68) | 0 (0) | |
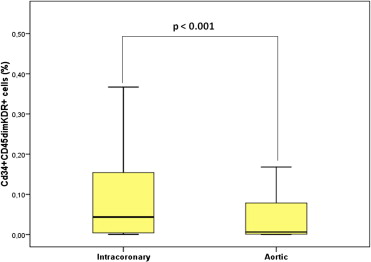
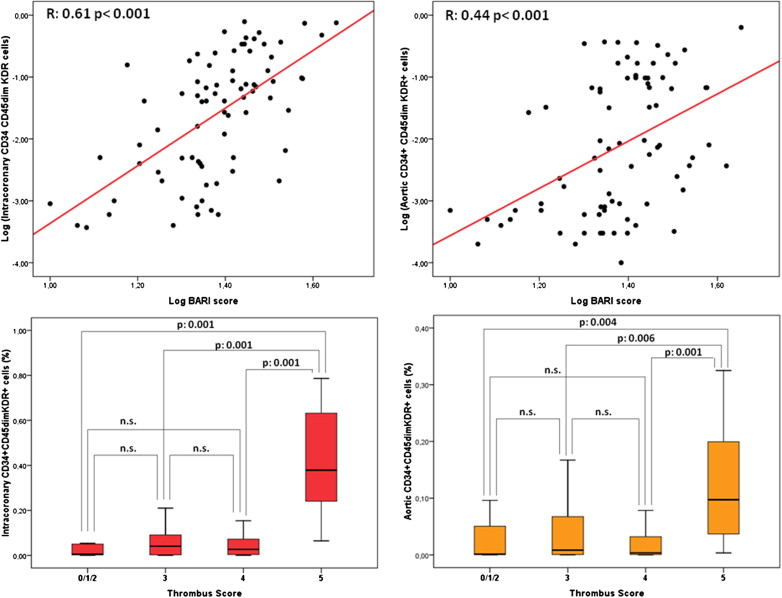
EPC levels (percentage of cytofluorimetric events) were significantly higher in intracoronary than in aortic blood (0.043% [0.004 to 0.154] vs 0.006% [0.001 to 0.083], p <0.001; Figure 1 ). In contrast, intracoronary and aortic blood did not differ with regard to hematocrit (42.0% [31.5 to 43.8] vs 39.1% [33.5 to 41], p = 0.7) and total white blood cell count (11,260 n/μl [10,507 to 13,765] vs 11,170 n/μl [10,092 to 12,760], p = 0.7). No significant relations were observed between intracoronary or aortic CD34+CD45dimKDR+ levels and Rentrop’s score (p = 0.20 and p = 0.17, respectively) or peak troponin T (R = −014, p = 0.22 and R = 0.29, p = 0.11, respectively). Both intracoronary and aortic levels of CD34+CD45dimKDR+ cells were significantly related to BARI score ( Figure 2 ). Intracoronary CD34+CD45dimKDR+ cell levels were significantly higher in patients with TS = 5 (0.378% [0.240 to 0.632]) than in those with TS = 4 (0.027% [0.004 to 0.072]), TS = 3 (0.041% [0.003 to 0.091]), or TS = 0/1/2 (0.006% [0.002 to 0.050]; p <0.001 for overall analysis of variance, p <0.001 for linear trend). Similarly, aortic CD34+CD45dimKDR+ cell levels were related to TS ( Figure 2 ).


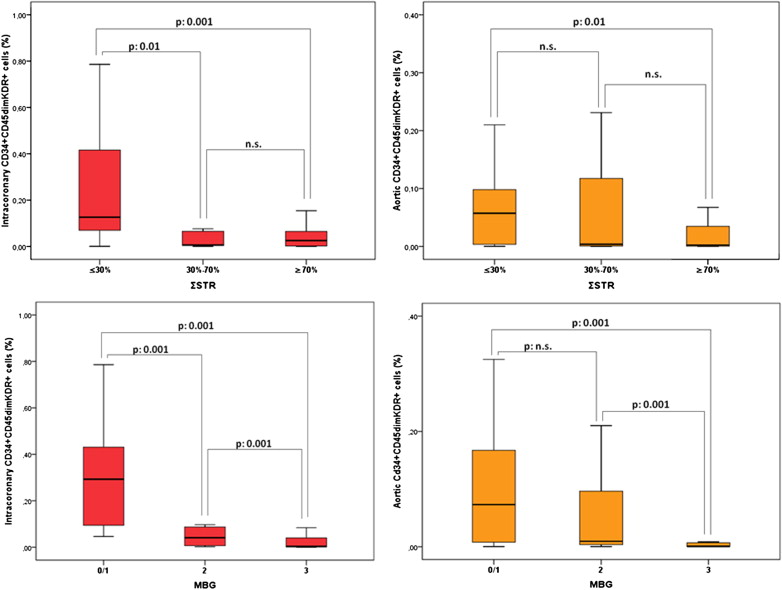
CD34+CD45dimKDR+ cell levels, both intracoronary and aortic, were significantly related to ΣSTR, with significantly higher levels in patients with absent ΣSTR (0.126% [0.070 to 0.416] and 0.057% [0.004 to 0.098]), than in those with partial (0.006% [0.004 to 0.065] and 0.004% [0.001 to 0.117]) or complete ΣSTR (0.025% [0.002 to 0.065] and 0.002% [0.001 to 0.035], see Figure 3 for p values). Intracoronary and aortic CD34+CD45dimKDR+ cell levels were also significantly related to MBG: patients with MBG 0 or 1 showed higher levels (intracoronary 0.293% [0.094 to 0.431] and aortic 0.073% [0.008 to 0.167]) than those with MBG 2 (intracoronary 0.041% [0.006 to 0.087] and aortic 0.009% [0.004 to 0.096]) and MBG 3 (intracoronary 0.004% [0.001 to 0.040] and aortic 0.001% [0.001 to 0.007], see Figure 3 for p values). When epicardial and myocardial perfusion were expressed as a continuous variables, both intracoronary and aortic CD34+CD45dimKDR+ cell levels remained significantly related to both cTFC and QuBE values (see Figure 4 for p values).


