Echocardiography provides a more accurate method to determine increased cardiac mass than does electrocardiography. Nevertheless, most offices of physicians do not possess echocardiographic machines, but many possess electrocardiographic machines. Many electrocardiographic criteria have been used to determine increased cardiac mass, but few of the criteria have been measured against cardiac weight determined at necropsy or after cardiac transplantation. Such was the purpose of the present study. Cardiac weight at necropsy or after transplantation was determined in 359 patients with 11 different cardiac conditions, and total 12-lead electrocardiographic QRS voltage (from the peak of the R wave to the nadir of either the Q or the S wave, whichever was deeper) was measured in each patient. Even in hearts with massively increased cardiac mass (>1,000 g), the total 12-lead QRS voltage was clearly increased (>175 mm) in only 94%, but this criterion was superior to that of previously described electrocardiographic criteria for “left ventricular hypertrophy.” Hearts with excessive adipose tissue infrequently had increased total 12-lead QRS voltage despite increased cardiac weight. Likewise, patients with fatal cardiac amyloidosis had hearts of increased weight but quite low total 12-lead QRS voltage. In conclusion, 12-lead QRS voltage is useful in predicting increased cardiac mass, but that predictability is dependent in part on the cause of the increased cardiac mass.
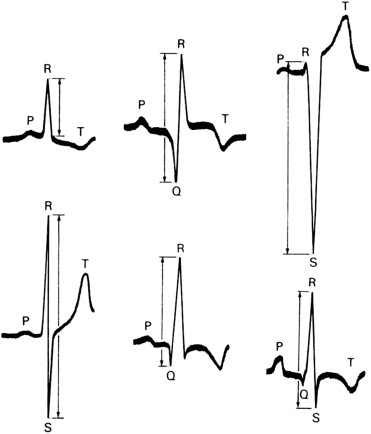
Various electrocardiographic criteria have been used to predict left ventricular hypertrophy (LVH), but few have been compared with the actual weight of the heart at necropsy or after cardiac transplantation. Exceptions are the studies by Griep in 1959, and by Allenstein and Hiroyoshi in 1960. The most common criterion used in the past 60 years is that recommended in 1949 by Sokolow and Lyon, who studied 12-lead electrocardiograms in patients who were believed to have LVH on the basis of “a cardiac disorder capable of producing increased strain on the left ventricle (such as hypertension, aortic valve lesions, coarctation of the aorta, patent ductus arteriosus).” These investigators produced a variety of electrocardiographic criteria for LVH, including among others R in lead V 5 + S 1 in lead V 1 ≥35 mm. A number of other criteria have been suggested subsequently ( Table 1 ). Siegel and Roberts in 1982 proposed that measuring the total amplitude (from the peak of the R wave to the nadir of either the Q or the S wave, whichever was deeper) of the QRS complex in all 12 electrocardiographic leads was a better determinant of cardiac mass than the previously reported criteria ( Figure 1 ). Subsequently, several investigators from the same laboratory measured total 12-lead QRS voltage in a variety of cardiac conditions and in each compared it with the heart weight determined by the same investigators. Here, we review their findings in 11 different cardiac conditions.
| No. | QRS Complex Measured | Value Considered Upper Limit of Normal (mm) | No. (%) of 17 Patients Above Normal Limit |
|---|---|---|---|
| 1a | SV 1 + RV 5 or V 6 (larger) | 35 | 12 (71%) |
| 1b | SV 1 + RV 5 or V 6 (larger) | 40 | 11 (65%) |
| 2a | SV 1 or V 2 (larger) + RV 5 or V 6 (larger) | 35 | 15 (88%) |
| 2b | SV 1 or V 2 (larger) + RV 5 or V 6 (larger) | 40 | 14 (82%) |
| 3a | SV 1 or V 2 (larger) + RV 6 | 35 | 15 (88%) |
| 3b | SV 1 or V 2 (larger) + RV 6 | 40 | 13 (76%) |
| 4a | SV 2 + RV 5 | 35 | 14 (82%) |
| 4b | SV 2 + RV 5 | 40 | 14 (82%) |
| 5a | Deepest SV 1 − V 3 + tallest RV 4 − V 6 | 35 | 14 (82%) |
| 5b | Deepest SV 1 − V 3 + tallest RV 4 − V 6 | 40 | 13 (76%) |
| 5c | Deepest SV 1 − V 3 + tallest RV 4 − V 6 | 45 | 13 (76%) |
| 5d | Deepest SV 1 − V 3 + tallest RV 4 − V 6 | 50 | 13 (76%) |
| 6a | Tallest R + deepest S in any V lead | 35 | 14 (82%) |
| 6b | Tallest R + deepest S in any V lead | 40 | 14 (82%) |
| 7a | Deepest SV 1 − V 3 | 25 | 14 (82%) |
| 7b | Deepest SV 1 − V 3 | 30 | 12 (71%) |
| 8a | Tallest RV 4 − V 6 | 25 | 9 (53%) |
| 8b | Tallest RV 4 − V 6 | 30 | 8 (27%) |
| 9a | Deepest SV 1 − V 2 | 25 | 14 (82%) |
| 9b | Deepest SV 1 − V 2 | 30 | 12 (71%) |
| 10a | Tallest RV 5 or V 6 | 25 | 9 (53%) |
| 10b | Tallest RV 5 or V 6 | 30 | 8 (27%) |
| 11 | RV 6 >RV 5 | ≤1 | 13 (76%) |
| 12a | Tallest limb-lead R + deepest limb-lead S | 15 | 15 (88%) |
| 12b | Tallest limb-lead R + deepest limb-lead S | 20 | 12 (71%) |
| 13a | R 1 + S 3 | 15 | 12 (71%) |
| 13b | R 1 + S 3 | 20 | 10 (59%) |
| 14a | Tallest limb-lead R | 10 | 14 (82%) |
| 14b | Tallest limb-lead R | 15 | 6 (35%) |
| 15a | Deepest limb-lead S | 10 | 10 (59%) |
| 15b | Deepest limb-lead S | 15 | 6 (35%) |
| 16 | R 1 | 10 | 11 (65%) |
| 17 | S 3 | 10 | 7 (41%) |
| 18a | Total 12-lead QRS voltage | 175 | 16 (94%) |
| 18b | Total 12-lead QRS voltage | 200 | 15 (88%) |
| 18c | Total 12-lead QRS voltage | 225 | 13 (76%) |
| 18d | Total 12-lead QRS voltage | 250 | 13 (76%) |
Methods
To be included in this study, a heart had to be studied in the Pathology Branch of the National Heart, Lung, and Blood Institute of the National Institutes of Health (Bethesda, Maryland). An accurate heart weight and a 12-lead electrocardiogram had to be available in all cases to be included in this study. The patients were divided into 11 groups ( Table 2 ). The electrocardiographic QRS voltage was measured in each of the 12 leads, as demonstrated in Figure 1 . In patients with >1 twelve-lead electrocardiogram available, the one measured was the one recorded closest to the patient’s death or closest to cardiac transplantation. The medical records were reviewed in all cases to provide pertinent clinical information. All hearts were examined and classified morphologically by one investigator (WCR). The QRS measurements were performed by the first author of each study and “spot checked” by WCR when not the first author.
| Condition | Gender | Number of Cases | Ages (yrs), Range (Mean) | Total 12-Lead QRS Voltage (mm), Mean | Patients With 12-Lead QRS Voltage >175 mm | Heart Weight (g), Range (Mean) | Total 12-Lead QRS Voltage (mm)/Heart Weight (g) | Year of Publication | Authors (Reference Number) |
|---|---|---|---|---|---|---|---|---|---|
| Hearts weighing >1,000 g | M F | 16 1 | 29–64 (42) 20 | 140–414 (306) 601 | 16 (94%) | 1,005–1,360 (1,102) 1,250 | 0.28 0.48 | 1985 | Roberts and Podolak |
| Aortic valve stenosis | M | 36 | 16–64 (48) | 144–417 (249) | 47 | 440–880 (639) | 0.39 | 1982 | Siegel and Roberts |
| F | 14 | 16–65 (47) | 193–376 (277) | (94%) | 380–700 (521) | 0.53 | |||
| Aortic regurgitation | M | 22 | 19–59 (44) | 109–428 (271) | 27 | 430–1,100 (717) | 0.38 | 1985 | Roberts and Day |
| F | 8 | 35–56 (48) | 169–384 (275) | (90%) | 375–950 (638) | 0.43 | |||
| Mitral regurgitation | M | 11 | 24–84 (47) | 111–364 (245) | 17 | 400–775 (629) | 0.39 | 1992 | Glick and Roberts |
| F | 13 | 21–64 (37) | 114–290 (199) | (71%) | 350–675 (472) | 0.42 | |||
| Hypertrophic cardiomyopathy without cardiac transplantation | M F | 21 36 | 14–68 (46) 19–87 (51) | 107–339 (190) 68–327 (201) | 30 (53%) | 325–1,070 (671) 290–1,230 (547) | 0.28 0.38 | 1989 | Dollar and Roberts |
| Hypertrophic cardiomyopathy with cardiac transplantation | M F | 6 4 | 19–46 (35) 24–45 (35) | 109–201 (142) 172–378 (241) | 4 (40%) | 310–480 (393) 290–650 (408) | 0.36 0.59 | 1993 | Shirani et al |
| Idiopathic dilated cardiomyopathy | M F | 35 14 | 19–73 (46) 22–75 (54) | 74–281 (147) 75–243 (167) | 20 (41%) | 400–940 (620) 400–860 (602) | 0.24 0.28 | 1987 | Roberts et al |
| Lipomatous hypertrophy of the atrial septum | M F | 12 16 | 48–84 (67) 59–83 (74) | 93–24 (140) 59–266 (124) | 3 (11%) | 410–795 (576) 330–680 (502) | 0.24 0.25 | 1993 | Shirani and Roberts |
| Carcinoid syndrome | |||||||||
| With carcinoid heart disease | M F | 11 8 | 39–72 (56) 28–64 (54) | 58–227 (120) 58–128 (84) | 2 (11%) | 220–480 (350) 200–290 (245) | 0.34 0.34 | 1985 | Ross and Roberts |
| Without carcinoid heart disease | M F | 10 5 | 42–75 (55) 28–67 (50) | 89–129 (137) 102–135 (121) | 2 (13%) | 240–570 (350) 150–270 (230) | 0.39 0.53 | ||
| Cardiac amyloidosis | M | 15 | 32–69 (52) | 60–197 (99) | 2 | 410–850 (570) | 0.17 | 1983 | Roberts and Waller |
| F | 15 | 21–93 (69) | 58–199 (109) | (7%) | 370–900 (494) | 0.22 | |||
| Cardiac adiposity | M | 13 | 51–73 (64) | 73–159 (114) | 1 (3%) | 320–795 (485) | 0.24 | 1995 | Shirani et al |
| F | 17 | 40–85 (70) | 77–210 (124) | 250–575 (395) | 0.31 |
Means, SDs, and percentages were calculated to describe the study cohort (n = 359). A multivariate linear regression model was used to assess the adjusted association between patients’ heart weight (grams) and 12-lead QRS voltage (millimeters). Covariates included gender, age, and cardiac condition. Restricted cubic splines were used for all continuous variables. Adjusted p values and plots of the association between patient’s heart weight and 12-lead QRS voltage were also estimated.
Stay updated, free articles. Join our Telegram channel

Full access? Get Clinical Tree


