A lethal and extensively characterized familial form of hypertrophic cardiomyopathy (HC) is due to a point mutation (Arg403Gln) in the cardiac β-myosin heavy chain gene. Although this is associated with abnormal energy metabolism and progression to heart failure in an animal model, in vivo cardiac energetics have not been characterized in patients with this mutation. Noninvasive phosphorus saturation transfer magnetic resonance spectroscopy was used to measure the adenosine triphosphate supplied by the creatine kinase (CK) reaction and phosphocreatine, the heart’s primary energy reserve, in 9 of 10 patients from a single kindred with HC caused by the Arg403GIn mutation and 17 age-matched healthy controls. Systolic and diastolic function was assessed by echocardiography in all 10 patients with HC. The patients with HC had impairment of diastolic function and mild systolic dysfunction, when assessed using global systolic longitudinal strain. Myocardial phosphocreatine was significantly decreased by 24% in patients (7.1 ± 2.3 μmol/g) compared with the controls (9.4 ± 1.2 μmol/g; p = 0.003). The pseudo-first-order CK rate-constant was 26% lower (0.28 ± 0.15 vs 0.38 ± 0.07 s −1 , p = 0.035) and the forward CK flux was 44% lower (2.0 ± 1.4 vs 3.6 ± 0.9 μmol/g/s, p = 0.001) than in the controls. The contractile abnormalities did not correlate with the metabolic indexes. In conclusion, myocardial phosphocreatine and CK-ATP delivery are significantly reduced in patients with HC caused by the Arg403Gln mutation, akin to previous results from mice with the same mutation. A lack of a relation between energetic and contractile abnormalities suggests the former result from the sarcomeric mutation and not a late consequence of mechanical dysfunction.
The myosin heavy chain Arg403Gln mutation has a clinically important phenotype of ventricular hypertrophy, heart failure, arrhythmias, and sudden death. Because the murine Arg403Gln model manifests an increased energetic cost of contraction, we report the first noninvasive energetic phosphorus ( 31 P) magnetic resonance spectroscopy study of cardiac creatine kinase (CK) metabolite concentrations and adenosine triphosphate (ATP) kinetics in patients from a single family whose affected members carry this mutation. We used 31 P magnetic resonance spectroscopy with saturation transfer in a single examination to test the hypothesis that patients with the Arg403Gln mutation and hypertrophy who are at risk of developing heart failure, exhibit energetic changes consistent with an increased energetic cost of contraction (reduced cardiac creatine phosphate, preserved ATP, and decreased free energy of ATP hydrolysis), analogous to that observed in the myosin heavy chain Arg403Gln murine model. We also tested whether the ATP energy supply through CK is reduced in these patients, such as has been observed in other cardiomyopathies.
Methods
The Johns Hopkins institutional review board on human investigation approved all studies, and all subjects provided informed written consent. We examined 10 patients with a clinical history of hypertrophic cardiomyopathy (HC) from a single family (4 men and 6 women, mean age 40 ± 13 years), confirmed as carrying a missense Arg-403 to glutamine mutation in the β-myosin heavy chain gene. All 10 patients with HC underwent echocardiography, but only 9 patients underwent magnetic resonance spectroscopy as one patient was claustrophobic. The 10 patients had no history of hypertension, chest pain, coronary disease, or diabetes and were classified according to New York Heart Association functional class at imaging. A total of 17 healthy subjects (12 men and 5 women, mean age 40 ± 8 years) with no history of heart disease, hypertension, or diabetes served as controls for the magnetic resonance spectroscopy studies.
We used the same magnetic resonance protocol as described previously. A total of 9 patients with HC and all 17 controls underwent magnetic resonance spectroscopy. Image-guided 31 P magnetic resonance spectroscopy was performed using a 1.5-T General Electric Signa magnetic resonance scanner (GE Medical Systems, Milwaukee, Wisconsin). In brief, the patient cardiac protocol consisted of the following steps:
- 1.
Conventional scout proton ( 1 H) magnetic resonance imaging acquired with the body coil of the scanner to position the anterior myocardium over the coil and for shimming;
- 2.
Acquisition of 4 31 P 4-angle saturation transfer data sets localized by 1-dimensional chemical shift imaging to measure CK flux ;
- 3.
Acquisition of a fifth 31 P 1-dimensional chemical shift imaging set with saturation turned off for phosphate metabolite quantification and “spillover” correction ;
- 4.
Acquisition of a sixth 1 H 1-dimensional chemical shift imaging data set using the 31 P coil to provide a water concentration reference for metabolite quantification ;
- 5.
Repetition of the 1-dimensional chemical shift imaging acquisitions of steps 3 and 4 under fully relaxed conditions from a 0.15 mol/L inorganic phosphate reference phantom to determine the metabolite concentrations.
The pseudo-first-order CK reaction rate constant k f was determined from the ratio of the peak heights of phosphocreatine (PCr) acquired in step 2, from the spillover-corrected equation 11 of the study by Gabr et al and as described in the “Online Methods” in the study by Hirsch et al. The myocardial phosphocreatine and ATP concentrations, [PCr] and [ATP], were determined from data generated in steps 3 to 5, as previously described. The forward CK flux or unidirectional CK ATP synthesis rate, is given by the product, k f [PCr], in μmol/g wet weight/s. The free energy of ATP hydrolysis (−ΔG ∼ATP , kJ/mol) was determined as described by Gibbs, with conservative assumptions of an inorganic phosphate concentration of ∼1 μmol/g wet weight in control subjects and patients with HC. The cytosolic adenosine diphosphate (ADP) concentration was calculated as described previously.
All 10 patients with HC underwent conventional transthoracic and tissue Doppler echocardiography. A standard parasternal long-axis view, 4-, 2-, and 3-chamber apical views, and a midventricular short-axis view were obtained at end-expiration using a 3.5-MHz transducer (Vivid 7, General Electric Vingmed Ultrasound, Milwaukee, Wisconsin) at a frame rate of 40 to 70 frames/s for B-mode images. Mitral inflow was evaluated in the apical 4-chamber views by sampling 1- to 2-mm volumes at the tips of the mitral leaflets with pulsed Doppler to assess left ventricular diastolic function. The left ventricular outflow tract was also evaluated using pulsed Doppler, from apical chamber views, with sample volumes placed just proximal to the aortic valve. Tissue Doppler images were obtained in apical projections, including narrow-sector images with a minimum frame rate of 200 frames/s.
Off-line analysis was performed using Echopac software, version 7.1.1 (GE Medical Systems, Milwaukee, Wisconsin) to determine the left ventricular dimensions and volumes. The left ventricular mass was calculated using the Penn formula, and the ejection fraction was calculated using the biplane-modified Simpsons method. Conventional indexes of diastolic function such as mitral early (E) and late (A) diastolic flow velocities and ratio (E/A), and deceleration time were measured from the mitral inflow pulsed-Doppler recordings. The deceleration time was measured by extending the deceleration slope from the peak early wave velocity to the zero-velocity baseline.
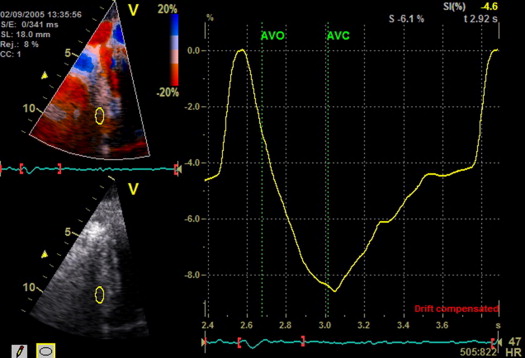
Myocardial longitudinal strain was derived from the tissue velocity data. Before analysis, the left ventricular ejection timing was measured from the left ventricular outflow track pulsed-Doppler recordings. Using narrow-sector tissue Doppler images, color-coded velocity analysis was performed with 12 × 6-mm sample volumes at the septal annulus to measure the mitral annular early diastolic tissue velocity. Sample volumes placed at the basal and midsegments of the anterior and inferior septum, and the lateral, posterior, anterior, and inferior left ventricular walls were used to assess regional tissue velocities, longitudinal strain rate, and longitudinal strain. The peak negative global longitudinal strain was taken as the average of the 12-segment peak negative regional longitudinal strain within the entire cardiac cycle. Measurements were obtained from 3 cardiac cycles, excluding segments corrupted by reverberations, drop outs, and/or poor alignment with Doppler signals (≥20° angle of insonation).
Continuous variables are presented as the mean ± SD, and categorical variables are expressed as numbers and percentages. The study groups were compared using an unpaired t test and Fisher’s exact test for continuous and categorical variables, respectively. Univariate and multivariate linear regression analyses were performed to test the association of New York Heart Association class, E/Ea, left ventricular mass, peak global longitudinal strain, brain natriuretic peptide with 31 P metabolic measures of [PCr], k f , and CK flux. A p value of <0.05 was considered significant.
Results
The baseline demographics are listed in Table 1 . Despite being from the same family and carrying the same mutation, the New York Heart Association class varied among the patients with HC: 8 patients were class I, 1 patient was class II, and 1 patient was class III. Of the 10 patients, 4 had severe septal hypertrophy (maximum septal wall thickness >2.0 cm), 3 had moderate septal hypertrophy (maximum septal wall thickness >1.2 to 1.5 cm), and 3 had normal septal thickness. The left ventricular dimensions and ejection fraction were within the normal range in all patients, except 1 patient, who had a moderately reduced ejection fraction ( Table 1 ).
| Age (yrs) | Gender | NYHA Class | VS (cm) | PWT (cm) | LVIDd (cm) | LVIDs (cm) | LVEF (%) | NYHA Class at Follow-Up |
|---|---|---|---|---|---|---|---|---|
| 22 | Male | I | 1.5 | 1.0 | 5.4 | 3.6 | 62 | I |
| 29 | Male | I | 1.2 | 1.2 | 5.2 | 3.3 | 69 | I |
| 33 | Female | I | 1.3 | 0.9 | 5.4 | 3.2 | 54 | I |
| 34 | Female | I | 1.1 | 0.8 | 4.1 | 2.8 | 66 | I |
| 43 | Male | I | 1.2 | 1.0 | 5.6 | 3.8 | 65 | I |
| 50 | Male | I | 1.4 | 0.8 | 5.3 | 3.9 | 56 | I |
| 52 | Female | II | 2.3 | 1.1 | 4.2 | 2.9 | 58 | III |
| 52 | Male | I | 2.1 | 1.0 | 3.7 | 2.4 | 65 | I |
| 57 | Female | I | 2.2 | 1.2 | 4.1 | 2.6 | 61 | II |
| 62 | Female | III | 2.0 | 1.2 | 5.4 | 3.9 | 37 | Transplant |
The patients with HC had increased diastolic septal wall thickness and left ventricular mass in the setting of a normal diastolic posterior wall thickness, indicating asymmetric septal hypertrophy ( Table 1 ). The left ventricular systolic and diastolic volumes and ejection fraction were normal. However, the peak global longitudinal strain was mildly reduced (p <0.001) compared with historical controls, indicating systolic dysfunction. Evidence was found of global diastolic dysfunction, as indicated by a reduced mitral E/A ratio and mitral annular tissue velocity ( Table 1 ). The E/Ea ratio was increased (15 ± 6), suggesting an elevated left ventricular filling pressure. Figure 1 shows representative strain curves from 1 patient with HC.
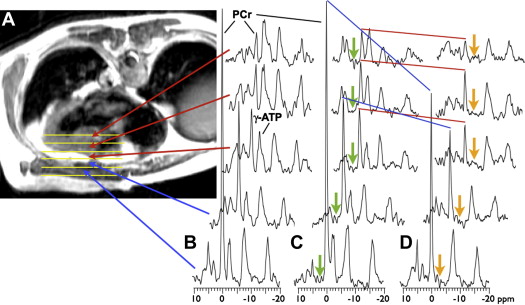
Representative, image-guided, spatially localized, cardiac 31 P 4-angle saturation transfer spectra from a 52-year-old male patient with HC, who was New York Heart Association class I, are shown in Figure 2 . Spectra from the chest wall exhibited a high PCr to ATP ratio owing to the higher concentration of PCr in the skeletal muscle (∼25 μmol/g) compared with that of the heart (≤10 μmol/g). The peak areas ( Figure 2 ) are proportional to the metabolite concentrations, which are determined after calibration. Application of saturation at control and γ-ATP locations ( Figure 2 ) resulted in a reduction in the PCr signal in direct proportion to the forward CK rate constant, k f . In this subject, the k f was lower in the heart at 0.13/s than in the chest muscle at 0.23/s.
The 31 P magnetic resonance spectroscopy results from all subjects are summarized in Table 2 . Of the myocardial metabolite pool sizes, [PCr] was significantly decreased by approximately 24% in patients with HC compared with that in the control subjects (p = 0.003; Table 2 ). However, owing to a downward trend in [ATP] in the patients with HC (p = 0.10), a corresponding 16% reduction in the PCr to ATP ratio was not statistically significant (p = 0.054). The mean pseudo-first-order rate-constant for the CK reaction, k f , was reduced 26% in those with HC compared with that in the control subjects (p = 0.035). This, combined with the [PCr] reduction, resulted in a highly significant 44% decrease in the forward flux of myocardial ATP generated by the CK reaction in patients with HC compared with controls (p = 0.001). No significant correlations were found between the 31 P metabolic measures and New York Heart Association class, the ratio of early diastolic mitral inflow velocity to that of the mitral annulus, left ventricular mass, peak global longitudinal strain, or brain naturetic peptide. The individual [PCr], k f , and CK flux measurements for all subjects are plotted in Figure 3 .


