ELECTROCARDIOGRAPHY
An electrocardiogram (ECG or EKG) is a graphic recording of electric potentials generated by the heart. The signals are detected by means of metal electrodes attached to the extremities and chest wall and then are amplified and recorded by the electrocardiograph. ECG leads actually display the instantaneous differences in potential between the electrodes.
The clinical utility of the ECG derives from its immediate availability as a noninvasive, inexpensive, and highly versatile test. In addition to its use in detecting arrhythmias, conduction disturbances, and myocardial ischemia, electrocardiography may reveal other findings related to life-threatening metabolic disturbances (e.g., hyperkalemia) or increased susceptibility to sudden cardiac death (e.g., QT prolongation syndromes).
ELECTROPHYSIOLOGY
(See also Chaps. 15 and 16) Depolarization of the heart is the initiating event for cardiac contraction. The electric currents that spread through the heart are produced by three components: cardiac pacemaker cells, specialized conduction tissue, and the heart muscle itself. The ECG, however, records only the depolarization (stimulation) and repolarization (recovery) potentials generated by the atrial and ventricular myocardium.
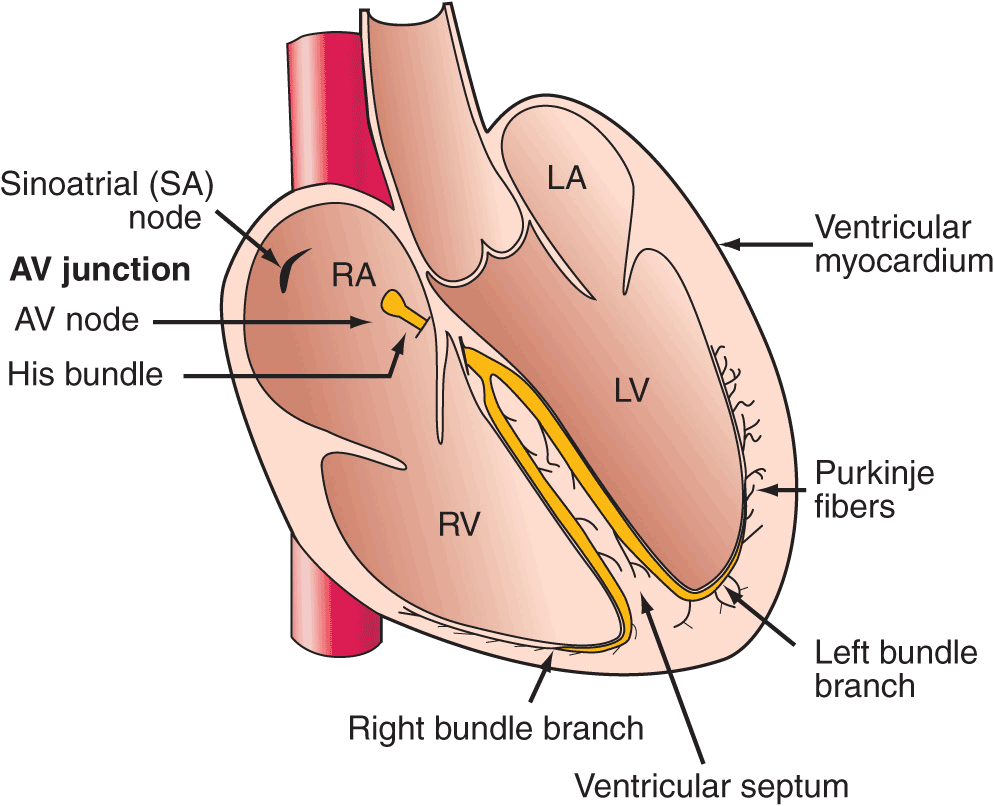
The depolarization stimulus for the normal heartbeat originates in the sinoatrial (SA) node (Fig. 11-1), or sinus node, a collection of pacemaker cells. These cells fire spontaneously; that is, they exhibit automaticity. The first phase of cardiac electrical activation is the spread of the depolarization wave through the right and left atria, followed by atrial contraction. Next, the impulse stimulates pacemaker and specialized conduction tissues in the atrioventricular (AV) nodal and His-bundle areas; together, these two regions constitute the AV junction. The bundle of His bifurcates into two main branches, the right and left bundles, which rapidly transmit depolarization wave fronts to the right and left ventricular myocardium by way of Purkinje fibers. The main left bundle bifurcates into two primary subdivisions: a left anterior fascicle and a left posterior fascicle. The depolarization wave fronts then spread through the ventricular wall, from endocardium to epicardium, triggering ventricular contraction.
FIGURE 11-1
Schematic of the cardiac conduction system.
Since the cardiac depolarization and repolarization waves have direction and magnitude, they can be represented by vectors. Vector analysis illustrates a central concept of electrocardiography: The ECG records the complex spatial and temporal summation of electrical potentials from multiple myocardial fibers conducted to the surface of the body. This principle accounts for inherent limitations in both ECG sensitivity (activity from certain cardiac regions may be canceled out or may be too weak to be recorded) and specificity (the same vectorial sum can result from either a selective gain or a loss of forces in opposite directions).
ECG WAVEFORMS AND INTERVALS
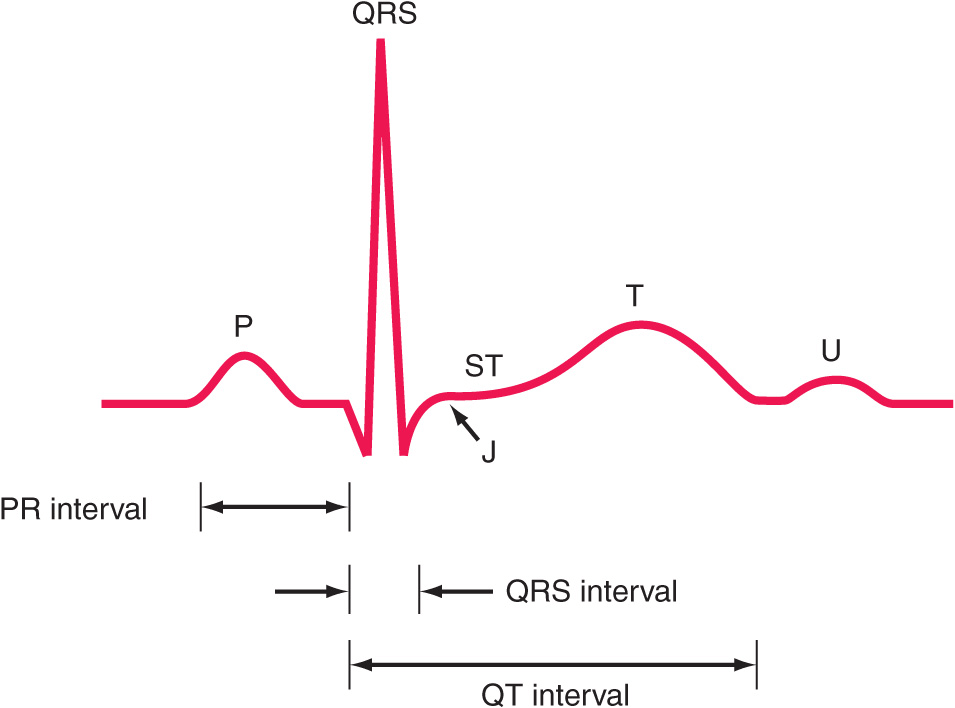
The ECG waveforms are labeled alphabetically, beginning with the P wave, which represents atrial depolarization (Fig. 11-2). The QRS complex represents ventricular depolarization, and the ST-T-U complex (ST segment, T wave, and U wave) represents ventricular repolarization. The J point is the junction between the end of the QRS complex and the beginning of the ST segment. Atrial repolarization is usually too low in amplitude to be detected, but it may become apparent in conditions such as acute pericarditis and atrial infarction.
The QRS-T waveforms of the surface ECG correspond in a general way with the different phases of simultaneously obtained ventricular action potentials, the intracellular recordings from single myocardial fibers (Chap. 15). The rapid upstroke (phase 0) of the action potential corresponds to the onset of QRS. The plateau (phase 2) corresponds to the isoelectric ST segment, and active repolarization (phase 3) corresponds to the inscription of the T wave. Factors that decrease the slope of phase 0 by impairing the influx of Na+ (e.g., hyperkalemia and drugs such as flecainide) tend to increase QRS duration. Conditions that prolong phase 2 (amiodarone, hypocalcemia) increase the QT interval. In contrast, shortening of ventricular repolarization (phase 2), such as by digitalis administration or hypercalcemia, abbreviates the ST segment.
The electrocardiogram ordinarily is recorded on special graph paper that is divided into 1-mm2 grid-like boxes. Since the ECG paper speed is generally 25 mm/s, the smallest (1 mm) horizontal divisions correspond to 0.04 (40 ms), with heavier lines at intervals of 0.20 s (200 ms). Vertically, the ECG graph measures the amplitude of a specific wave or deflection (1 mV = 10 mm with standard calibration; the voltage criteria for hypertrophy mentioned below are given in millimeters). There are four major ECG intervals: R-R, PR, QRS, and QT (Fig. 11-2). The heart rate (beats per minute) can be computed readily from the interbeat (R-R) interval by dividing the number of large (0.20 s) time units between consecutive R waves into 300 or the number of small (0.04 s) units into 1500. The PR interval measures the time (normally 120–200 ms) between atrial and ventricular depolarization, which includes the physiologic delay imposed by stimulation of cells in the AV junction area. The QRS interval (normally 100–110 ms or less) reflects the duration of ventricular depolarization. The QT interval includes both ventricular depolarization and repolarization times and varies inversely with the heart rate. A rate-related (“corrected”) QT interval, QTc, can be calculated as QT/√R-R and normally is ≤0.44 s. (Some references give QTc upper normal limits as 0.43 s in men and 0.45 s in women. Also, a number of different formulas have been proposed, without consensus, for calculating the QTc.)
FIGURE 11-2
Basic ECG waveforms and intervals. Not shown is the R-R interval, the time between consecutive QRS complexes.
The QRS complex is subdivided into specific deflections or waves. If the initial QRS deflection in a particular lead is negative, it is termed a Q wave; the first positive deflection is termed an R wave. A negative deflection after an R wave is an S wave. Subsequent positive or negative waves are labeled R′ and S′, respectively. Lowercase letters (qrs) are used for waves of relatively small amplitude. An entirely negative QRS complex is termed a QS wave.
ECG LEADS
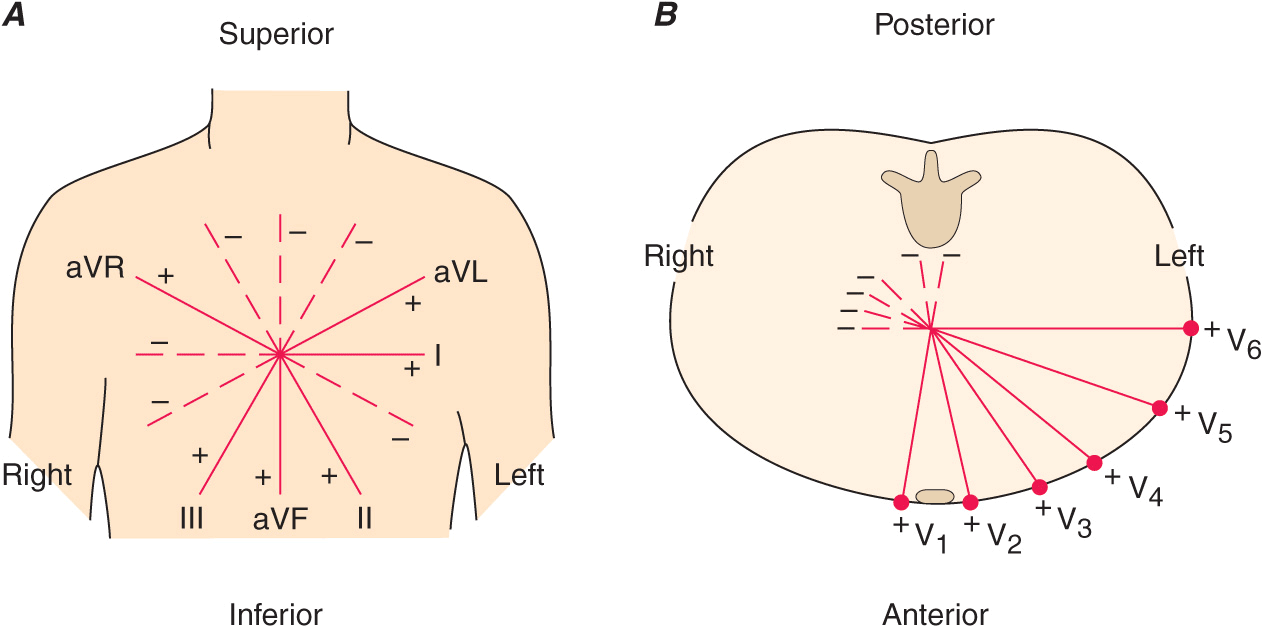
The 12 conventional ECG leads record the difference in potential between electrodes placed on the surface of the body. These leads are divided into two groups: six limb (extremity) leads and six chest (precordial) leads. The limb leads record potentials transmitted onto the frontal plane (Fig. 11-3A), and the chest leads record potentials transmitted onto the horizontal plane (Fig. 11-3B).
FIGURE 11-3
The six frontal plane (A) and six horizontal plane (B) leads provide a three-dimensional representation of cardiac electrical activity.
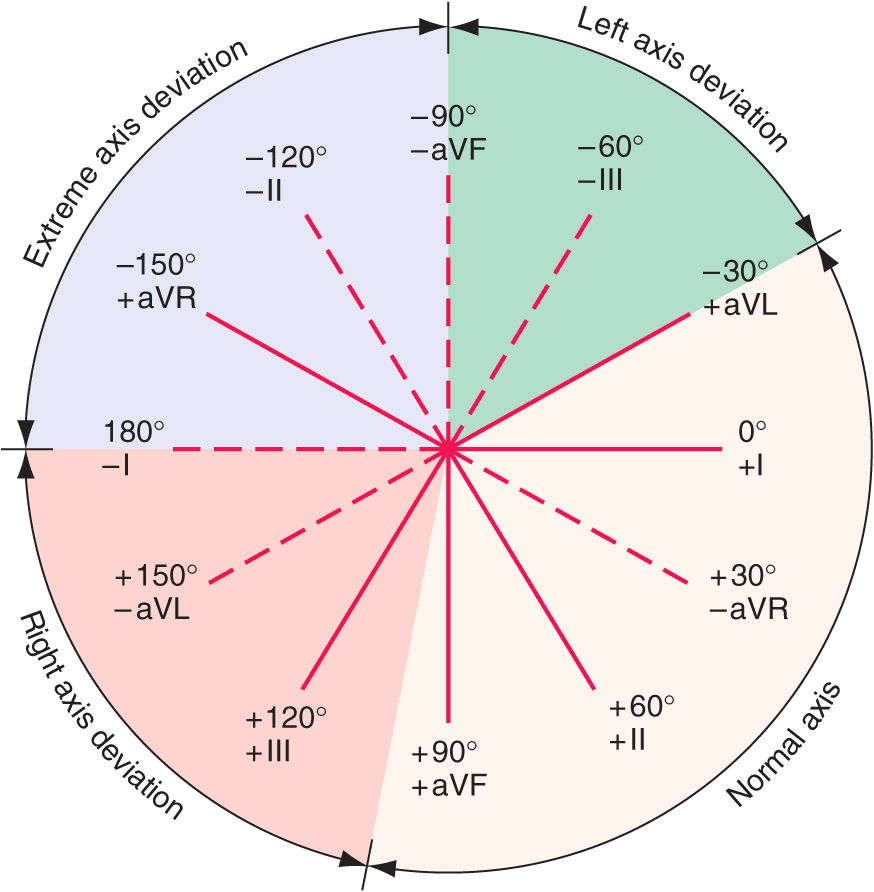
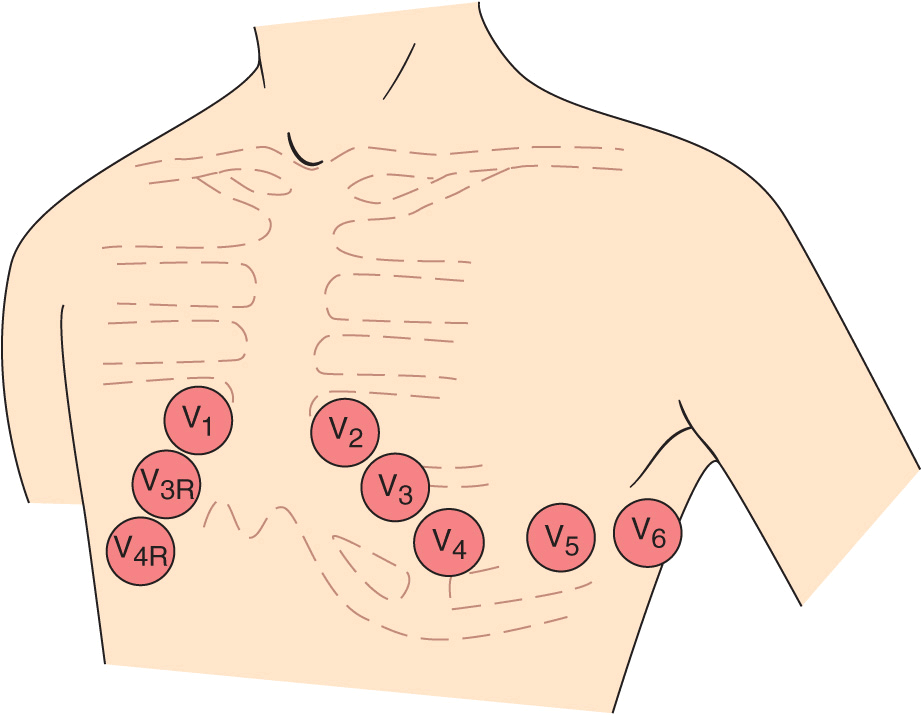
The spatial orientation and polarity of the six frontal plane leads is represented on the hexaxial diagram (Fig. 11-4). The six chest leads (Fig. 11-5) are unipolar recordings obtained by electrodes in the following positions: lead V1, fourth intercostal space, just to the right of the sternum; lead V2, fourth intercostal space, just to the left of the sternum; lead V3, midway between V2 and V4; lead V4, midclavicular line, fifth intercostal space; lead V5, anterior axillary line, same level as V4; and lead V6, midaxillary line, same level as V4 and V5.
FIGURE 11-4
The frontal plane (limb or extremity) leads are represented on a hexaxial diagram. Each ECG lead has a specific spatial orientation and polarity. The positive pole of each lead axis (solid line) and the negative pole (hatched line) are designated by their angular position relative to the positive pole of lead I (0°). The mean electrical axis of the QRS complex is measured with respect to this display.
FIGURE 11-5
The horizontal plane (chest or precordial) leads are obtained with electrodes in the locations shown.
Together, the frontal and horizontal plane electrodes provide a three-dimensional representation of cardiac electrical activity. Each lead can be likened to a different video camera angle “looking” at the same events—atrial and ventricular depolarization and repolarization—from different spatial orientations. The conventional 12-lead ECG can be supplemented with additional leads in special circumstances. For example, right precordial leads V3R, V4R, etc., are useful in detecting evidence of acute right ventricular ischemia. Bedside monitors and ambulatory ECG (Holter) recordings usually employ only one or two modified leads. Intracardiac electrocardiography and electrophysiologic testing are discussed in Chaps. 15 and 16.
The ECG leads are configured so that a positive (upright) deflection is recorded in a lead if a wave of depolarization spreads toward the positive pole of that lead, and a negative deflection is recorded if the wave spreads toward the negative pole. If the mean orientation of the depolarization vector is at right angles to a particular lead axis, a biphasic (equally positive and negative) deflection will be recorded.
GENESIS OF THE NORMAL ECG
P WAVE
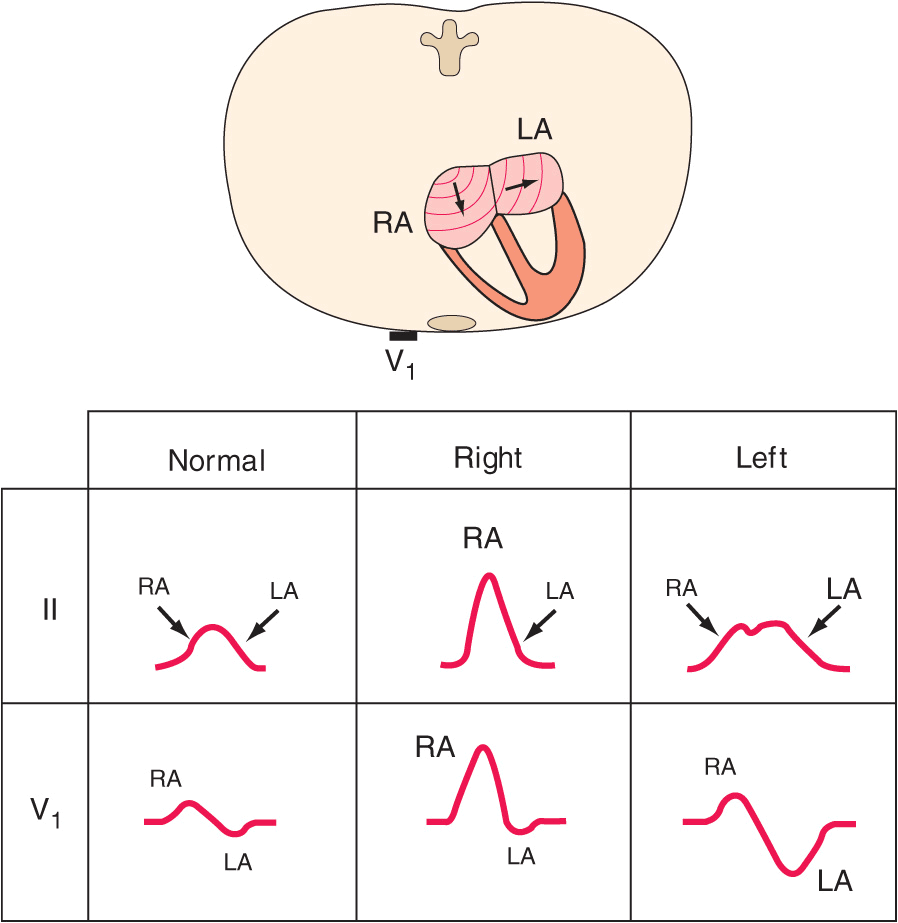
The normal atrial depolarization vector is oriented downward and toward the subject’s left, reflecting the spread of depolarization from the sinus node to the right and then the left atrial myocardium. Since this vector points toward the positive pole of lead II and toward the negative pole of lead aVR, the normal P wave will be positive in lead II and negative in lead aVR. By contrast, activation of the atria from an ectopic pacemaker in the lower part of either atrium or in the AV junction region may produce retrograde P waves (negative in lead II, positive in lead aVR). The normal P wave in lead V1 may be biphasic with a positive component reflecting right atrial depolarization, followed by a small (<1 mm2) negative component reflecting left atrial depolarization.
QRS COMPLEX
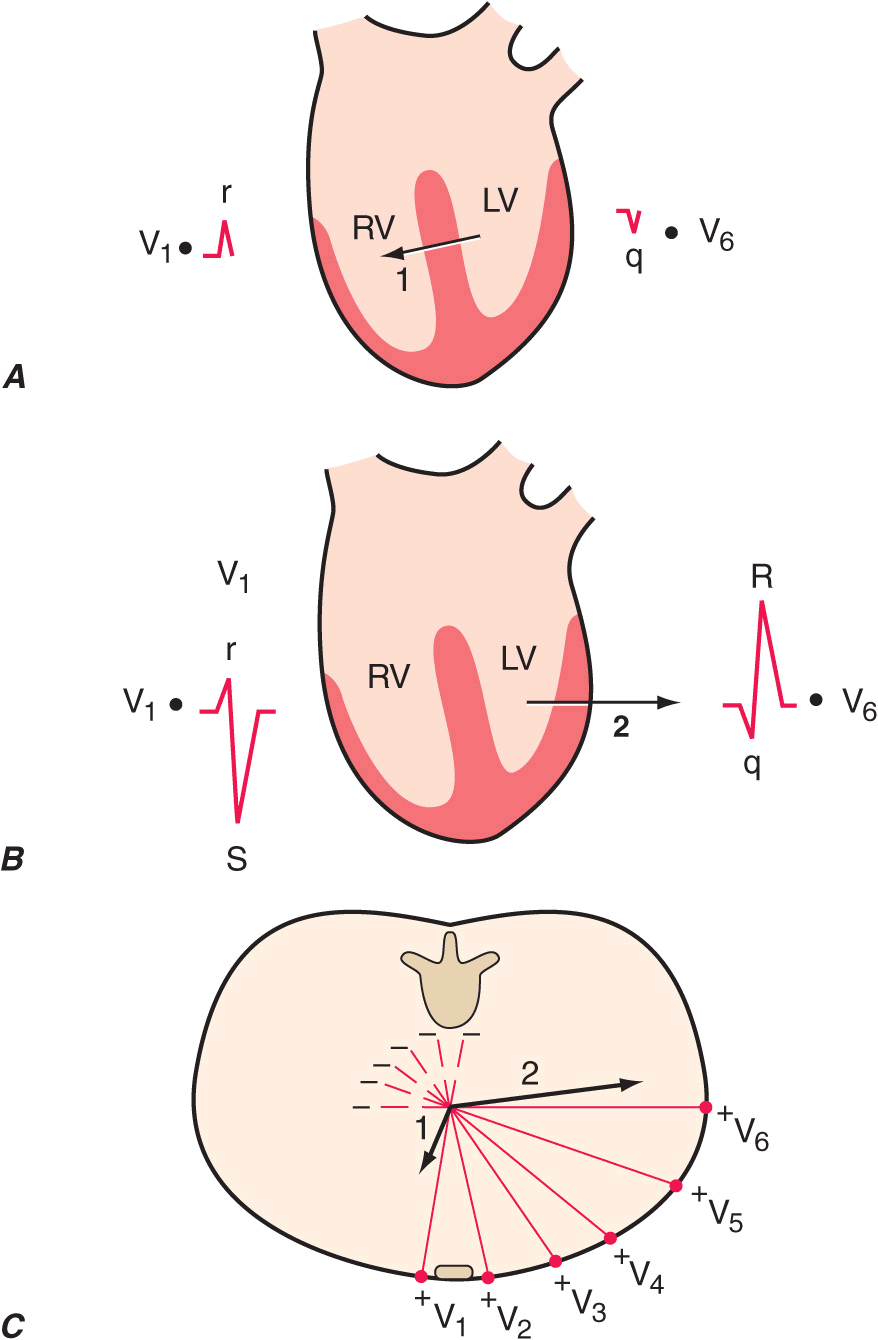
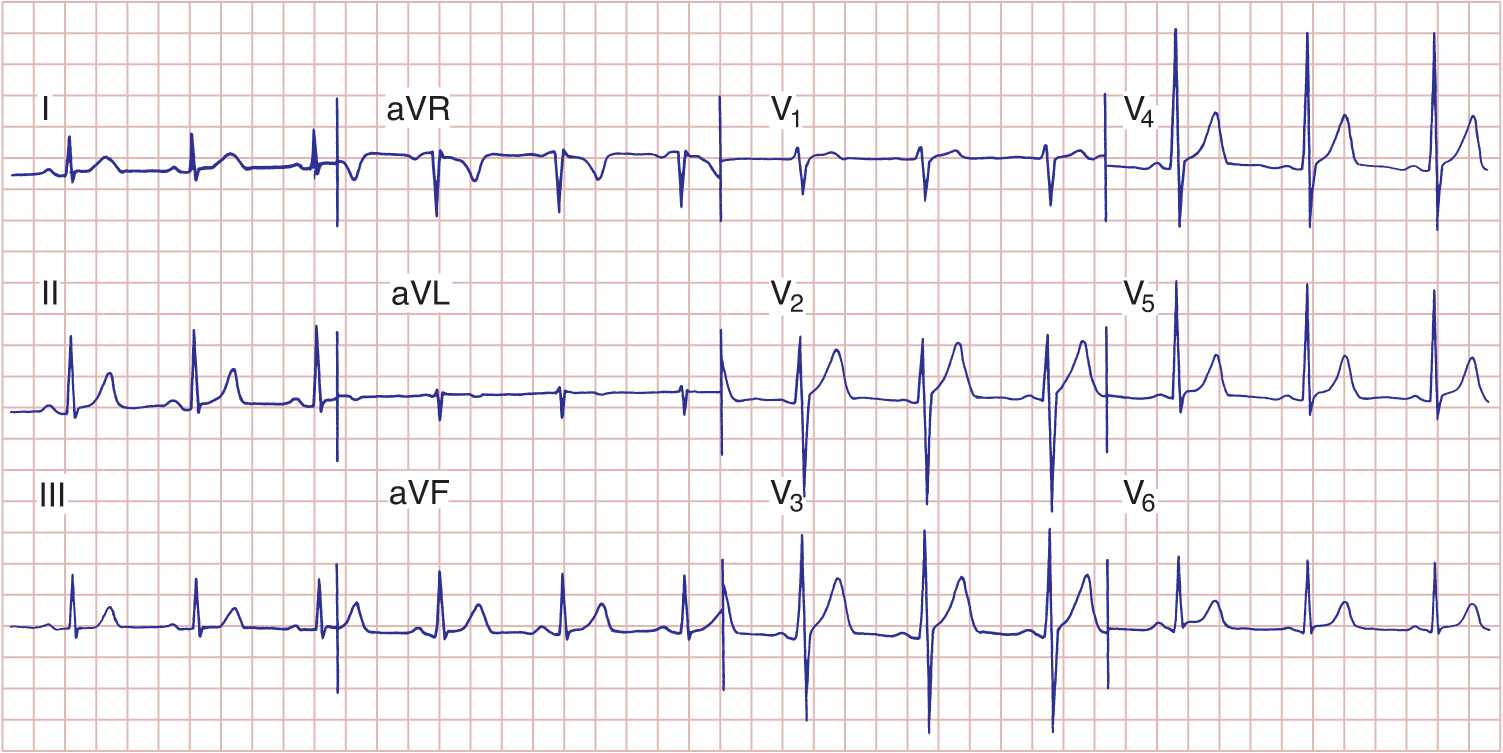
Normal ventricular depolarization proceeds as a rapid, continuous spread of activation wave fronts. This complex process can be divided into two major sequential phases, and each phase can be represented by a mean vector (Fig. 11-6). The first phase is depolarization of the interventricular septum from the left to the right and anteriorly (vector 1). The second results from the simultaneous depolarization of the right and left ventricles; it normally is dominated by the more massive left ventricle, so that vector 2 points leftward and posteriorly. Therefore, a right precordial lead (V1) will record this biphasic depolarization process with a small positive deflection (septal r wave) followed by a larger negative deflection (S wave). A left precordial lead, e.g., V6, will record the same sequence with a small negative deflection (septal q wave) followed by a relatively tall positive deflection (R wave). Intermediate leads show a relative increase in R-wave amplitude (normal R-wave progression) and a decrease in S-wave amplitude progressing across the chest from right to left. The precordial lead where the R and S waves are of approximately equal amplitude is referred to as the transition zone (usually V3 or V4) (Fig. 11-7).
FIGURE 11-6
Ventricular depolarization can be divided into two major phases, each represented by a vector. A. The first phase (arrow 1) denotes depolarization of the ventricular septum, beginning on the left side and spreading to the right. This process is represented by a small “septal” r wave in lead V1 and a small septal q wave in lead V6. B. Simultaneous depolarization of the left and right ventricles (LV and RV) constitutes the second phase. Vector 2 is oriented to the left and posteriorly, reflecting the electrical predominance of the LV. C. Vectors (arrows) representing these two phases are shown in reference to the horizontal plane leads. (After AL Goldberger: Clinical Electrocardiography: A Simplified Approach, 8th ed. Philadelphia, Elsevier/Saunders, 2013.)
FIGURE 11-7
Normal electrocardiogram from a healthy subject. Sinus rhythm is present with a heart rate of 75 beats per minute. PR interval is 0.16 s; QRS interval (duration) is 0.08 s; QT interval is 0.36 s; QTc is 0.40 s; the mean QRS axis is about +70°. The precordial leads show normal R-wave progression with the transition zone (R wave = S wave) in lead V3.
The QRS pattern in the extremity leads may vary considerably from one normal subject to another depending on the electrical axis of the QRS, which describes the mean orientation of the QRS vector with reference to the six frontal plane leads. Normally, the QRS axis ranges from –30° to +100° (Fig. 11-4). An axis more negative than –30° is referred to as left axis deviation, and an axis more positive than +100° is referred to as right axis deviation. Left axis deviation may occur as a normal variant but is more commonly associated with left ventricular hypertrophy, a block in the anterior fascicle of the left bundle system (left anterior fascicular block or hemiblock), or inferior myocardial infarction. Right axis deviation also may occur as a normal variant (particularly in children and young adults), as a spurious finding due to reversal of the left and right arm electrodes, or in conditions such as right ventricular overload (acute or chronic), infarction of the lateral wall of the left ventricle, dextrocardia, left pneumothorax, and left posterior fascicular block.
T WAVE AND U WAVE
Normally, the mean T-wave vector is oriented roughly concordant with the mean QRS vector (within about 45° in the frontal plane). Since depolarization and repolarization are electrically opposite processes, this normal QRS–T-wave vector concordance indicates that repolarization normally must proceed in the reverse direction from depolarization (i.e., from ventricular epicardium to endocardium). The normal U wave is a small, rounded deflection (≤1 mm) that follows the T wave and usually has the same polarity as the T wave. An abnormal increase in U-wave amplitude is most commonly due to drugs (e.g., dofetilide, amiodarone, sotalol, quinidine, procainamide, disopyramide) or to hypokalemia. Very prominent U waves are a marker of increased susceptibility to the torsades de pointes type of ventricular tachycardia (Chap. 16). Inversion of the U wave in the precordial leads is abnormal and may be a subtle sign of ischemia.
MAJOR ECG ABNORMALITIES
CARDIAC ENLARGEMENT AND HYPERTROPHY
Right atrial overload (acute or chronic) may lead to an increase in P-wave amplitude (≥2.5 mm) (Fig. 11-8). Left atrial overload typically produces a biphasic P wave in V1 with a broad negative component or a broad (≥120 ms), often notched P wave in one or more limb leads (Fig. 11-8). This pattern may also occur with left atrial conduction delays in the absence of actual atrial enlargement, leading to the more general designation of left atrial abnormality.
Stay updated, free articles. Join our Telegram channel

Full access? Get Clinical Tree


