Left ventricular hypertrophy (LVH) diagnosed by electrocardiography (ECG-LVH) and echocardiography (echo-LVH) are independently associated with an increased risk of cardiovascular disease (CVD) events. However, it is unknown if ECG-LVH retains its predictive properties independent of LV anatomy. We compared the risk of CVD associated with ECG-LVH and echo-LVH in 4,076 participants (41% men, 86% white) from the Cardiovascular Health Study, who were free of baseline CVD. ECG-LVH was defined with Minnesota ECG Classification criteria from baseline ECG data. Echo-LVH was defined by gender-specific LV mass values normalized to body surface area (male: >102 g/m 2 ; female: >88 g/m 2 ). ECG-LVH was detected in 144 participants (3.5%) and echo-LVH in 430 participants (11%). Over a median follow-up of 10.6 years, 2,274 CVD events occurred. In a multivariate Cox regression analysis adjusted for common CVD risk factors, ECG-LVH (hazard ratio [HR] 1.84, 95% CI 1.51 to 2.24) and echo-LVH (HR 1.35, 95% CI 1.19 to 1.54) were associated with an increased risk for CVD events. The association between ECG-LVH and CVD events was not substantively altered with further adjustment for echo-LVH (HR 1.76, 95% CI 1.45 to 2.15). In conclusion, the association of ECG-LVH with CVD events is not dependent on echo-LVH. This finding provides support to the concept that ECG-LVH is an electrophysiological marker with predictive properties independent of LV anatomy.
Left ventricular hypertrophy (LVH) diagnosed by electrocardiography (ECG-LVH) and echocardiography (echo-LVH) have both been independently associated with an increased risk of cardiovascular disease (CVD) events. When combined with imaging methods, ECG-LVH has variable success in predicting CVD events after controlling for LVH. However, it is uncertain if the CVD risk associated with ECG-LVH is comparable to the risk associated with echo-LVH, and if ECG-LVH retains its predictive properties independent of LV anatomy. Therefore, we compared the predictive abilities of ECG-LVH and echo-LVH for future CVD events in the Cardiovascular Health Study (CHS) and also determined if the predictive abilities of ECG-LVH were dependent on LV mass (LVM).
Methods
Details of CHS have been previously described. Briefly, CHS is a prospective population-based cohort study of risk factors for coronary heart disease and stroke in subjects aged 65 years and older. A total of 5,888 participants with Medicare eligibility were recruited from 4 field centers located in the following locations in the United States: Forsyth County, North Carolina; Sacramento County, California; Washington County, Maryland; and Pittsburgh, Pennsylvania. Subjects were followed with semiannual contacts, alternating between telephone calls and surveillance clinic visits. CHS clinical examinations ended in June of 1999 and since that time, 2 yearly phone calls to participants were used to identify events and collect data. The institutional review board at each site approved the study, and written informed consent was obtained from participants at enrollment. Participants were excluded if any of the following criteria were met: baseline CVD was present, baseline covariate data were missing, QRS duration ≥120 ms, or follow-up data were missing. A total of 4,076 participants (41% men; 86% white) with complete baseline data were used in this analysis.
LVH was determined from the baseline electrocardiogram or echocardiogram. Identical electrocardiographs (MAC PC, Marquette Electronics Inc., Milwaukee, Wisconsin) were used at all clinic sites, and resting, 10-second standard simultaneous 12-lead ECGs were recorded in all participants. All ECGs were processed in a central laboratory (initially at Dalhousie University, Halifax, Nova Scotia, Canada and later at the Epidemiological Cardiology Research Center, Wake Forest School of Medicine, Winston-Salem, North Carolina). ECG-LVH was defined by Minnesota ECG Code 3. In a sensitivity analysis, we also used Cornell voltage LVH. A baseline echocardiogram was obtained for each study participant according to previously described techniques. All measurements were read at a central echo reading center. Measurements were made from digitized images using an offline image-analysis system equipped with customized computer algorithms. LVM was derived from standard formulas described by Devereux et al. Echo-LVH was defined by gender-specific LVM normalized to body surface area (male: >102 g/m 2 ; female: >88 g/m 2 ).
The ascertainment and adjudication of baseline and incident cases of CVD events in CHS have been previously described. For this analysis, CVD was defined as the development of the composite of the following events: coronary heart disease, stroke, and congestive heart failure. Adjudicated incident coronary heart disease events were defined as one of the following: fatal or nonfatal myocardial infarction, angina pectoris without myocardial infarction, coronary revascularization procedures (angioplasty and coronary artery bypass graft surgery), or other fatal coronary heart disease events. All suspected stroke events and stroke-related deaths were reviewed by the Cerebrovascular Adjudication Committee and included fatal and nonfatal events and subtypes classified as ischemic or hemorrhagic. Heart failure events were determined from both the physician diagnosis and/or treatment defined by a current prescription for typical therapies (e.g., diuretics, digitalis, and vasodilators). In addition, typical symptoms, signs, and chest x-ray findings of heart failure were reviewed by the CHS Events Committee. Probable and definite heart failure cases were included.
Participant characteristics were collected during the initial CHS interview and questionnaire. Age, gender, race, income, education, and smoking status were self-reported. Annual income was dichotomized at $25,000, and education was dichotomized at “high school or less.” Smoking was defined as current or ever smoker. Participants’ blood samples were obtained after a 12-hour fast at the local field center. Diabetes was defined as a self-reported history of a physician diagnosis, a fasting glucose value ≥126 mg/dl, or by the current use of insulin or oral hypoglycemic medications. Blood pressure was measured for each participant in the seated position, and systolic measurements were used in this analysis. The use of aspirin and antihypertensive medications were self-reported. Hypertension was defined as a baseline blood pressure ≥140/90 or by the use of antihypertensive medications. Body mass index was computed as the weight in kilograms divided by the square of the height in meters.
Categorical variables are reported as frequency and percentage, whereas continuous variables are recorded as mean ± SD. Statistical significance for categorical variables was tested using the chi-square method and the Student t test for continuous variables. Comparisons were examined between participants with and without ECG-LVH and echo-LVH, separately. We examined the association between ECG-LVH and echo-LVH at baseline with incident CVD events. Follow-up time was defined as the time from the initial study examination until one of the following: CVD development, death, loss to follow-up, or end of follow-up (December 31, 2010). Kaplan–Meier estimates were used to compute cumulative incidence of CVD by ECG-LVH and echo-LVH, and the differences in estimates were compared using the log-rank procedure. Cox regression was used to compute hazard ratios (HRs) and 95% CIs for the association between ECG-LVH and echo-LVH and incident CVD, separately. In addition, we examined the association of either ECG-LVH or echo-LVH to define LVH to determine the combined effect of both methods regarding CVD risk assessment. Multivariate models were constructed as follows: model 1 adjusted for age, gender, race, education, and income; model 2 adjusted for model 1 covariates plus body mass index, high-density lipoprotein cholesterol, total cholesterol, smoking, systolic blood pressure, diabetes, aspirin, and antihypertensive medications. To determine how much of the observed risk of CVD associated with ECG-LVH was explained by echo-LVH, we used a third model (model 3) with covariates from model 2 plus echo-LVH. A sensitivity analysis also was performed using covariates from model 2 and LVM as a continuous variable. The proportional hazards assumption was not violated in our analyses. Statistical significance was defined as p <0.05. SAS, version 9.3 (SAS Institute, Inc., Cary, North Carolina) was used for all analyses.
Results
ECG-LVH was detected in 144 participants (3.5%), and echo-LVH was present in 199 participants (4.9%). Forty-eight participants had both ECG-LVH and echo-LVH. Baseline characteristics stratified by ECG-LVH and echo-LVH are presented in Table 1 .
| Characteristic | ECG-LVH (n=144) | No ECG-LVH (n=3,932) | P-value ∗ | Echo-LVH (n=430) | No Echo-LVH (n=3,646) | P-value ∗ |
|---|---|---|---|---|---|---|
| Age (years) | ||||||
| 65-70 | 39 (27%) | 1,843 (47%) | 149 (35%) | 1,733 (48%) | ||
| 71-74 | 27 (19%) | 944 (24%) | 98 (23%) | 873 (24%) | ||
| 75-80 | 52 (36%) | 808 (21%) | 120 (28%) | 740 (20%) | ||
| >80 | 26 (18%) | 337 (8.0%) | <0.0001 | 63 (14%) | 300 (8.0%) | <0.0001 |
| Male | 59 (41%) | 1,492 (38%) | 0.46 | 101 (23%) | 1,450 (40%) | <0.0001 |
| White | 100 (69%) | 3,388 (86%) | <0.0001 | 398 (93%) | 3,090 (85%) | <0.0001 |
| High school or less | 82 (57%) | 2,213 (56%) | 0.87 | 272 (63%) | 2,023 (55%) | 0.0021 |
| Income <$25,000 | 102 (71%) | 2,435 (62%) | 0.030 | 298 (69%) | 2,239 (61%) | 0.0014 |
| Ever smoker | 67 (47%) | 2,063 (52%) | 0.16 | 173 (40%) | 1,957 (54%) | <0.0001 |
| Diabetes mellitus | 22 (15%) | 532 (14%) | 0.54 | 95 (22%) | 459 (13%) | <0.0001 |
| Body mass index (mean ± SD, kg/m 2 ) | 26 ± 3.7 | 26 ± 4.1 | 0.97 | 28 ± 4.1 | 26 ± 4.0 | <0.0001 |
| Systolic blood pressure (mean ± SD, mm Hg | 154 ± 23 | 138 ± 20 | <0.0001 | 146 ± 20 | 138 ± 20 | <0.0001 |
| Total cholesterol (mean ± SD, mg/dL) | 209 ± 38 | 213 ± 39 | 0.30 | 215 ± 40 | 212 ± 39 | 0.081 |
| HDL cholesterol (mean ± SD, mg/dL) | 56 ± 16 | 56 ± 16 | 0.93 | 54 ± 15 | 56 ± 16 | 0.020 |
| Hypertension | 125 (87%) | 2,435 (62%) | <0.0001 | 344 (80%) | 2,216 (61%) | <0.0001 |
| Antihypertensive medication use | 94 (65%) | 1,486 (38%) | <0.0001 | 235 (55%) | 1,345 (37%) | <0.0001 |
| Aspirin use | 49 (34%) | 1,105 (28%) | 0.12 | 127 (30%) | 1,027 (28%) | 0.55 |
∗ Statistical significance for continuous data was tested using the Student t test and categorical data were tested using the chi-square test.
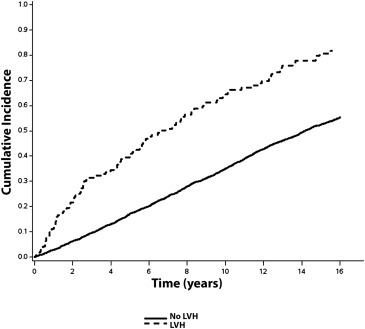
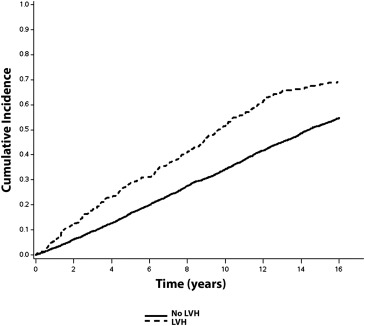
Over a median follow-up of 10.6 years, a total of 2,274 (56%; incidence = 50.0 per 1,000 person-years) CVD events occurred. CVD events occurred. CVD events were more common in subjects with ECG-LVH (incidence = 108.2 per 1,000 person-years) and echo-LVH (incidence = 75.8 per 1,000 person-years) compared with those without LVH. The unadjusted cumulative incidence curves of CVD events by ECG-LVH and echo-LVH are shown in Figures 1 and 2 , respectively.
In a multivariate Cox regression analysis, ECG-LVH and echo-LVH were associated with an increased risk for CVD events ( Table 2 ). The association between ECG-LVH and CVD events was not materially altered after inclusion of echo-LVH in the model ( Table 2 ). A similar result was observed with LVM as a continuous variable (HR 1.74, 95% CI 1.42 to 2.13).


