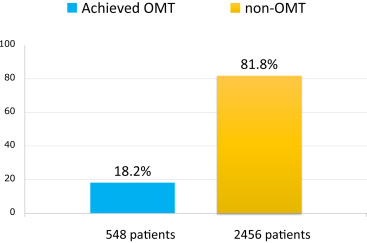
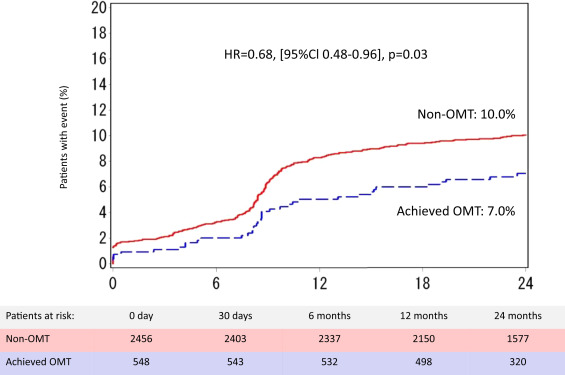
It has not been established whether the achievement of optimal medical therapy (OMT) before implantation of a drug-eluting stent has a clinical benefit for patients with stable coronary artery disease (CAD). This study included 3,004 patients with CAD treated with drug-eluting stent from 123 Japanese participating centers. The achievement of OMT was defined as control of blood pressure <130/80 mm Hg, hemoglobin A1c <7.0%, and low-density lipoprotein cholesterol <100 mg/dl. The primary end point was target vessel failure, a composite of death related to the target vessel, myocardial infarction, or clinically driven revascularization at 24 months after stent implantation. Immediately before the procedure, only 548 patients (18.2%) had achieved all 3 target criteria (the achieved OMT group), whereas the remaining 2,456 patients failed to achieve one or more criteria (the non-OMT group). At 24 months, the incidence of target vessel failure was 7.0% in the achieved OMT group versus 10.0% in the non-OMT group (hazard ratio 0.68, 95% CI 0.48 to 0.96, p = 0.03). The incidence of non–Q-wave myocardial infarction was also lower in the achieved OMT group than in the non-OMT group (0.5% vs 1.5%, p = 0.08). Multivariate logistic regression analysis identified that hemoglobin A1c <7.0% was the only protective predictor of 24-month target vessel failure (odds ratio 0.56, 95% CI 0.43 to 0.73, p <0.01). In conclusion, this study demonstrated that in patients with stable CAD scheduled for stent implantation, achievement of OMT before percutaneous coronary intervention significantly reduced subsequent cardiac events. Achievement of OMT is still insufficient in modern clinical practice.
Most studies have evaluated the clinical efficacy of potential optimal medical therapy (OMT) for a few years after randomization, but no study has assessed whether achieving the goals of an OMT before percutaneous coronary intervention (PCI) reduces subsequent cardiac events. The Japan Drug-Eluting Stents Evaluation: a Randomized Trial (J-DESsERT) is a prospective, randomized controlled study that compares 2 first-generation drug-eluting stents (DESs) for the treatment of coronary artery disease (CAD). In the present study, which is based on data from J-DESsERT, we hypothesized that optimized control of coronary risk factors before PCI may be associated with a risk reduction for perioperative and long-term cardiac events. The present study evaluates whether achievement of all treatment targets improves 24-month outcomes in patients undergoing stent implantation.
Methods
J-DESsERT is a prospective, multicenter, randomized, noninferiority trial that compares 2 first-generation DESs for the treatment of CAD ( http://www.clinicaltrials.gov , unique identifier: NCT00708669 ). A total of 3,533 patients were enrolled from 123 participating centers (See Supplementary Material ) from July 2008 to August 2010. The exclusion criteria were as follows: acute myocardial infarction, chronic total occlusion, left main CAD, coronary artery bypass graft disease, or instent restenosis. We also excluded patients who were not available for detailed recording of medical treatments, blood pressure, and key laboratory data such as low-density lipoprotein cholesterol (LDL-C) and hemoglobin A1c levels. After these exclusions, a total of 3,004 patients who underwent PCI were analyzed in this study. In the present study, we set 3 major risk factor targets for patients: LDL-C <100 mg/dl, blood pressure <130/80 mm Hg, and hemoglobin <7% according to guidelines. Patients who achieved all 3 target goals at baseline were defined as having achieved OMT. For the control of coronary risk factors, J-DESsERT strongly recommended medical treatment that targeted prespecified values of risk factors: blood pressure, LDL-C, and hemoglobin A1c. Follow-up was scheduled at 30 days and 8, 12, and 24 months after the procedure. Dual antiplatelet therapy was recommended for at least 6 months postprocedure and up to 12 months in patients not at a high risk of bleeding. The primary end point of this analysis was the incidence of target vessel failure, a composite of death related to the target vessel, myocardial infarction, or clinically driven target vessel revascularization. Detailed definitions were reported in J-DESsERT’s primary publication. Definite and probable stent thromboses were defined by the Academic Research Consortium. All statistical analyses were performed on an intention-to-treat principle. Continuous variables were expressed as mean ± SD and evaluated by means of the Student t test. Categorical variables were expressed as frequencies using the chi-square test or Fisher’s exact test as appropriate. Time-to-event end points were compared using Kaplan-Meier survival curves, and the corresponding p value was obtained from the log-rank test. Differences between event rates were compared using Cox proportional hazards or logistic regression analyses to estimate the hazard ratio or odds ratio and the 95% CI. To identify independent predictors of 12-month and 24-month target vessel failure, all variables in Table 1 were tested and were also entered into the multivariate logistic regression model. A p value <0.05 was considered statistically significant. Statistical analysis was performed using SAS 9.2 (SAS Institute Inc., North Carolina).
| Variable | Achievement optimal medical therapy | ||
|---|---|---|---|
| Yes (n = 548) | No (n = 2,456) | p-value | |
| Age (years) | 69.8 ± 9.2 | 69.3 ± 9.2 | 0.29 |
| Men | 417 (76.1%) | 1,757 (71.5%) | 0.03 |
| Body mass index (kg/m 2 ) | 23.8 ± 3.2 | 24.5 ± 3.5 | <0.01 |
| Hypertension | 423 (77.2%) | 1,978 (80.5%) | 0.09 |
| Dyslipidemia | 420 (76.6%) | 1,563 (63.6%) | <0.01 |
| Total cholesterol (mg/dl) | 158.5 ± 23.2 | 190.3 ± 34.4 | <0.01 |
| Low-density lipoprotein cholesterol (mg/dl) | 79.8 ± 16.0 | 111.6 ± 30.9 | <0.01 |
| High-density lipoprotein cholesterol (mg/dl) | 51.7 ± 18.3 | 50.1 ± 13.7 | 0.02 |
| Triglycerides (mg/dl) | 134.6 ± 71.1 | 142.8 ± 70.9 | 0.02 |
| Current smoker | 90 (16.4%) | 470 (19.1%) | 0.15 |
| Diabetes mellitus | 197 (36.0%) | 1,266 (51.6%) | <0.01 |
| Hemoglobin A1c (%) | 6.0 ± 0.5 | 6.8 ± 1.3 | <0.01 |
| Prior coronary intervention | 140 (25.6%) | 541 (22.0%) | 0.08 |
| Prior coronary bypass | 30 (5.5%) | 61 (2.5%) | <0.01 |
| Prior myocardial infarction | 96 (17.5%) | 323 (13.2%) | 0.01 |
| Heart failure hospitalization | 30 (5.5%) | 113 (4.6%) | 0.38 |
| Peripheral arterial disease | 34 (6.2%) | 198 (8.1%) | 0.16 |
| Cerebral vascular disease | 61 (11.1%) | 306 (12.5%) | 0.43 |
| Left ventricular ejection fraction <40% | 15 (2.7%) | 82 (3.3%) | 0.59 |
| Multiple vessel coronary disease | 75 (13.8%) | 443 (18.1%) | 0.02 |
| Paclitaxel-eluting stent | 277 (50.5%) | 1,217 (49.6%) | 0.71 |
| Sirolimus-eluting stent | 271 (49.5%) | 1,239 (50.4%) | 0.71 |
| Narrowings | n = 684 | n = 3,193 | |
|---|---|---|---|
| Target coronary artery | |||
| Left anterior descending | 335 (49.2%) | 1,568 (49.2%) | 0.88 |
| Left circumflex | 160 (23.5%) | 725 (22.7%) | |
| Right | 186 (27.3%) | 895 (28.1%) | |
| Type B2/C | 436 (64.1%) | 2,072 (65.2%) | 0.15 |
| Lesion length <10 mm | 169 (26.4%) | 803 (26.8%) | 0.64 |
| Lesion length 10–20 mm | 317 (49.6%) | 1,427 (47.7%) | |
| Lesion length ≥20 mm | 153 (23.9%) | 762 (25.5%) | |
| Number of deployed stents | 1.2 ± 0.4 | 1.2 ± 0.4 | 0.38 |
| Stent diameter (mm) | 3.0 ± 0.4 | 3.0 ± 0.4 | 0.39 |
| Total stent length (mm) | 23.0 ± 10.7 | 24.4 ± 11.7 | <0.01 |
| Intravascular ultrasound use | 530 (77.5%) | 2,434 (76.2%) | 0.52 |
| Post-dilation pressure (atm) | 17.1 ± 4.2 | 17.3 ± 4.2 | 0.46 |
| Technical Success | 664 (97.2%) | 3,071 (96.2%) | 0.22 |
Results
At a point just before the procedure, only 548 patients (18.2%) achieved all 3 targets ( Figure 1 ). The percentage of patients who achieved these target levels were 51.3% (blood pressure), 45.7% (LDL-C), and 73.0% (hemoglobin A1c). Table 1 lists baseline clinical and angiographic characteristics for the patients. Those who achieved OMT (the “achieved OMT” group) were more likely to be men, to have a lower body mass index, and to have dyslipidemia, whereas diabetes mellitus was often observed in patients who did not achieve OMT (the “non-OMT” group). The proportions of the various medications such as statins and antidiabetic drugs therefore differed significantly between the groups ( Table 2 ). Although non-OMT patients also had multiple vessel coronary disease and required a longer stent length, the rate of technical success was higher and was similar between the 2 groups. The results of follow-up are summarized in Table 3 . At 24 months, the incidence of target vessel failure was 7.0% in the achieved OMT group versus 10.0% in the non-OMT group (p = 0.03). The incidence of myocardial infarction in the non-OMT group was twice that of the achieved OMT group, although this difference was not statistically significant. The rate of non–Q-wave myocardial infarction tended to be lower in the achieved OMT group than in the non-OMT group. Figure 2 shows that the event curves of both groups constantly increased to 24 months and that there were 2 points at which the 2 event curves significantly diverged, the first at 2 to 3 days after PCI and the second at approximately 8 to 10 months after PCI. Figure 3 shows that myocardial infarction during the 30 days after PCI was greater in the non-OMT group (p = 0.13) and was observed a few days after the procedures. Multivariate analysis was used to identify the independent correlates of the primary end point. As presented in Table 4 , model 1, which included achieved OMT and clinically relevant variables, identified the achievement of OMT as an independent protective predictor of 12-month target vessel failure. The achievement of OMT did not result in a statistically significant reduction in the risk of 24-month target vessel failure. Model 2 used multivariate analysis that analyzed OMT in terms of the 3 targets (blood pressure, LDL-C, and hemoglobin A1c). The criterion hemoglobin A1c <7.0% was the only protective predictor of 12- and 24-month target vessel failure.
| Variable | Achievement optimal medical therapy | p-value | |
|---|---|---|---|
| Yes (n=548) | No (n=2,456) | ||
| Medical treatment before PCI | |||
| Clopidogrel / Ticlopidine | 526 (96.0%) | 2,319 (94.4%) | 0.17 |
| Aspirin | 514 (93.8%) | 2,361 (96.1%) | 0.02 |
| Statins | 396 (72.3%) | 1,408 (57.3%) | <0.01 |
| ACE-I or ARB | 275 (50.2%) | 1,318 (53.7%) | 0.14 |
| Beta-blockers | 118 (21.5%) | 476 (19.4%) | 0.26 |
| Oral diabetic drugs | 144 (26.3%) | 1,028 (41.9%) | <0.01 |
| Insulin | 21 (3.8%) | 261 (10.6%) | <0.01 |
| Medical treatment at 12 months | |||
| Clopidogrel / Ticlopidine | 478 (87.2%) | 2,167 (88.2%) | 0.51 |
| Aspirin | 494 (90.2%) | 2,243 (91.3%) | 0.41 |
| Statins | 400 (73.0%) | 1,635 (66.6%) | <0.01 |
| ACE-I or ARB | 279 (50.9%) | 1,386 (56.4%) | 0.02 |
| Beta-blockers | 118 (21.5%) | 476 (19.4%) | 0.26 |
| Medical treatment at 24 months | |||
| Clopidogrel / Ticlopidine | 396 (72.3%) | 1,867 (76.0%) | 0.07 |
| Aspirin | 455 (83.0%) | 2,112 (86.0%) | 0.08 |
| Statins | 376 (68.6%) | 1,554 (63.3%) | 0.02 |
| ACE-I or ARB | 251 (45.8%) | 1,295 (52.7%) | <0.01 |
| Beta-blockers | 124 (22.6%) | 512 (20.9%) | 0.36 |
| Variable | Achievement optimal medical therapy | HR (95% Cl) | p-value | |
|---|---|---|---|---|
| Yes (n = 548) | No (n = 2456) | |||
| Target vessel failure | 37 (7.0%) | 239 (10.0%) | 0.68 (0.48–0.96) | 0.03 |
| Cardiac death | 4 (0.8%) | 26 (1.1%) | 0.69 (0.24–1.98) | 0.49 |
| Myocardial infarction | 5 (0.9%) | 45 (1.8%) | 0.50 (0.20–1.25) | 0.13 |
| Q-wave myocardial infarction | 2 (0.4%) | 7 (0.3%) | 1.28 (0.27–6.15) | 0.76 |
| Non-Q-wave myocardial infarction | 3 (0.5%) | 37 (1.5%) | 0.36 (0.11–1.17) | 0.08 |
| Target vessel revascularization | 33 (6.3%) | 183 (7.8%) | 0.80 (0.55–1.16) | 0.23 |
| Target lesion revascularization | 25 (4.7%) | 147 (6.2%) | 0.75 (0.49–1.15) | 0.19 |
| Target vessel revascularization remote | 11 (2.2%) | 43 (1.8%) | 1.15 (0.59–2.23) | 0.68 |
| Stent thrombosis | 3 (0.6%) | 10 (0.4%) | 1.34 (0.37–4.88) | 0.65 |
| Cerebral vascular events | 9 (1.7%) | 49 (2.1%) | 0.83 (0.41–1.68) | 0.60 |

| Model 1: optimal medical therapy plus clinically relevant variables | 12 months | 24 months | ||
|---|---|---|---|---|
| OR [95% CI] | p value | OR [95% CI] | p value | |
| Achieved optimal medical therapy | 0.65 [0.43–0.98] | 0.04 | 0.76 [0.53–1.10] | 0.14 |
| Lesion length ≥20 mm | 1.38 [1.03–1.84] | 0.03 | 1.42 [1.09–1.86] | 0.01 |
| Multiple vessel coronary disease | 2.59 [1.95–3.44] | < 0.01 | 2.22 [1.70–2.90] | < 0.01 |
Stay updated, free articles. Join our Telegram channel

Full access? Get Clinical Tree


