Low-density lipoprotein cholesterol (LDL-C) only partly represents the atherogenic lipid burden, and a growing body of evidence suggests that non–high-density lipoprotein cholesterol (non-HDL-C), triglycerides, and apolipoprotein B (apoB) are more accurate in estimating lipid-related cardiovascular disease risk. Our objective was to compare the relation among LDL-C, non-HDL-C, triglycerides, and apoB and the occurrence of future vascular events and mortality in patients with manifest arterial disease. This is a prospective cohort study of 7,216 patients with clinically manifest arterial disease in the Secondary Manifestations of Arterial Disease Study. Cox proportional hazard models were used to quantify the risk of major cardiovascular events (MACE; i.e., stroke, myocardial infarction, and vascular mortality) and all-cause mortality. Interaction was tested for type of vascular disease at inclusion. MACE occurred in 1,185 subjects during a median follow-up of 6.5 years (interquartile range 3.4 to 9.9 years). Adjusted hazard ratios (HRs) of MACE per 1 SD higher were for LDL-C (HR 1.15, 95% confidence interval [CI] 1.09 to 1.22), for non-HDL-C (HR 1.17, 95% CI 1.11 to 1.23), for log(triglycerides) (HR 1.12, 95% CI 1.06 to 1.19), and for apoB HR (1.12, 95% CI 0.99 to 1.28). The relation among LDL-C, non-HDL-C, and cardiovascular events was comparable in patients with cerebrovascular disease, coronary artery disease, or polyvascular disease and absent in those with aneurysm of abdominal aorta or peripheral artery disease. In conclusion, in patients with a history of cerebrovascular, coronary artery, or polyvascular disease, but not aneurysm of abdominal aorta or peripheral artery disease, higher levels of LDL-C and non-HDL-C are related to increased risk of future MACE and of comparable magnitude.
Several studies have made a direct comparison to assess which lipid parameters has the strongest relation with risk of vascular disease and overall; apolipoprotein B (apoB) and non–high-density lipoprotein cholesterol (non-HDL-C) appear to be favorable over low-density lipoprotein cholesterol (LDL-C). Triglyceride-rich remnants are also strongly related to cardiovascular events and triglycerides and, therefore, could also be a good marker. Most studies comparing lipid parameters to cardiovascular events were done in a primary prevention setting, whereas patients at highest risk of cardiovascular events are those with a history of clinically manifest arterial disease. Few studies included patients with coronary heart disease, but these studies were all randomized controlled trials with statins. In these studies, non-HDL-C also had a stronger association with risk of recurrent coronary or cerebral ischemic events, although point estimates were lower for recurrent compared with first major cardiovascular events (MACE). Because type of vascular disease (coronary, cerebrovascular, and peripheral artery) influences the risk of future vascular events, there is some evidence to assume that type or extent of atherosclerosis can also influence the relation between lipids and risk of a recurrent cardiovascular disease. The aim of this study, therefore, was to evaluate and compare the relation between LDL-C, non-HDL-C, triglycerides, and apoB and the occurrence of future vascular events and mortality, in patients with clinically manifest arterial disease, and whether location of vascular disease influences this relation.
Methods
Data were used from patients enrolled in the Second Manifestations of Arterial Disease (SMART) cohort. This is a prospective, ongoing cohort study at the University Medical Center Utrecht, The Netherlands, designed to study the presence of concomitant arterial disease and risk factors for atherosclerosis in a high-risk population. Patients, aged 18 to 80 years, newly referred to our institution with clinically manifest arterial disease or with a vascular risk factor, hyperlipidemia, hypertension, or diabetes mellitus (types 1 and 2) were asked to participate. The study was approved by the medical ethics committee of the University Medical Center Utrecht, and informed consent was obtained from all patients (n = 10,645). A detailed description regarding study rationale and design has been published before. The present study used data from 7,216 patients enrolled from September 1996 to March 2014 with either a history or a recent diagnosis of manifest arterial disease. From 2005 onward, apoB was measured, and since 2006, apoB became part of the standard screening protocol; therefore, ApoB levels were available in 3,503 patients.
Clinically manifest atherosclerotic arterial disease was defined as cerebral, coronary, or peripheral artery disease or aneurysm of the abdominal aorta. Cerebrovascular disease included transient ischemic attack, cerebral infarction, amaurosis fugax, retinal infarction, or a history of carotid surgery. Coronary artery disease was defined as angina pectoris, myocardial infarction, cardiac arrest, or coronary revascularization (coronary bypass surgical procedure or coronary angioplasty). Patients with peripheral artery disease had symptomatic and documented obstruction of an artery in a distal extremity and underwent surgical operation (percutaneous transluminal angioplasty, bypass, or amputation). Abdominal aortic aneurysm (suprarenal or infrarenal) was defined as a diameter of >3 cm or a history of aortic aneurysm surgery. When patients had vascular disease at multiple locations, they were defined as having polyvascular disease. At inclusion, all patients completed a health questionnaire and responded to questions including history of vascular disease, hypertension, diabetes mellitus, current medication use, and lifestyle. A physical examination took place where height, weight, and blood pressure was measured. Blood samples were collected at baseline after an overnight fast. Plasma total cholesterol, triglycerides, and HDL-C were measured using commercial enzymatic dry chemistry kits (Johnson & Johnson, New Brunswick and Boehringer-Mannheim, Mannheim, Germany, respectively). LDL-C was calculated using the Friedewald formula up to a plasma triglycerides level of 9 mmol/L. This is in line with data showing that the Friedewald formula can be used up to this level. In 32 patients, plasma triglycerides levels were >9 mmol/L and LDL-C could not be calculated. Non-HDL-C was calculated as total cholesterol minus HDL-C and apoB was measured on a BNII nephelometer (Siemens, Erlangen, Germany).
Patients were biannually asked to fill in a short questionnaire regarding hospitalization and outpatient clinic visits. If a patient reported a possible event, all available relevant data were collected, and the SMART Endpoint Committee that consisted of 3 staff members independently classified all events. Outcomes of interest for this study were occurrence of stroke (ischemic and hemorrhagic, fatal, and nonfatal), myocardial infarction (fatal and nonfatal), cardiovascular mortality (fatal stroke, fatal myocardial infarction, death due to terminal heart failure, ruptured abdominal aortic aneurysm, and sudden death), MACE (composite of any of the previously listed outcomes), and all-cause mortality. Follow-up duration was defined as the period between study enrollment and first recurrent vascular event or death from any cause, date to loss of follow-up, or the preselected date of March 2014.
Baseline characteristics of the total study population are presented for the total study population and stratified according to the location of vascular disease. Single imputation methods were used to account for missing data (which was 2.2% for LDL-C, 0.7% for non-HDL-C, 0.6% for triglycerides, alcohol, and smoking status, and 0.2% for body mass index [BMI]). Because apoB was one of the determinants and not missing at random, we choose not to impute these values. If a patient had multiple events, the first recorded event was used in the analyses and patients were censored if they were lost to follow-up. Cox proportional hazard models were used to calculate hazard ratios (HRs) and corresponding 95% confidence intervals (CIs) per lipid parameter for the occurrence of stroke, myocardial infarction, cardiovascular mortality, MACE, and all-cause mortality. Two models were used: model I with adjustment for age and gender and model II with adjustment for age, gender, BMI, smoking, alcohol, and diabetes mellitus. Because triglycerides levels had a skewed distribution, log transformation was applied, and to be able to compare effect sizes of lipid parameters, HR were calculated per 1 standard deviation (1 SD) increase in LDL-C, non-HDL-C, log(triglycerides), and ApoB. A sensitivity analysis took place with additional adjustment for lipid-lowering therapy.
ApoB was not measured in the total population, and therefore, analyses were repeated in a subset of patients with complete lipid measurements (n = 3,492). Effect modification on a multiplicative scale was tested by adding an interaction term between “LDL-C/1 SD, non-HDL-C/1 SD, and log(triglycerides)/1 SD × type of vascular disease.” The models with and without the interaction term were compared using the likelihood ratio test, and a p value <0.05 was considered statistically significant. If interaction was present, analyses were stratified per type of vascular disease (cerebrovascular disease, coronary artery disease, abdominal aortic aneurysm, peripheral artery disease, or polyvascular disease). This could not be done for apoB because of a limited number of events in the subsets. Effect modification was also tested for diabetes mellitus, age ≥65 versus <65 years, number of beds with vascular disease, categorized as 1, 2, or >2, year of inclusion, categorized into 4 equal groups, and lipid parameters for risk of MACE. Next, risk of vascular events and/or mortality was also calculated per quartile of each of the lipid parameters, using the lowest quartile as reference. The quartile ranges of LDL-C were <2.12, 2.12 to 2.73, 2.74 to 3.53, and >3.53 mmol/L, for non-HDL-C were <2.75, 2.75 to 3.48, 3.47 to 4.38, and >4.38 mmol/L, for triglycerides were <1.00, 1.00 to 1.41, 1.40 to 2.00 mmol/L, and >2.00, and for apoB, quartiles were divided into <0.68, 0.68 to 0.81, 0.82 to 0.99, and >0.99 g/dl. The proportional hazards assumptions were verified using Schoenfeld residuals plotted against (age adjusted) time scale. The open source software program R 3.2.0 (R Development Core Team, Vienna, Austria) was used for data analyses.
Results
The mean age at baseline was 60 ± 10 years, and 74% were men. Patients with coronary artery disease on average were more often diagnosed with hypertension, were more likely to use blood pressure–lowering medication, statins and antiplatelet or anticoagulant therapy, and had a higher BMI compared with the total study population. Patients with peripheral artery disease more often were current smokers. In 87% of the patients with polyvascular disease, vascular disease was present in 2 vascular beds and 12% had vascular disease in 3 locations. Patients with abdominal aortic aneurysm and polyvascular disease were on average older at baseline and those with polyvascular disease were more likely to be diagnosed with diabetes and those with peripheral artery disease or abdominal aortic aneurysm had on average higher total cholesterol, LDL-C, non-HDL-C, and apoB levels ( Table 1 ).
| Variable | Total Study Population | Cerebrovascular Disease ∗ | Coronary Artery Disease | Aneurysm of Abdominal Aorta | Peripheral Artery Disease | Polyvascular Disease |
|---|---|---|---|---|---|---|
| (n = 7216) | (n = 1549) | (n = 3464) | (n = 265) | (n = 825) | (n = 1113) | |
| Age (years) | 60.1 (10.3) | 58.1 (11.4) | 60.0 (9.6) | 65.0 (10.3) | 57.6 (10.7) | 63.5 (9.2) |
| Male sex | 5319 (74%) | 895 (58%) | 2800 (81%) | 226 (85%) | 514 (62%) | 884 (79%) |
| Current smoking | 2300 (32%) | 524 (34%) | 799 (23%) | 99 (37%) | 499 (60%) | 379 (34%) |
| Current alcohol use | 793 (11%) | 182 (12%) | 332 (10%) | 35 (13%) | 71 (9%) | 173 (16%) |
| Hypertension | 6217 (86%) | 1128 (73%) | 3288 (95%) | 208 (78%) | 580 (70%) | 1013 (91%) |
| Diabetes mellitus | 1259 (17%) | 203 (13%) | 624 (18%) | 33 (12%) | 138 (17%) | 261 (23%) |
| Cerebrovascular disease | 2120 (29%) | 1549 (100%) | – | – | – | 571 (51%) |
| Coronary Artery disease | 4365 (60%) | – | 3464 (100%) | – | – | 901 (81%) |
| Aneurysm of abdominal aorta | 624 (9%) | – | – | 265 (100%) | – | 359 (32%) |
| Peripheral vascular disease | 1373 (19%) | – | – | – | 825 (100%) | 548 (49%) |
| Blood pressure lowering agents | 5315 (74%) | 810 (52%) | 3157 (91%) | 138 (52%) | 319 (39%) | 891 (80%) |
| Statin therapy | 4776 (66%) | 823 (53%) | 2794 (81%) | 85 (32%) | 306 (37%) | 768 (69%) |
| Anti-platelet / anti-coagulant agents | 5964 (83%) | 1215 (78%) | 3210 (93%) | 105 (40%) | 436 (53%) | 998 (90%) |
| Body mass index (kg/m 2 ) | 26.8 (4.0) | 26.4 (4.2) | 27.3 (3.8) | 26.0 (3.7) | 26.0 (4.4) | 26.9 (3.9) |
| Systolic blood pressure (mmHg) | 140 (21) | 142 (22) | 137 (20) | 144 (20) | 145 (21) | 144 (21) |
| Diastolic blood pressure (mmHg) | 81 (11) | 83 (12) | 80 (11) | 85 (12) | 82 (11) | 80 (12) |
| Total cholesterol (mmol/l) | 4.86 (1.21) | 5.00 (1.20) | 4.58 (1.12) | 5.41 (1.31) | 5.56 (1.21) | 4.91 (1.17) |
| Triglycerides (mmol/l) | 1.4 (1.0 – 2.0) | 1.3 (0.9 – 1.8) | 1.4 (1.0 – 1.9) | 1.4 (1.1 – 2.0) | 1.5 (1.1 – 2.2) | 1.6 (1.1 – 2.3) |
| High-density lipoprotein cholesterol (mmol/l) | 1.23 (0.37) | 1.34 (0.42) | 1.19 (0.32) | 1.22 (0.39) | 1.28 (0.41) | 1.17 (0.35) |
| Low-density lipoprotein cholesterol (mmol/l) | 2.87 (1.04) | 2.97 (1.07) | 2.64 (0.93) | 3.42 (1.16) | 3.44 (1.10) | 2.90 (1.03) |
| Non-high-density lipoprotein cholesterol (mmol/l) | 3.63 (1.21) | 3.65 (1.21) | 3.39 (1.12) | 4.20 (1.33) | 4.29 (1.26) | 3.74 (1.17) |
| Apolipoprotein B (g/dl) † | 0.84 (0.24) | 0.84 (0.27) | 0.83 (0.23) | 0.93 (0.27) | 0.94 (0.26) | 0.84 (0.23) |
| High-sensitivity C-reactive protein (mg/L) | 2.0 (1.0 – 4.4) | 1.8 (0.8 – 4.1) | 1.6 (0.8 – 3.4) | 3.7 (1.6 – 7.6) | 3.2 (1.5 – 6.1) | 2.9 (1.4 – 5.8) |
∗ Cerebrovascular disease was caused by hemorrhagic stroke in 17 of the 1549 patients.
† Apolipoprotein B measurements were available in a subset of n = 3503 patients.
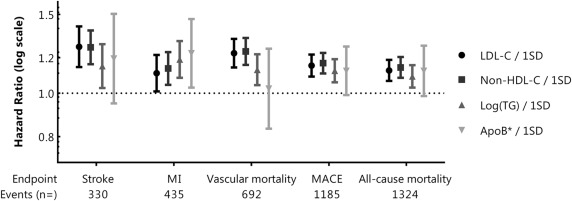
During a median follow-up of 6.5 years (IQR 3.4 to 9.9 years), 1,324 patients (18%) died (of whom 692 from a vascular cause); 330 patients (5%) had a stroke, 435 patients (6%) had a myocardial infarction, and 1,185 patients (16%) had the composite outcome, MACE. After adjustment for confounding, 1 SD higher LDL-C, non-HDL-C, triglycerides, and apoB were related with higher risk of MACE (HR 1.15, 95% CI 1.09 to 1.22 for LDL-C; HR 1.17, 95% CI 1.11 to 1.23 for non-HDL-C; HR 1.12, 95% CI 1.06 to 1.19 for log(triglycerides); and HR 1.12, 95% CI 0.99 to 1.27 for apoB) and also with increased risk of all-cause mortality, as presented in Figure 1 (and in Supplementary Table 1 , which can be found online only). Although CIs of apoB were wide, the risk of myocardial infarction was 23% higher per 1 SD higher apoB. In the sensitivity analysis with additional adjustment for lipid-lowering therapy, the effect estimates did not change, nor did additional adjustment for hypertension, use of antiplatelet/anticoagulant agents, and hs-CRP. Because apoB was measured from 2005 onward, we repeated the analyses in a subset of patients (n = 3,492) with complete lipid measurements (baseline characteristics are provided in Supplementary Table 2 , which can be found online only). Point estimates for risk of vascular events and mortality for LDL-C, non-HDL-C, and apoB in the subset were comparable with the total study population ( Supplementary Figure 1 and in Supplementary Table 1 , which can be found online only). The relation between log(triglycerides) and cardiovascular endpoints, however, was less evident in the subset of patients with complete lipid measurements.
The relation between levels of triglycerides and risk of MACE was dependent of location of vascular disease at inclusion (p value = 0.04 for interaction between log(triglycerides) × type of vascular disease). For LDL-C and non-HDL-C, interaction was not statistically significant (p values 0.66 and 0.58, respectively). Results stratified according to the type of vascular disease at baseline are presented in Table 2 . After adjustment for confounding, 1 SD higher LDL-C and non-HDL-C were related to an increased risk of MACE in patients with a history of cerebrovascular disease, coronary artery disease, or polyvascular disease. The effect of 1 SD higher triglycerides on risk of MACE was comparable magnitude in patients with cerebrovascular disease or coronary artery disease but nonsignificant in those with polyvascular disease. In patients with a history of peripheral artery disease or abdominal aortic aneurysm, no association was present between lipid parameters and risk of MACE. No interaction was present between diabetes mellitus and LDL-C (p value 0.88), non-HDL-C (p value 0.58), log(triglycerides) (p value 0.85), or apoB (p value 0.83) and the risk of future MACE. Interaction was also absent for age ≥65 versus <65 years (p values were 0.07, 0.11, 0.99, and 0.81, respectively), for number of beds with vascular disease (p values 0.31, 0.92, 0.10, and 0.52, respectively), and for year of inclusion (p value 0.08, 0.15, 0.90, and 0.38, respectively) × lipid parameters on risk of MACE.


