Fig. 10.1
Analysis of wall motion. The left ventricle can be divided into 17 segments and identified by a series of longitudinal views: (1) apical four-chamber, (2) apical two-chamber, (3) apical long-axis, or a series of short-axis views; (4) base (short axis at the tips of the mitral leaflets), (5) mid-cavity (short axis at the papillary muscles), and (6) apex (short axis beyond the papillary muscles but before the cavity ends). The longitudinal and short-axis views overlap and complement each other. The apical cap, the 17th segment, can be appreciated only by echocardiography with contrast opacification of the left ventricular cavity. A 16-segment model can be used without the apical cap. Long axis; apical four-chamber; apical three-chamber; apical two-chamber (From Lang et al. [7]. With permission from Elsevier, Inc)
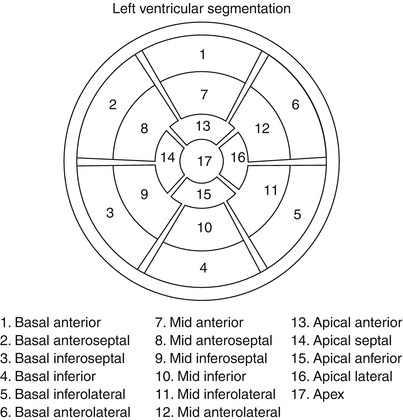
Fig. 10.2
Display, on a circumferential polar plot, of the 17 myocardial segments and the recommended nomenclature for tomographic imaging of the heart (From American Society of Nuclear Cardiology [290]. Reprinted with permission from Springer)
The wall-motion score index is an expression of regional LV function that is directly proportional to the severity and extent of an RWMA. Each myocardial segment is scored on a scale of 1–5, according to a qualitative assessment of regional function and systolic thickening (normal, 1; hypokinesis, 2; akinesis, negligible thinning, 3; dyskinesis, paradoxical systolic motion, 4; and aneurysm, diastolic deformation, 5) (Table 10.1). The composite score, divided by the number of segments, provides a semiquantitative evaluation of regional wall motion [5, 7]. Previous authors have recommended a four-point wall-motion scoring system [8, 9], but the American Society of Echocardiography (ASE) continues to advocate a five-point scoring system, which includes the discrimination of aneurysmal segments [7]. The 16-segment format is recommended for evaluating regional LV dysfunction with two-dimensional (2D) echocardiography, because the 17th apical segment does not exhibit inward motion [7]. Routine echocardiographic assessment of regional systolic function is subjective and requires satisfactory endocardial border definition. Harmonic imaging and intravenous administration of echocardiographic contrast agents in patients with suboptimal acoustic windows improve image quality and enhance the definition of endocardial borders, accuracy of left ventricular ejection fraction (LVEF) assessment, and detection of regional systolic-function abnormalities [10]. The coronary artery blood supply to the myocardial segments varies, but the typical relationship between the three coronary arteries and the myocardial segments is illustrated in Fig. 10.3.
Table 10.1
Wall-motion score
Score | Wall motion | Definition |
|---|---|---|
1 | Normal/hyperkinesis | Normal systolic motion and thickening |
2 | Hypokinesis | Reduced systolic motion or thickening |
3 | Akinesis | Absent inward systolic motion or thickening |
4 | Dyskinesis | Paradoxic (“bulging”) or outward motion |
5 | Aneurysmal | Diastolic deformation |
Fig. 10.3
Typical distributions of the right coronary artery (RCA), the left anterior descending (LAD), and the circumflex (Cx) coronary arteries. The arterial distribution varies between patients. Some segments have variable coronary perfusion (From Lang et al. [7]. Reprinted with permission from Elsevier, Inc)
Although 2D echocardiography offers largely subjective assessment of global and regional LV function, this approach offers significant advantages over alternative imaging modalities, such as radionuclide ventriculography or cardiac magnetic resonance imaging (MRI). Two-dimensional echocardiography is inexpensive and portable, and it does not require radiation or even intravenous catheterization. Real-time imaging by 2D echocardiography diminishes, but does not eliminate, motion- and arrhythmia-induced artifacts. The accuracy of 2D echocardiography depends on the experience of the reader and the sonographer; inter- and intraobserver variability ranges from 10–30 %. Accuracy is further influenced by the patient’s imaging planes, which are diminished in obese patients, those with hyperinflated lungs, and those who are difficult to position postoperatively. Quantification of LVEF from 2D echocardiographic data requires geometric modeling of the ventricle. Although quantitative approaches are generally more accurate than qualitative assessment, such methods are time–consuming and rely on assumptions regarding the LV shape. Three-dimensional (3D) echocardiography is an emerging clinical tool for semiquantification of global LV systolic function. Left ventricular ejection fractions obtained by 3D echocardiography have been shown to correlate with LVEF measurements made by using cardiac MRI [11]. However, like 2D imaging, 3D imaging relies on imperfect discrimination between LV trabeculation and the underlying myocardium. This ultimately limits the accuracy of both techniques.
Regional Myocardial Doppler Velocities
Tissue Doppler imaging (TDI) offers an objective measure for quantifying regional and global LV function. Differentiation of passive motion from active myocardial shortening or thickening is limited by the temporal resolution (about 90 ms) required to detect differences in motion with the unaided human eye [12]. Measurement of the speed of motion of low-frequency myocardial tissue can be obtained with pulsed-wave TDI, which excludes the high-frequency velocities of the rapidly moving blood. Assessment of peak regional myocardial velocities with TDI techniques can be achieved in simultaneous segments at high frame rates. Tissue Doppler imaging is limited by translational motion and tethering effects [13–18]. Clinical limitations of this technique are attributed to the complexity of myofiber orientation, which creates motion in three dimensions: longitudinal shortening (base > mid > apex), radial thickening (all segments), and circumferential rotation (apex). Ability to image in only one plane and misalignment of the Doppler probe with the vector of cardiac motion diminish the accuracy of Doppler velocity imaging and may limit its clinical applicability at this time [19]. Strain imaging, a method for calculating regional myocardial function from TDI velocity data, theoretically is not confounded by translational movement or tethering [19]. Strain rates reflect the speed of regional myocardial longitudinal deformation and are calculated from myocardial TDI velocities measured at two locations separated by a given distance [7]. The longitudinal segmental strain rate is uniform throughout all segments, whereas TDI is greatest at the base and deteriorates as the motion becomes more circumferential toward the apex [14, 17, 20]. Apical segments cannot be reliably assessed with this technique. With ultrasonic strain-rate imaging, both the amount of deformation (strain) and the rate of local deformation (strain rate) can be quantified [15]. Strain and strain-rate imaging has been shown to be useful in detecting early LV dysfunction in patients receiving cardiotoxic chemotherapies and in differentiating transmural from nontransmural infarction [21]. Despite its clinical promise, strain and strain-rate imaging is technically challenging, and this has delayed its incorporation into routine clinical practice.
Myocardial Performance Index
The myocardial performance index (MPI) provides a noninvasive, semiquantitative assessment of global LV function, including systolic and diastolic function. The MPI is the sum of the diastolic intervals, isovolumic relaxation time, and isovolumic contraction time, divided by the systolic LV ejection time. The MPI is reproducible and less dependent on the heart rate and preload than are traditional Doppler measurements [22, 23]. In the normal heart, isovolumic diastolic times become shorter as contractility increases [24, 25]. With ischemia, the MPI deteriorates as the isovolumic relaxation time increases relative to the ejection times [26]. In patients with known LV dysfunction after an acute MI who were enrolled in the Survival and Ventricular Enlargement (SAVE) trial [27], an MPI of >0.5 was associated with a larger infarct size and reduced baseline LV systolic function. The MPI was also identified as an independent predictor for cardiovascular events after an MI in patients with LV systolic dysfunction. Because diastolic abnormalities precede the development of systolic alterations in the ischemic cascade, the MPI may be more sensitive than identification of a RWMA for the detection of myocardial ischemia. The MPI has been utilized with dobutamine stress echocardiography (DSE) for the detection of ischemia after an MI. In a series reported by Norager and colleagues [26], the MPI added prognostic value to DSE and accurately reflected the LV contractile state during low-dose DSE. This method may reflect the overall LV functional reserve. The MPI can also be used to evaluate RV performance. The clinical utility of the RV MPI is greater than that of the LV MPI because assessing the RV size and shape is difficult.
Unfortunately, systolic wall motion and thickening are often difficult to detect and quantify. Doppler techniques lack clinical applicability, and determining the MPI is time-consuming. Therefore, 2D grey-scale echocardiographic assessment remains the standard clinical modality for detecting RWMAs.
Assessment of Coronary Ischemia/Acute Myocardial Infarction
The echocardiographic evaluation of coronary ischemia and of regional myocardial dysfunction during an MI varies widely over a range of coronary blood flows [28]. Regional wall-motion abnormalities occur with coronary artery stenosis of >85 % at rest and >50 % during exercise or hyperemia [7]. These abnormalities arise within seconds after a coronary occlusion is induced by balloon inflation during angioplasty, and they may last for up to several days with prolonged ischemia [29, 30]. The abnormalities precede the development of electrocardiographic irregularities and the onset of cardiac symptoms. Because RWMAs develop before the onset of clinical symptoms, chest pain in the absence of an RWMA should not be caused by coronary ischemia. Figure 10.4 illustrates the cascade from myocardial ischemia to angina. During an episode of acute ischemic chest pain, 2D imaging should show RMWAs that normalize on resolution of the ischemia unless the duration of ischemia is sufficiently long to induce myocardial stunning [31]. The transient nature of the RMWA differentiates a brief episode of acute myocardial ischemia from an acute MI. The presence of an RWMA does not establish the diagnosis of acute ischemia. However, the presence of an aneurysm and myocardial thinning suggests a previous ischemic event [32, 33]. Regional wall-motion abnormalities can also be induced by focal myocarditis, previous cardiac surgery, left bundle-branch block, ventricular preexcitation, and even cardiomyopathy. Regional wall-motion abnormalities are present in 50–60 % of patients with idiopathic dilated cardiomyopathy [34]. For diagnosing acute coronary ischemia, echocardiography has a high sensitivity but a low specificity [32, 33].
Fig. 10.4
Ischemic cascade. Schematic representation of the clinical, electrocardiographic, and echocardiographic manifestations of myocardial ischemia as the workload (rate-pressure product) and duration of stress is increased. SOB shortness of breath, MI myocardial infarction, LV left ventricular, ECG electrocardiographic, LVEDP left ventricular end-diastolic pressure (From Jeroudi et al. [31]. Reprinted with permission from Elsevier Limited)
In a study by Rinkevich and colleagues [32], 1,017 patients with suspected cardiac chest pain in the absence of ST-segment elevation were evaluated with regard to standard clinical and electrocardiographic variables in the emergency room. The presence of RWMAs was assessed with 2D echocardiography. The sensitivity of RWMAs for detecting acute coronary syndrome was 88 %, but the specificity was only 18 %. Patients with RWMAs were 6.1 times more likely to experience an early cardiac event than those without RWMAs. The presence of an RWMA significantly increased the ability of clinical and electrocardiographic variables to predict early (within 48 h) major adverse cardiac events. Weston and associates [35] found that, in patients with symptoms of acute coronary syndrome, as well as nondiagnostic electrocardiograms and normal biochemical markers, demonstration of normal global systolic function by handheld echocardiography had a 91 % negative predictive value for acute MI. The addition of perfusion imaging to routine echocardiographic assessment of RWMAs and clinical variables in patients with suspected cardiac chest pain and nondiagnostic electrocardiograms improved the prediction of cardiac events. According to Tong and colleagues [36], the addition of perfusion imaging in patients with suspected cardiac chest pain and nondiagnostic electrocardiograms further enhanced the clinical Thrombolysis in Myocardial Infarction (TIMI) risk score and the ability of RWMAs to predict cardiac events (Fig. 10.5).
Fig. 10.5
Perfusion imaging enhances the clinical prediction of future cardiac events in patients with suspected cardiac chest pain. Event-free survival in patients with an intermediate-risk modified Thrombolysis in Myocardial Infarction (TIMI) score (3 or 4). MP myocardial perfusion, RF regional left ventricular function (From Tong et al. [36]. Reprinted with permission from Elsevier Limited)
Because early detection of RWMAs adds significant diagnostic and prognostic value to the routine evaluation of patients who present to the emergency department with suspected cardiac chest pain, a joint task force of the American College of Cardiology (ACC), AHA, and ASE in 2003 issued a class I recommendation for the use of echocardiography in diagnosing suspected ischemia or infarction when standard means of diagnosis were inconclusive [37, 38] but did not recommend echocardiography when the diagnosis was already apparent. The 2011 appropriate-use criteria for echocardiography identified the use of echocardiography in the diagnosis of suspected myocardial infarction as appropriate [39].
Location of Acute Myocardial Infarction
Two-dimensional and Doppler echocardiography provide assessment of the location and extent of myocardial damage, associated and preexisting valvular dysfunction, and ventricular and pulmonary artery pressures. Cardiac enzymes and the electrocardiogram are crude determinants of infarct size and location [40]. Validation studies with 201thallium scintigraphy, pyrophosphate (99inTc-PYP) scintigraphy, serum creatine kinase–myocardial band (MB) levels, and coronary arteriography have shown that 2D echocardiography accurately detects and identifies the anatomic location of MIs [41–44]. Two-dimensional echocardiography is less precise (sensitivity, 60–75 %) in detecting nontransmural MIs, presumably because transmural muscle loss is less than 20 % and preservation of the contractility of subepicardial myocardial layers can mask subendocardial dysfunction [45]. With an acute MI, the uninvolved myocardium shows a compensatory hyperdynamic contractile response, the absence of which may indicate multivessel disease [46]. The location of RWMAs correlates with the distribution of the occluded coronary artery, especially if the obstruction involves the left anterior descending (LAD) or posterior descending coronary arteries [47].
1.
Left anterior descending artery obstruction creates severe wall-motion abnormalities (akinesis with complete obstruction) of the septum, anterior wall, and apex. These segments are best visualized from the parasternal long-axis (anteroseptum), and apical four-chamber (septum and apex) and two-chamber (anterior wall and apex) views. The location of the obstruction along the vessel length (proximal, mid, or distal) will correspond to the severity and extent of the resulting RWMA. The LAD may supply a variable (and often large) proportion of the LV apex. Occlusion of the LAD may lead to distal inferior and distal inferolateral wall-motion abnormalities.
2.
Left circumflex artery (LCx) occlusion typically affects perfusion of the anterolateral and inferolateral segments. Imaging in the parasternal long-axis (inferolateral wall) and the apical four- and apical long-axis views (inferolateral wall) augment the short-axis exam for visualization of the typical LCx infarction. In approximately 20 % of patients, the LCx supplies the posterior descending artery (left dominant system), and interruption of the LCx blood flow can lead to an extensive RWMA that may also include the inferior septum and inferior free wall.
3.
Right coronary artery (RCA) occlusion results in an inferior RWMA. With proximal RCA occlusion, infarction of the right ventricle may occur (see below). The posterior descending artery, a branch of the RCA (right dominant system) in 80 % of patients, supplies the bulk of coronary flow to the inferior wall. Right coronary artery occlusion usually spares the apex. Two-dimensional imaging in the short-axis, basal, and midventricular views, confirmed by the apical two-chamber view, best reveals inferior wall-motion abnormalities resulting from RCA occlusion. Careful attention to RV size and function are important with acute inferior-wall infarction.
Bypass grafts and collateral blood flow will blur these generalizations. A common postbypass RWMA pattern includes paradoxic septal motion with marked hypokinesis to akinesis of the septum and normal motion of the anterior wall (in the absence of a previous anterior infarct).
Extent of Acute Myocardial Infarction
Cardiac enzymes and electrocardiography are crude indicators of infarct size and location [47]. Validation studies with 201thallium scintigraphy, pyrophosphate (99inTc-PYP) scintigraphy, serum creatine kinase–MB levels, and coronary arteriography have shown that 2D echocardiography accurately detects and identifies the anatomic location of MIs [41, 42, 48, 49]. The location of RWMAs correlates with the distribution of the occluded coronary artery, especially if the obstruction involves the LAD or posterior descending coronary arteries [47].
In postinfarct patients, LV systolic function is routinely assessed by measuring the LVEF with 2D echocardiography. The extent of the infarction can be quantified with the wall-motion score index. Echocardiography will overestimate the infarct size in the presence of a previous infarction and after reperfusion. Reperfusion after an infarct often leads to early (usually <14 days) improvement in the LVEF as stunned myocardial segments recover [50, 51]. In a review of 249 patients with serial echocardiographic studies, 58 % of the patients showed complete or partial recovery of LV function; most of those whose condition improved had more than a 5 % increase in LVEF [51]. Echocardiographic assessment of the infarct size is limited by this method’s inadequate sensitivity in differentiating old versus new infarctions [48].
In 2013, the ACC/AHA guidelines for the management of ST-elevation MI (STEMI) stated that the LVEF should be measured in all patients with STEMI [52] and that patients with an initially abnormal LVEF who are possible candidates for implantable cardioverter-defibrillator therapy should undergo reevaluation of the LVEF 40 or more days after hospital discharge. In 2012, the European Society of Cardiology’s STEMI guideline stipulated that echocardiography is the preferred imaging modality after STEMI, while the later ACC/AHA guideline made no imaging preference [53]. The 2011 ACC/AHA/ASE appropriateness criteria classified as appropriate the initial evaluation of LV function after acute coronary syndrome and the reevaluation of LV function after acute coronary syndrome during the recovery phase when the results will guide therapy [39].
Acute Complications of Acute Myocardial Infarction
Left Ventricular Failure/Cardiogenic Shock
Cardiogenic shock, a state of inadequate tissue perfusion related to cardiac dysfunction, complicates approximately 6–7 % of acute MIs [54–57]. Left ventricular pump failure accounts for most cases of acute hemodynamic deterioration after an acute MI. In a small number of patients, however, the cause of such deterioration may be a complication of an acute MI, such as rupture of the ventricular septum, free wall, or papillary muscle, which causes acute severe mitral regurgitation (MR). A high index of suspicion for one of these major complications in a patient with hypotension, tachycardia, a new systolic murmur, or congestive heart failure is required for rapid diagnosis and appropriate medical and surgical intervention [58]. Two-dimensional echocardiography and pulsed-wave and color-flow Doppler imaging provide a comprehensive assessment of the patient’s anatomic and hemodynamic status at the bedside and are, therefore, recommended by the ACC/AHA/ASE 2003 task force guidelines [38] for patients with hemodynamic deterioration after an acute MI. These methods are deemed appropriate by the 2013 appropriateness criteria [39].
Cardiac Rupture
Free-Wall Rupture
Rupture of the free wall of the left or right ventricle is observed in less than 1 % of living patients with an acute MI [59] but in as many as 26 % of autopsied patients who died with an acute MI [60, 61]. The most important risk factors for free-wall rupture are large infarct size [60] and delayed hospital admission with symptoms lasting for >24 h [62], which are consequences of inadequate reperfusion. The risk of rupture is further increased by first MIs associated with poor collateral blood flow [62], undue in-hospital physical activity [62], age >70 years, and female sex [63, 64]. According to the National Registry of Myocardial Infarction database, thrombolytic therapy accelerates the time course of cardiac rupture (often to within 24 h) and increases the risk of rupture-related death (from 7.3 % without thrombolytic treatment to 12.1 % with such treatment) [59]. According to various reports, the risk of myocardial rupture was significantly decreased by successful reperfusion with thrombolytic agents in acute-MI patients <75 years of age [65–69] or by angioplasty in all age groups studied [70, 71]. In a retrospective review of 2209 acute-MI patients treated with percutaneous coronary intervention [71], the risk of cardiac rupture was 0.7 % when successful reperfusion was achieved within 12 h, 0.9 % when reperfusion occurred within 12–24 h, and 3.8 % after failed reperfusion.
Infarcts of the lateral and anterior LV walls, subtended by the LCx or LAD coronary artery, are the infarcts most commonly associated with free-wall rupture [62]. Myocardial rupture rarely involves the right ventricle or the atria [72, 73]. The rupture site is typically located between infarcted and contractile myocardium.
Myocardial rupture originates as an abrupt slit-like tear, usually in the anterior myocardium. It occurs early and suddenly, within 3 days after an acute MI in 50 % of patients. In these cases, sudden chest discomfort, with rapidly progressive cardiogenic shock related to hemopericardium and tamponade, are followed by electromechanical dissociation [74] and death. Rapid 2D echocardiography will identify a pericardial effusion with tamponade and confirm the diagnosis [75].
Contained Free-Wall Rupture: Ventricular Pseudoaneurysm
Late rupture (more than 5 days after an acute MI) with infarct expansion, occurs mainly in patients who have had unsuccessful reperfusion. Late rupture with intramural dissection is more gradual or incomplete and produces the characteristic echocardiographic finding of a contained LV rupture, pseudoaneurysm, or false aneurysm. An LV pseudoaneurysm results from a localized rupture of the ventricular free wall, which produces a localized hemopericardium that is limited by parietal pericardium and by blood clot formation. There is an absence of heart muscle in the wall of a false aneurysm. Although ventricular pseudoaneurysms are usually the consequence of an acute MI (inferior infarctions being twice as common as anterior ones), they may also result from cardiac surgery (most commonly mitral valve replacement), trauma, or laceration [76]. A pericardial effusion with organizing thrombus may help the pericardium seal the ventricular perforation temporarily, but progression to frank rupture and cardiac tamponade may occur without warning [77].
Echocardiographic recognition of a pseudoaneurysm associated with a subacute or late LV rupture is difficult. In a large series of pseudoaneurysms [76], abnormalities were present on the 2D or Doppler echocardiograms of approximately 85–90 % of patients, but a definitive diagnosis was made in only about 25 %. In suspected cases, coronary angiography provides a definitive diagnosis in 87 % of patients [76]. Transesophageal echocardiography may improve the diagnostic accuracy but has not been studied in this regard. Contrast-enhanced cardiac MRI and computed tomographic scans have been shown to discriminate structures such as the pericardium, myocardium, thrombus, and epicardial fat, thereby aiding in the rapid diagnosis of this life-threatening condition [78, 79].
Two-dimensional echocardiography can detect discontinuity of the ventricular free wall and confirm the presence or absence of pericardial tamponade [80]. In most cases, a narrow neck abruptly connects the LV cavity to the large aneurysmal sac, which is usually pulsatile and may contain thrombus. Color-flow Doppler imaging shows characteristic bidirectional flow in both systole and diastole, resulting from a communication between the false aneurysm and the ventricular cavity.
Ventricular Septal Defect
Rupture of the interventricular septum is reported to complicate 1–3 % of acute STEMIs [81]. Ventricular septal defects (VSDs) accounted for 10 % of total cardiac deaths [82] before the reperfusion era but only 0.2 % of deaths observed in the Global Utilization of Streptokinase and Tissue Plasminogen Activator for Occluded Coronary Arteries trial (GUSTO-I) [83]. Usually occurring within the first week, VSDs are more common after large infarctions of the anterior wall [84], after poorly reperfused infarcts, in the elderly, and in women [81]. Although thrombolytic therapy prevents septal rupture in many patients who undergo successful coronary reperfusion, thrombolytic treatment likely accelerates rupture if reperfusion fails. In the GUSTO-1 trial, the median time from the onset of symptoms to the development of an interventricular septal rupture was only 1 day [83].
Septal rupture leads to a sudden left-to-right shunt, whose magnitude is proportional to the size of the septal defect and to the ratio of systemic to peripheral vascular resistance. In this clinical setting, Doppler echocardiography is usually diagnostic, its sensitivity and specificity reportedly being as high as 100 % [85]. Rarely, when mechanical ventilation or obesity pose a challenge to the transthoracic image quality, transesophageal echocardiography is required for diagnosis. In up to 40 % of patients, 2D echocardiography alone may show a dropout of echoes in the interventricular septum, in the region of abnormal wall motion (Fig. 10.6a) [72]. Color-flow Doppler imaging [86] has been shown to enhance the diagnostic accuracy up to 100 % by defining the site of septal rupture as an area of turbulent transseptal flow or by detecting a high-velocity jet on the right side of the ventricular septum (Fig. 10.6b). Color Doppler examination may show a single rupture site (typically with anteroapical defects) or multiple rupture sites (characteristically with inferior and inferobasal defects) [87, 88]. Pulsed-wave Doppler imaging, undertaken on the right side of the interventricular septum (at the site of the defect), usually reveals a high-velocity jet directed from the left ventricle to the right ventricle (Fig. 10.6c). Right ventricular systolic pressure can be estimated by subtracting the peak gradient obtained across the interventricular septum from the systolic (systemic) blood pressure, provided that no aortic stenosis is present. A semiquantitative estimate of the size of the left-to-right shunt can be obtained by measuring the volumetric flow across the pulmonary valve and the LV outflow tract, provided that no valvular regurgitation is present. Contrast 2D echocardiography can also identify a VSD. Thus, 2D echocardiography and color-flow Doppler imaging can rapidly and reliably provide an anatomic diagnosis and estimate the hemodynamic status at the bedside. Because the prognosis depends on early surgical intervention, echocardiography is invaluable for the rapid evaluation of this complication.
Fig. 10.6
Ventricular septal defect (VSD). (a) An apical VSD (arrow) is characterized by the dropout of the interventricular septum, as visualized by two-dimensional echocardiography. Color Doppler shows an area of turbulence at the site of the VSD rupture in the apical septum. (b) Color Doppler reveals a high-velocity jet of mosaic color directed into the apex of the right ventricle, with migration of blue elements toward the base of the right ventricle (opposite direction of RV inflow). Spectral Doppler identifies the direction of the shunt and the magnitude of the pressure gradient from the left to the right ventricle. (c) The RV systolic pressure can, and should, be estimated as the systolic blood pressure (SBP)-4 (peak VSD jet) [2]. RA right atrium, LA left atrium, PK peak gradient, LV left ventricle, RV right ventricle
Right Ventricular Infarction
Right ventricular infarction, usually caused by proximal occlusion of the RCA, may complicate up to 40 % of inferior MIs. The echocardiographic manifestations of RV infarction include RV dilatation, hypokinesis of the RV free wall [89–92], and manifestations of right atrial hypertension [55] (dilated right atrium, plethoric systemic veins) (Fig. 10.7a, b). These findings are not specific for RV infarction, and they commonly occur with acute and chronic pulmonary hypertension (pulmonary embolism). An RV infarction almost always accompanies an infarction of the inferior LV wall (Fig. 10.7c). Thus, RV dysfunction with akinesis of the inferior LV wall is characteristic of an RV infarction, having a sensitivity of more than 80–85 % [93]. Prompt diagnosis of RV infarctions will differentiate these lesions from other reversible causes of cardiogenic shock, such as cardiac tamponade.
Fig. 10.7
Right ventricular infarction. Echocardiography can detect the manifestations of right ventricular (RV) infarction, including RV dilatation, hypokinesis of the RV free wall (arrows), and evidence of elevated right atrial pressure (a), dilated right atrium (RA*) (a), and/or plethoric inferior vena cava (IVC*, arrow) (b). A left ventricular inferior wall-motion abnormality (arrows) should also be present (c). LV left ventricle, RA right atrium
Mural Thrombus
Mural thrombus, a common complication of an acute MI, had an incidence of up to 40 % in patients with anterior and apical infarctions in the prethrombolytic era. After thrombolytic therapy for an acute MI, the Gruppo Italiano per lo Studio della Sopravvivenza nell’Infarto Miocardio III (GISSI-3) investigators [94] reported visualization of LV thrombus on the predischarge echocardiogram in 5.1 % of patients (9 ± 5 days after symptom onset). Patients with an anterior MI had a fivefold higher prevalence of thrombus formation than did patients with other infarct locations (11.5 % versus 2.3 %, respectively). Worsening LV function and more extensive regional dysfunction are also recognized risk factors for LV thrombus [94]. Most thrombi occur within the first 2 weeks (median, 5–6 days) after an acute MI [95, 96]. However, with worsening LV function, new LV thrombus is identified in some patients after hospital discharge [96, 97].
When observed at the site of abnormal wall motion or within an aneurysm, thrombus appears as a mobile or an immobile opaque intracavitary mass (Fig. 10.8), which may be laminar or pedunculated or may protrude into the ventricular cavity [94, 98–100]. Thrombi are usually located at the apex and, less frequently, along the septum and the inferior regions of the heart [101]. In detecting LV thrombus, 2D transthoracic echocardiography has a sensitivity of 75–95 % and a specificity of 87–90 % [99, 100, 102] and is, therefore, the diagnostic method of choice. When the apex is poorly visualized with transthoracic echocardiography, administration of a contrast agent may help identify suspected apical thrombus by showing an absence of contrast in an LV cavity filled with contrast. In transesophageal echocardiography, the posterior position of the ultrasound probe limits visualization of the apex and, thus, detection of apical thrombus. The 2003 ACC/AHA/ASE task force gave a class I recommendation to the use of echocardiography for assessing mural thrombus after an acute MI [37, 38].
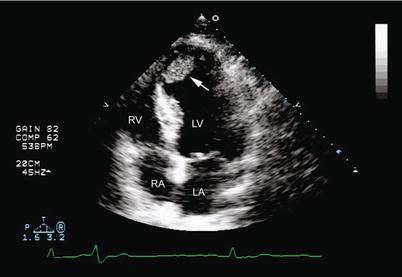
Fig. 10.8
Left ventricular mural thrombus. Two-dimensional imaging in the apical four-chamber view shows an echolucency in the left ventricular apex of a patient with a large apical infarct (arrow). RV right ventricle, RA right atrium, LV left ventricle, LA left atrium
In a series reported by Visser and colleagues [100], embolization occurred in 26 of 119 patients with documented LV thrombi after an MI. Thrombi that are protruding, pedunculated, or mobile within the ventricular cavity are the ones most likely to embolize, usually within 3 months after an acute MI [100, 102–104].
Papillary Muscle Rupture Producing Acute Mitral Regurgitation
Severe MR resulting from papillary muscle rupture is a rare and often fatal complication of an acute MI [105]. In the absence of prompt surgical intervention, the mortality of patients with this complication is as high as 50 % at 24 h [106, 107], which is nearly double the mortality seen in patients with a postinfarction VSD [108]. The median duration of survival is reportedly 3 days [109]. The anterolateral papillary muscle is rarely affected, because it has a dual blood supply from the LAD and LCX arteries [110]. Infarction of the posterior descending artery is associated with necrosis of the posteromedial papillary muscle, which produces sudden clinical and hemodynamic deterioration and fulminant acute left-sided heart failure. It is important to recognize that severe MR with complete rupture of the papillary muscle may occur in the absence of a cardiac murmur or in the presence of a very soft murmur; therefore, this diagnosis must be considered with a high index of suspicion in the appropriate clinical setting. It is crucial that a definitive diagnosis be reached rapidly in these cases. Two-dimensional echocardiography shows flail mitral leaflet with attachment of the mobile severed papillary muscle head, which prolapses into the left atrium in systole, and abnormal cutoff of one papillary muscle (Fig. 10.9a) [111, 112]. In up to 35 % of surgically confirmed cases, the partially ruptured papillary muscle cannot be observed to prolapse into the left atrium on transthoracic echocardiographic imaging [113]. Transesophageal echocardiography has become an invaluable technique for diagnosing acute MR that complicates an MI, especially in hemodynamically compromised patients in the intensive care unit, in whom transthoracic echocardiography imaging may be limited. Transesophageal echocardiographic imaging in the gastric long-axis and mid-esophageal four-chamber views can detect the origin of the regurgitant jet and clarify the anatomic profile of the mitral and submitral valvular apparatus (Fig. 10.9b) [98].
Fig. 10.9
Papillary muscle rupture. (a) Transesophageal imaging in the mid-esophageal four-chamber view shows prolapse of the severed head of the papillary muscle (arrow) into the left atrium (LA) during ventricular systole. The mitral subvalvular apparatus with the rupture of the papillary muscle head (arrow) is shown by two-dimensional imaging in the deep gastric long-axis view (b). LV left ventricle, MV mitral valve
Chronic Complications After Acute Myocardial Infarction
Ischemic Mitral Regurgitation
Mitral regurgitation caused by changes in left ventricular structure and function as a consequence of coronary ischemia is best described clinically as ischemic or functional MR [114]. Unlike organic MR (myxomatous, endocarditic, or rheumatic), ischemic MR is not a valve disease. Ischemic MR is the consequence of an imbalance between increased valvular tethering forces (papillary muscle displacement leading to a more apical position of the leaflets and their coaptation point) and reduced valvular closing forces (reduced contractility, dyssynchrony of the papillary muscles, dyssynchrony within the left ventricle) [115]. Although ischemic MR is usually a consequence of a previous infarction and chronic LV remodeling, this type of MR may also be precipitated by active ischemia, resulting in flash pulmonary edema or, rarely, rupture of the papillary muscle (see above). Ischemic MR is dynamic and varies with loading conditions.
Incidence
MR occurs in 20–25 % of patients followed up days to weeks after an MI [116–119] and in 50 % of those with congestive heart failure [120]. Moderate or severe MR is found in roughly 40 % of patients within 24 h of an acute MI complicated by cardiogenic shock [121]. However, angiographic detection of moderate-to-severe MR after an MI has been reported in only 3–4 % of cases [122, 123]. When evaluated by echocardiography within 30 days after an MI, moderate or severe MR was present in 12 % [124]. Mild MR has been reported in 50–64 % of post-MI patients undergoing echocardiography within 30 days after the MI [116–121, 123–125].
Mechanism
Mitral regurgitation after an acute MI is due primarily to segmental and global LV dysfunction, which causes chronic papillary muscle displacement, apical tethering of the mitral leaflets, annular dilatation, and decreased systolic mitral closing forces (Fig. 10.10) [114]. Elegant models of MR have shown that ischemia of the papillary muscle in the absence of infarction does not cause MR [114, 126–128]. Ischemic MR depends on a balance of forces and LV geometry and varies with loading conditions (Fig. 10.11) [129]. Characteristically dynamic in nature, MR may be elusive on transesophageal echocardiography in cardiac surgical patients under anesthesia [130–132]. In contrast, MR is likely underestimated by resting echocardiography in patients with LV dysfunction and symptoms of congestive heart failure in the absence of active ischemia [133–135]. With semisupine bicycle exercise, Pierard and Lancellotti [135] demonstrated a twofold increase in the MR volume (from mild to moderate-to-severe) and a corresponding increase in the orifice area (by >20 mm2) in nearly 30 % of patients. Exercise-increased MR also correlated with an increased pulmonary artery pressure and conferred an adverse prognosis [135]. The degree of exercise-induced increase or decrease in MR relates to changes in LV remodeling and valvular deformation and also to changes in LV and papillary muscle spatial relationships.
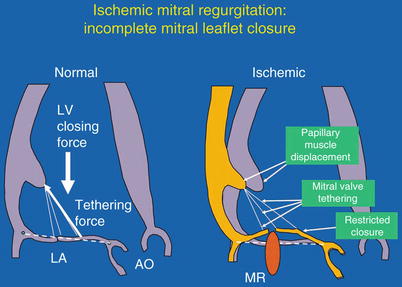
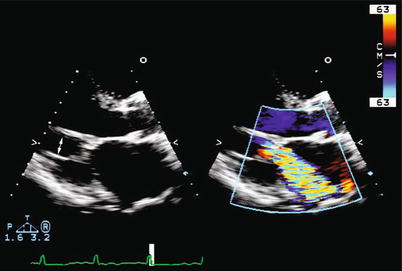
Fig. 10.10
Mechanism of ischemic mitral regurgitation. Left: The balance of forces acting on the mitral leaflets in systole. LA left atrium, LV left ventricle, AO aorta. Right: Effect of papillary muscle displacement and mitral-leaflet tethering to restrict mitral-leaflet closure. MR mitral regurgitation (From Levine and Schwammenthal [114]. Reprinted with permission from Wolters Kluwer Health)
Fig. 10.11
Ischemic mitral regurgitation. Two-dimensional imaging in the parasternal long-axis view showing apical tethering of the chordae tendineae (left, arrow) and the resultant jet of mitral regurgitation (right) caused by incomplete mitral-leaflet closure
Echocardiographic Evaluation of Ischemic Mitral Regurgitation
Doppler echocardiography is the most useful screening modality for ischemic MR. Assessment of MR by color jet area is qualitative, varies with instrument settings and hemodynamic load, and has poor reproducibility. The jet area does not correlate well with measures of regurgitant volume, which have reliably been shown to predict mortality in patients with CAD. Measurement of the effective regurgitant orifice (ERO) area is the most reliable index of MR severity. The mitral ERO area can be closely approximated by measuring the width of the vena contracta, defined as the narrowest cross-sectional area of a jet (Fig. 10.12) as it passes through the orifice. The area of the vena contracta is the effective orifice area. Vena contracta measurement by color-flow mapping is simple and accurately reflects regurgitant flow independently of hemodynamic variables and instrument settings. The vena contracta can best be measured by 2D echocardiography in the parasternal long-axis view or apical three-chamber view, where the color jet is perpendicular to the ultrasound beam. Three-dimensional echocardiography allows direct planimetry of the vena contracta and greatly improves accuracy in assessing the ERO area [136]. Vena contracta widths of >0.7 cm indicate severe MR, and widths of <0.3 cm usually reflect mild MR [137]. Quantification is recommended by the updated 2011 Guidelines of the European Society of Echocardiography [138] and the 2003 ASE recommendations for the assessment of valvular regurgitation [139].
Fig. 10.12
Schematic diagram (parasternal long-axis view) of a mitral-regurgitation (MR) jet. Left: Schematic of a parasternal long-axis view of an MR jet. Right: Zoom mode, showing the vena contracta as the narrowest portion of the jet, just downstream from the orifice (arrows). PFC proximal flow convergence (From Hall et al. [137]. Reprinted with permission from Wolters Kluwer Health)
Quantitative methods of evaluating ischemic MR include the Doppler volumetric method and the flow-convergence method. On Doppler volumetric assessment, the regurgitant volume is calculated as the difference between the mitral and aortic stroke volumes. Doppler volumetric assessment is dependent on accurate 2D measurements of the LV outflow tract and the mitral annulus and is, thus, dependent on good image quality. This method gives an estimate of the mean ERO area throughout systole and is independent of dynamic variations in the ERO area and orifice geometry [140]. The flow-convergence method, or proximal isovelocity surface area (PISA) measurement, is the most practical and widely used method clinically. Regurgitant valvular lesions produce a measureable acceleration of flow into hemispheric zones on the side of the valve opposite the direction of regurgitant flow. This zone of flow can be calculated as the PISA and is directly related to the size of the regurgitant orifice and to the amount of regurgitation.
With dynamic ischemic MR, flow convergence with a hemi-elliptical shape results in mathematical underestimation of the ERO area and regurgitant volume. Severe ischemic MR has been defined as a regurgitant volume of >30 mL and an ERO area of >20 mm2 [125, 138]. For ischemic MR, the threshold for severity is significantly lower than for organic MR (regurgitant volume >60 mL or ERO area >0.4 mm2). This reflects marked worsening of outcomes with lower regurgitant volumes and ERO areas in ischemic MR and inherent underestimation of the calculation. The most reliable echocardiographic calculation of the regurgitant volume and ERO area, although time-consuming, may be averaging of the quantitative Doppler and the PISA methods [115].
Ventricular Aneurysm
After an acute, usually anterior, MI [104, 141], a true LV aneurysm develops in up to 20 % of patients, owing to gradual expansion and thinning of all three layers of the infarcted myocardium [142]. The incidence of true LV aneurysm has decreased as reperfusion therapies have improved and become widespread [143]. The usual time of aneurysm formation is within 3 months after the onset of an MI. True LV aneurysms almost always involve the LV apex and extend into the anterior or anterolateral walls (Fig. 10.13a). Rarely, true aneurysms are found in the basal inferior or high lateral wall (Fig. 10.13b). Aneurysms are usually the consequence of LAD occlusion and are rarely present with multivessel CAD and extensive collateralization.
Fig. 10.13
Left ventricular aneurysm (LVA). Two-dimensional imaging in the four-chamber apical view (a) shows a thin distal septum and apical LV segment with a hinge point (arrow) that demarcates the transition from contractile tissue to the aneurysmal segment. (b) Two-dimensional imaging in the two-chamber view identifies an aneurysm of the inferior base (arrowheads) and an apical thrombus (arrow), which is present in up to one third of patients with acute myocardial infarction
Two-dimensional echocardiography has a sensitivity of >93 % [144] and a specificity of 94 % in the detection of LV aneurysms. The characteristic echocardiographic finding is a thin LV wall that fails to thicken during systolic contraction, producing a “bulge” during systole and diastole [142, 145]. A common finding is a hinge point (Fig. 10.13a), or junction, between the contractile LV tissue and the akinetic, often paradoxically moving aneurysm. True LV aneurysms distort LV geometry during both systole and diastole [144]. Doppler echocardiography can be used to detect a low-velocity flow profile characterized by a “swirling” motion typical of low cardiac flow within the aneurysm. Thrombus within the aneurysmal segment is detected echocardiographically in at least a third of patients with LV aneurysms (Fig. 10.13b) [146, 147], and such thrombus may account for the increased risk of stroke in the 5 years after an acute MI [148]. Deposition of fibrous tissue and calcium in the aneurysmal segment over time prevents rupture of a chronic LVA, unlike a pseudoaneurysm [149, 150]. Left ventricular aneurysms contribute to chronic cardiac decompensation with congestive heart failure, ventricular arrhythmias, and systemic emboli.
Compared to medical therapy alone, surgical repair of LV aneurysms in selected patients improves survival, functional class, and symptoms [151]. Two-dimensional echocardiography has been used to evaluate the efficacy of aneurysmectomy in patients with ventricular aneurysms. Ryan and colleagues [141] found that a fractional shortening of >17 % in the uninvolved myocardium (measured at the base of the heart) was associated with an improved surgical outcome, whereas a fractional shortening of <17 % entailed no subsequent clinical or surgical improvement.
Left Ventricular Remodeling
After an MI, the left ventricle will accommodate to the loss of regional myocardial function by increasing the contractile state of the remaining viable segments. Left ventricular remodeling is clinically characterized as a change in cardiac size, shape, and function as a result of myocardial injury or an increased load [152, 153]. The severity of the regional dysfunction (infarct size) [154, 155], function of the remaining segments, neurohormonal activation, and presence of coexisting valvular heart disease, particularly MR, will determine the magnitude of LV remodeling [114]. This process usually begins within the first few hours after the infarct and progresses over time [156–158]. Disproportionate thinning and dilatation of the infarcted segment after an MI is defined as infarct expansion and is accompanied by gross distortion of the LV shape and volume [159, 160] and loss of functional myocardium that initially contracted normally [161]. With remodeling, the left ventricle dilates, becomes more spherical, and declines in function [162]. Alterations in LV geometry lead to ischemic MR, which further increases LV volumes and diastolic wall stress, activates the neurohumoral cascade, and further decreases LV contractility, thus leading to a cycle of LV remodeling and MR [114]. The important relationship between LV function and MR is reflected in the poor survival of post-MI patients in whom both significant MR and severe LV dysfunction coexist (Fig. 10.14) [121].
Fig. 10.14
Survival after myocardial infarction is dependent on both the left ventricular ejection fraction (LVEF) and the severity of mitral regurgitation (MR). Kaplan-Meier estimates of survival up to 1 year after randomization for four combinations of LVEF and MR in the SHOCK trial. Total n = 90; MR 0/1 and LVEF >28 %, n = 33; MR 0/1 and LVEF <28 %, n = 20; MR 2/3/4 and LVEF ≥28 %, n = 16; MR 2/3/4 and LVEF <28 %, n = 21 (From Picard et al. [121]. Reprinted with permission from Wolters Kluwer Health)
Echocardiographic assessment of LV remodeling after an AMI includes 2D measurements of the LVEF and the LV size, shape, and volume at end-diastole and end-systole and should also include Doppler estimation and quantification of MR severity.
Prognosis in Acute Myocardial Infarction and Chronic Coronary Artery Disease
In patients with CAD, the prognosis is related to the extent of myocardial damage, the magnitude of the resultant LV remodeling, the LV filling pressures, and the degree of residual coronary ischemia and viability. As a cardiac imaging modality, echocardiography is uniquely suited for the routine examination of each of these important predictors of outcome. Two-dimensional echocardiography can be used to identify patients with acute MI who are at high risk for short-term complications in the hospital and for long-term complications after hospital discharge [163–166]. Horowitz and Morganroth [164] found that echocardiography had a sensitivity of 83 % and a specificity of 85 % in identifying patients at high risk for in-hospital complications. The 2011 ACC/AHA/ASE appropriate-use task force classified as appropriate the use of echocardiography for the initial evaluation of ventricular function and for follow-up reevaluation when the results are used to guide therapy [39].
The 2003 ACC/AHA/ASE guidelines gave a class I recommendation to the use of echocardiography for in-hospital assessment of ventricular function and a class IIa recommendation (weight of evidence/opinion is in favor of usefulness/efficacy) for assessment of ventricular function after revascularization [38]. The 2004 ACC/AHA STEMI guidelines recommended echocardiography for LV functional assessment of postinfarct patients without left ventricular angiography [58].
Ventricular Systolic Function
Left Ventricular Systolic Function
The extent of myocardial damage can be measured globally as the LVEF or regionally as the wall-motion score index. Both parameters have been shown to correlate with the outcome in patients with an acute MI or chronic CAD (Fig. 10.15) [31, 33, 167, 168]. Nishimura and colleagues [165] found that patients with a higher wall-motion score index were more likely to have cardiovascular complications at follow-up examination. In the setting of acute coronary syndrome, LV systolic dysfunction increases the long-term mortality, and it also increases the probability of multivessel CAD by 50 % [169]. Early measurements of the LVEF after an MI may be misleading in patients who undergo successful reperfusion. Recovery of the LVEF from myocardial stunning usually occurs between day 3 and day 14 after an MI. Complete or partial recovery of the LVEF (>5 %) was noted by Solomon and colleagues in 58 % of 249 patients with serial echocardiographic studies after MI.
Fig. 10.15
Left ventricular systolic function predicts mortality after myocardial infarction. Relation of rest ejection fraction to all-cause mortality in 3,197 patients enrolled in the TIMI II study. Kaplan-Meier analysis of the mortality rate related to time from study entry, with patients categorized according to ejection fraction. Mortality rate is highest in patients with ejection fraction of <30 % (9.9 %) (From Zaret et al. [289]. Reprinted with permission)
For patients who presented with cardiogenic shock, Picard and coauthors [121] found that the LVEF and severity of MR were the only independent echocardiographic predictors of both early and late survival. Survival at 1 year was 24 % in those with an LVEF of <28 % but was 56 % for those with a higher LVEF [121].
Right Ventricular Systolic Function
In 416 patients with LV dysfunction (LVEF <40 %) after an MI, Zornoff and associates [170] found that persistent RV dysfunction decreased overall survival. Right ventricular systolic function correlated weakly with LV systolic function. However, RV function, measured as a fractional area change, was an independent predictor of mortality, cardiovascular mortality, and congestive heart failure. Each 5 % decrease in RV fractional area change increased the odds of cardiovascular mortality by 16 % (Fig. 10.16).
Fig. 10.16
Right ventricular dysfunction following myocardial infarction decreases survival. Cumulative percent survival of patients with and those without right ventricular (RV) dysfunction measured as fractional area change (FAC). RV dysfunction = FAC <32.2 %; normal RV function = FAC >32.3 %. HR hazard ratio (From Zornoff et al. [170]. Reprinted with permission from Elsevier Limited)
Left Ventricular Remodeling
Left ventricular remodeling can be characterized and quantified by 2D echocardiographic measurements of LV size and volume. The prognosis is related to the extent of LV remodeling. After an acute MI, small increases in the LV volume (particularly the LV end-systolic volume) [171, 172] or decreases in the LVEF [173] increase the risk of death and congestive heart failure [171, 174].
In several studies, in-hospital evaluation of the postinfarct LVEF and the extent of the RWMA, but not LV dilatation, predicted progressive LV remodeling [158, 161]. In the Beta-blocker Evaluation of Survival Trial (BEST), however, Grayburn and colleagues [175] found that LV volume and MR were the best predictors of outcome in patients with LV dysfunction.
Mitral Regurgitation
The presence and severity of ischemic MR has been shown to worsen survival in patients with acute MI and chronic CAD with or without LV dysfunction [117, 119, 121–124, 176–178]. Mitral regurgitation that follows an acute MI is an important independent predictor of early and late death [119, 123]. In the Survival and Ventricular Enlargement (SAVE) trial [27], any degree of MR detected within days after an MI was associated with a poorer outcome, which was independent of treatment with angiotensin-converting-enzyme inhibitors (Fig. 10.17a). In the elegant studies by Grigioni and coworkers [125, 179] survival correlated with the severity of MR, quantified as the ERO area and regurgitant volume (Fig. 10.17b). These authors demonstrated that an ERO area of ≥20 mm2 or a regurgitant volume of >30 mL predicted >2× mortality compared with that observed in patients without MR. This mortality level coincides with an ERO area of ≥40 mm2 for predicting a poor outcome in patients with degenerative valve disease [117]. These findings suggest that the mortality associated with ischemic MR is greater than that seen in patients with similar degrees of organic leaflet MR. The mortality rate increases when ischemic MR is worse than mild.
Fig. 10.17
Mitral regurgitation (MR) worsens survival after myocardial infarction. (a) Kaplan-Meier curves of cardiovascular survival in patients with and without MR following acute myocardial infarction (MI) in the Survival and Ventricular Enlargement Study. (b) Decreased survival following MI with increasing severity of MR. Degree of MR quantified by effective regurgitant orifice area (EROA); mild if EROA <20 mm2; moderate or greater if EROA ≥20 mm2. Numbers at bottom indicate patients at risk each interval (From Lamas et al. [119]. Reprinted with permission from Wolters Kluwer Health. And from Grigioni et al. [125]. Reprinted with permission from Wolters Kluwer Health)
In the echocardiographic substudy of the SHOCK trial (SHould we emergently revascularize Occluded Coronaries in cardiogenic shocK?) [121], the only independent multivariate predictors of either 30-day or 1-year mortality in patients with cardiogenic shock after an acute MI were moderate or greater MR severity and an LVEF of <28 % (Fig. 10.14). For patients with moderate or severe MR, the 1-year survival rate was 31 % compared to 58 % for those with mild or no MR. This outcome is comparable to the mortality of 52 % at 1 year and 24 % at 30 days that Tcheng and colleagues [123] documented in assessing 50 patients with moderately severe to severe (3+ to 4+) MR on routine angiography during an acute MI (total, 1,485 patients). In these studies, MR severity was associated with increasing LV volumes, which underlie and contribute to the mechanism of MR after an acute MI.
Elevated Left Ventricular Filling Pressures
In patients with acute MI and chronic CAD, elevated LV filling pressures are the consequence of LV dysfunction, MR, and adverse ventricular loading conditions. Left ventricular filling pressures have been shown to predict the short- and long-term outcome in patients with CAD. Elevated filling pressures may be characterized echocardiographically as a shortened deceleration time (DT) of mitral early inflow velocity (DT <150 ms), an increased ratio of early (E) to late (A) LV diastolic filling velocities (mitral inflow E/A >2), and pulmonary venous diastolic flow predominance. Additionally, the left atrial volume, when indexed to the body surface area (>28 mL/m2), reflects the severity and duration of elevated LV filling pressures and is a powerful predictor of survival after an acute MI [180].
A meta-analysis of 3,396 patients in 12 prospective studies confirmed that all-cause mortality (hazard ratio, 2.7; 95 % confidence interval, 2.2–3.2) was heightened in postinfarct patients with a restrictive mitral inflow pattern (DT <160 ms). Restrictive filling also predicted mortality within each quartile of the LVEF and remained an independent predictor in multivariate analysis, along with age, gender, and LVEF [180].
Measurements utilizing TDI provide incremental prognostic information in patients with CAD or congestive heart failure [181–183]. After an acute MI, the ratio of the early diastolic mitral filling velocity to the early diastolic tissue velocity of the mitral annulus (E/e′ 15), (Fig. 10.18a) [182], as well as the maximal peak tissue systolic velocity and peak early diastolic tissue velocity (Fig. 10.18b) [181], when added to other echocardiographic variables, further predicts survival.
Fig. 10.18
Elevated left ventricular filling pressures predict survival after myocardial infarction. (a) Ratio of early mitral diastolic velocity to diastolic annular tissue velocity (E/e′) predicts survival. Kaplan-Meier plot demonstrates improved survival for patients with an E/e′ ratio of ≤15. (b, c) Peak LV annular velocities in both systole and diastole predict survival after MI. Cumulative cardiac death by tertiles of the early mitral annulus diastolic velocity (b) and mitral annulus systolic velocity (c) (From Hillis et al. [182]. And from Wang et al. [181]. Reprinted with permission from Elsevier Limited)
Stress Echocardiography: Assessment of Ischemic and Viable Myocardium
Stress echocardiography is routinely used to document the presence of CAD, to identify the location and extent of myocardial ischemia, to risk-stratify patients with known CAD, and to assess myocardial viability in regions of myocardial dysfunction.
Basic Principles and Definitions
Ischemia is characterized by hypoperfusion of myocardial cells and can occur at rest or after stress. Viable myocardial cells are living cells. Viable myocardium is easily identified when it contracts normally. Dysfunctional, but living, tissue—as contrasted to necrotic tissue—is the more common and clinically relevant description of viable myocardium. Ischemia produces regional myocardial dysfunction within seconds. Experimental studies have shown that the duration and severity of an ischemic insult is the major determinant of both functional and metabolic myocardial recovery [184]. Severe regional LV dysfunction, leading to depression of LV systolic function in patients with CAD, can result from myocardial necrosis, postischemic stunning, or myocardial hibernation. “Stunning” refers to contractile dysfunction in viable myocardium that results from transient ischemia followed by reperfusion [14]. “Hibernating” myocardium refers to myocardial tissue that is persistently hypocontractile secondary to chronic or repetitive low coronary perfusion [185]. Hibernating myocardium has been described as an adaptation to severe and chronic ischemia; this adaptation increases the risk of sudden death even in the absence of infarction [186]. Recovery of hibernating myocardium is characteristically late (two of three segments recovering in >3 months) after reperfusion.
Interpretation
A new RWMA provoked by stress indicates cardiac ischemia. Improved contractility of myocardial segments with abnormal baseline function on inotropic stimulation is characteristic of viable but dysfunctional myocardium. A dysfunctional segment may show one of four responses: (1) an improvement in contractility (contractile reserve) that further improves with maximum stimulation; (2) no improvement (nonviable); (3) worsening function (ischemic); or (4) improvement with low-dose inotropic stimulation that becomes dysfunctional at higher doses of inotropic stimulation [8]. This biphasic response is characteristic of viable segments that become ischemic at higher levels of stress. Table 10.2 summarizes the myocardial segments’ responses to stress.
Table 10.2
Myocardial segment response to stress
Resting segment function | Stress | Interpretation | Likelihood of functional recovery | ||
|---|---|---|---|---|---|
Exercise | Low dose | Peak dose | |||
Normal | ↑ | ↑ | ↑↑ | Normal | n/a |
Normal | ↓ | ↑ | ↓ | Ischemic | n/a |
Abnormala | – | ↑ | ↓ | Ischemic and viable; “biphasic” | High |
Abnormal | ↓ | ↓ | ↓ | Ischemic, viable | Moderate |
Abnormal | ↑ | ↑ | ↑↑ | Nonischemic, viable | Low |
Abnormal | No ∆ | No ∆ | No ∆ | Nonviable, scar | Low |
Methodology
Analysis of stress echocardiograms is predominantly based on qualitative comparison of regional wall motion at baseline and during stress. Semiquantitative assessment of RWMAs by determining the wall-motion score index (described above) is recommended. Newer techniques for quantitating regional LV systolic function include TDI and its derivative, strain-rate imaging. Because regional myocardial dysfunction occurs within seconds of acute transient ischemia, and because recovery usually occurs within 2–3 min, imaging can be done after stress if performed rapidly. Stress echocardiography can be performed using either exercise or pharmacologic stress, depending on patient ability, laboratory preference, and the reason for clinical study (Table 10.3). The accuracy of stress echocardiography is dependent on visualization of all myocardial segments and evaluation of myocardial thickening and regional wall motion. Myocardial contrast agents, which opacify the LV cavity and better define endocardial borders, enhance the detection of RWMAs. Tissue harmonic imaging and digital image acquisition, which allow comparison of side-by-side optimized images of representative cardiac cycles with reduced respiratory interference (particularly at peak stress), have further improved the discrimination of subtle wall-motion abnormalities at various stress stages. Because the accuracy of image interpretation remains subjective, physician experience is a major determinant of the accuracy of stress echocardiography [187].
Table 10.3
Selection of stress echocardiography protocols for clinical decision-making
Clinical indication | Stress echo protocol | ||
|---|---|---|---|
TME | Bicycle | Dobutamine | |
Chest pain | + | + | ± |
Post MI | + | + | + |
Myocardial viability | – | ± | ++ |
Dyspnea | + | + | ± |
Valve disease: | |||
MR | + | ++ | |
MS | ++ | + | |
AS | ++ | + | |
AI | ++ | ||
Pulmonary artery pressure | – | ++ | – |
Preoperative risk assessment | ± | ± | + |
Treadmill Stress Echocardiography
Exercise protocols generally consist of either treadmill exercise or upright or supine bicycle exercise. Baseline images are acquired before and after exercise in four standard views: parasternal long-axis (or apical three-chamber), parasternal short-axis at the level of the papillary muscles, apical four-chamber, and apical two-chamber. Exercise is performed according to a standard exercise protocol to achieve at least 85 % of the patient’s age-predicted maximal heart rate and/or a rate-pressure product of at least 20,000. The heart rate, blood pressure, and electrocardiogram are monitored throughout the test at each stage of exercise (Table 10.4). Only postexercise imaging is available with treadmill exercise. Therefore, rapid acquisition (within 60–90 s) of postexercise images is imperative to prevent resolution of an inducible RWMA and, thus, a false-negative result. The advantages of treadmill stress testing include the widespread availability of treadmill equipment and the independent prognostic information obtained from exercise treadmill testing.
Table 10.4
Exercise echocardiography protocols
Protocols | Baseline Images ± Doppler | Exercise imaging | Immediate (<1-min) post-exercise imaging | Advantages | Limitations |
|---|---|---|---|---|---|
Treadmill | √ | X | √ | High workload; widely available; exercise itself is prognostic: | Imaging can be done only post exercise |
Duration | |||||
ECG | |||||
Symptoms | |||||
Bicycle | √ | √ | √ | Images during exercise | Lower workload; |
Difficult for patient |
Bicycle Stress Echocardiography
A stationary bicycle, either upright or supine, can also be used for exercise stress echocardiography. As in treadmill testing, baseline images are acquired before exercise. Patients then pedal against progressively increasing resistance; the blood pressure, heart rate, and electrocardiogram are monitored throughout the test at each stage of exercise. A typical bicycle protocol would increase the workload by 25 W every 3 min until an endpoint is achieved. One advantage of supine bicycle testing is that images can be acquired during exercise. Transient wall-motion abnormalities may be detected with imaging through multiple stages and may allow the detection of viable segments. The disadvantage is that many patients find bicycling in the supine position awkward and cumbersome, so may be unable to achieve optimal stress levels (Table 10.4). However, the onset of ischemia appears to occur sooner in the supine position, perhaps because of the increased venous return, preload, or blood pressure associated with supine bicycling [188]. According to the 2007 ASE guidelines, bicycle exercise stress is preferred over treadmill exercise if stress Doppler information is desired. Bicycle exercise offers the advantage of allowing Doppler as well as wall-motion evaluation during each stage of exercise [189].
Pharmacologic Stress Echocardiography
If a patient is unable to exercise, stress is induced with a pharmacologic agent such as dobutamine, adenosine, or dipyridamole. Dobutamine, the most commonly used agent, stimulates β1, β2, and α-adrenergic receptors, resulting in both inotropic and chronotropic stimulation. The half-life of dobutamine is 2 min, and its onset of action occurs within 1–2 min of intravenous infusion. The drug is rapidly metabolized via methylation and conjugation. Because of dose-dependent differences in affinity for the different receptors, low doses produce a predominantly inotropic response, and increasing doses augment the chronotropic response. Images are acquired at baseline and after administration of graded doses of dobutamine, beginning with 5–10 mcg/kg/min and increasing the dose every 3–5 min, until reaching a maximum dose of 40 mcg/kg/min, or until 85 % of the maximum age-adjusted (220-age) heart rate is obtained. In up to 25 % of patients [190], atropine (0.5–2.0 mg) is used in conjunction with dobutamine to augment the heart rate response, especially in β-blocker recipients, in whom this response may be blunted.
Figure 10.19 summarizes the DSE protocol. Neither the electrocardiogram nor the hemodynamic response to pharmacologic stress testing is diagnostic or prognostic. Hypotension during DSE may be related to (1) decreased systemic vascular resistance associated with a β2 agonist response; (2) LV outflow tract (LVOT) obstruction produced by systolic anterior motion of the mitral valve associated with increasing LVOT velocity and reduction in LV systolic cavity size; (3) hypovolemia; or (4) severe (usually multivessel) ischemia. Contraindications to DSE include unstable coronary syndromes, severe arrhythmia, marked systemic hypertension, severe aortic stenosis, aortic aneurysm, and resting LVOT obstruction (Table 10.5). Testing is terminated when the patient has completed the protocol and achieved >85 % of the maximal predicted heart rate (MPHR) or if a new RWMA develops in two or more segments. Development of a significant arrhythmia, LVOT obstruction of >4 m/s, or significant hypotension or hypertension should lead to cessation of the dobutamine infusion and termination of the test (Table 10.6).
Fig. 10.19
Dobutamine stress echocardiography (DSE) protocol. 2D two-dimensional, MPHR maximal predicted heart rate
Table 10.5
Dobutamine stress echocardiography
Indications | Contraindications |
|---|---|
Patient unable to exercise | Unstable coronary syndrome |
Graded stress imaging | Severe arrhythmia |
Identification of viability | Severe hypertension |
Severe aortic stenosis | |
Aortic aneurysm or dissection | |
Resting LVOT obstruction |
Table 10.6
Dobutamine stress echocardiography endpoints
Completed protocol |
Achieved target heart rate: >85 % of (220-age in years) |
Cardiac endpoints |
Angina |
New WMA in ≥2 segments |
Arrhythmia: |
Ventricular tachycardia |
Atrial fibrillation with rapid response |
Supraventricular tachycardia
Stay updated, free articles. Join our Telegram channel
Full access? Get Clinical Tree
 Get Clinical Tree app for offline access

|