ECG Leads

Chapter 3 ECG Leads


Please go to expertconsult.com for supplemental chapter material.


As discussed in Chapter 1, the heart produces electrical currents similar to the familiar dry cell battery. The strength or voltage of these currents and the way they are distributed throughout the body over time can be measured by a suitable recording instrument such as an electrocardiograph.


The body acts as a conductor of electricity. Therefore, recording electrodes placed some distance from the heart, such as on the arms, legs, or chest wall, are able to detect the voltages of the cardiac currents conducted to these locations.


The usual way of recording these voltages from the heart is with the 12 standard ECG leads (connections or derivations). The leads actually show the differences in voltage (potential) among electrodes placed on the surface of the body.


Taking an ECG is like recording an event, such as a baseball game, with an array of video cameras. Multiple camera angles are necessary to capture the event completely. One view is not enough. Similarly, multiple ECG leads must be recorded to describe the electrical activity of the heart adequately. Figure 3-1 shows the ECG patterns that are obtained when electrodes are placed at various points on the chest. Notice that each lead (equivalent to a different camera angle) presents a different pattern.


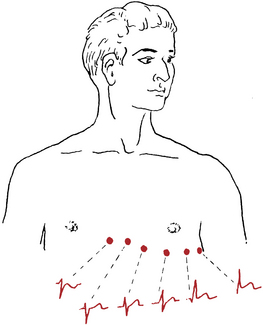
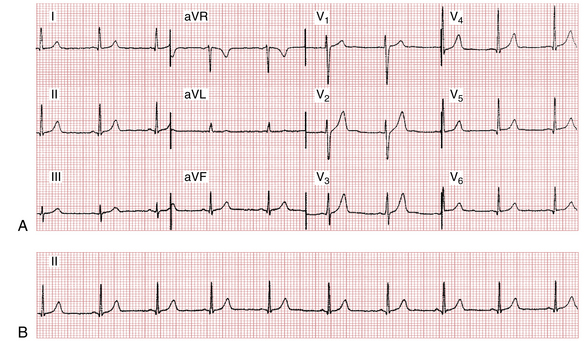
Figure 3-2 is an ECG illustrating the 12 leads. The leads can be subdivided into two groups: the six limb (extremity) leads (shown in the left two columns) and the six chest (precordial) leads (shown in the right two columns).


The six limb leads—I, II, III, aVR, aVL, and aVF—record voltage differences by means of electrodes placed on the extremities. They can be further divided into two subgroups based on their historical development: three standard bipolar limb leads (I, II, and III) and three augmented unipolar limb leads (aVR, aVL, and aVF).


The six chest leads—V1, V2, V3, V4, V5, and V6—record voltage differences by means of electrodes placed at various positions on the chest wall.


The 12 ECG leads or connections can also be viewed as 12 “channels.” However, in contrast to television channels (which can be tuned to different events), the 12 ECG channels (leads) are all tuned to the same event (the P-QRS-T cycle), with each lead viewing the event from a different angle.


Limb (Extremity) Leads


Standard Limb Leads: I, II, and III


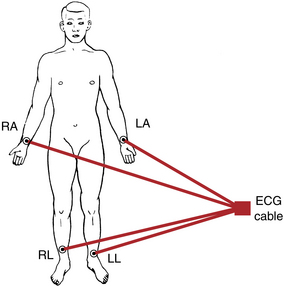
The extremity leads are recorded first. In connecting a patient to an electrocardiograph, first place metal electrodes on the arms and legs. The right leg electrode functions solely as an electrical ground, so you need concern yourself with it no further. As shown in Figure 3-3, the arm electrodes are attached just above the wrist and the leg electrodes are attached above the ankles.


The electrical voltages of the heart are conducted through the torso to the extremities. Therefore, an electrode placed on the right wrist detects electrical voltages equivalent to those recorded below the right shoulder. Similarly, the voltages detected at the left wrist or anywhere else on the left arm are equivalent to those recorded below the left shoulder. Finally, voltages detected by the left leg electrode are comparable to those at the left thigh or near the groin. In clinical practice the electrodes are attached to the wrists and ankles simply for convenience.


As mentioned, the limb leads consist of standard bipolar (I, II, and III) and augmented (aVR, aVL, and aVF) leads. The bipolar leads were so named historically because they record the differences in electrical voltage between two extremities.


Lead I, for example, records the difference in voltage between the left arm (LA) and right arm (RA) electrodes:


image


Lead II records the difference between the left leg (LL) and right arm (RA) electrodes:


image


Lead III records the difference between the left leg (LL) and left arm (LA) electrodes:


image


Consider what happens when the electrocardiograph records lead I. The LA electrode detects the electrical voltages of the heart that are transmitted to the left arm. The RA electrode detects the voltages transmitted to the right arm. Inside the electrocardiograph the RA voltages are subtracted from the LA voltages, and the difference appears at lead I. When lead II is recorded, a similar situation occurs between the voltages of LL and RA. When lead III is recorded, the same situation occurs between the voltages of LL and LA.


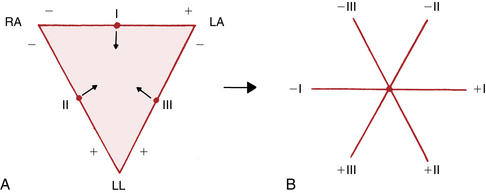
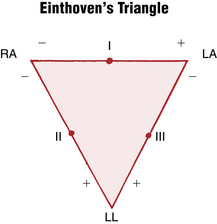
Leads I, II, and III can be represented schematically in terms of a triangle, called Einthoven’s triangle after the Dutch physiologist (1860-1927) who invented the electrocardiograph. At first the ECG consisted only of recordings from leads I, II, and III. Einthoven’s triangle (Fig. 3-4) shows the spatial orientation of the three standard limb leads (I, II, and III). As you can see, lead I points horizontally. Its left pole (LA) is positive and its right pole (RA) is negative. Therefore, lead I = LA − RA. Lead II points diagonally downward. Its lower pole (LL) is positive and its upper pole (RA) is negative. Therefore, lead II = LL − RA. Lead III also points diagonally downward. Its lower pole (LL) is positive and its upper pole (LA) is negative. Therefore, lead III = LL − LA.


Einthoven, of course, could have hooked the leads up differently. Yet because of the way he arranged them, the bipolar leads are related by the following simple equation:


image


In other words, add the voltage in lead I to that in lead III and you get the voltage in lead II.


You can test this equation by looking at Figure 3-2. Add the voltage of the R wave in lead I (+9 mm) to the voltage of the R wave in lead III (+4 mm) and you get +13 mm, the voltage of the R wave in lead II. You can do the same with the voltages of the P waves and T waves.


It is a good practice to scan leads I, II, and III rapidly when you first look at a mounted ECG. If the R wave in lead II does not seem to be the sum of the R waves in leads I and II, this may be a clue that the leads have been recorded incorrectly or mounted improperly.


Einthoven’s equation is simply the result of the way the bipolar leads are recorded; that is, the LA is positive in lead I and negative in lead III and thus cancels out when the two leads are added:


image


image


image


Thus, in electrocardiography, one plus three equals two.


In summary, leads I, II, and III are the standard (bipolar) limb leads, which historically were the first invented. These leads record the differences in electrical voltage among extremities.


In Figure 3-5, Einthoven’s triangle has been redrawn so that leads I, II, and III intersect at a common central point. This was done simply by sliding lead I downward, lead II rightward, and lead III leftward. The result is the triaxial diagram in Figure 3-5B. This diagram, a useful way of representing the three bipolar leads, is employed in Chapter 5 to help measure the QRS axis.


Jun 11, 2016 | Posted by in CARDIOLOGY | Comments Off on ECG Leads

Full access? Get Clinical Tree

Get Clinical Tree app for offline access