Chapter 2 ECG Basics Waves, Intervals, and Segments
Please go to expertconsult.com for supplemental chapter material.
Depolarization and Repolarization
In Chapter 1, the term electrical activation (stimulation) was applied to the spread of electrical signals through the atria and ventricles. The more technical term for the cardiac activation process is depolarization. The return of heart muscle cells to their resting state following stimulation (depolarization) is called repolarization.
These key terms are derived from the fact that normal “resting” myocardial cells (atrial and ventricular cells recorded between heartbeats) are polarized; that is, they carry electrical charges on their surface. Figure 2-1A shows the resting polarized state of a normal atrial or ventricular heart muscle cell. Notice that the outside of the resting cell is positive and the inside is negative (about –90 mV [millivolt] gradient between them).∗
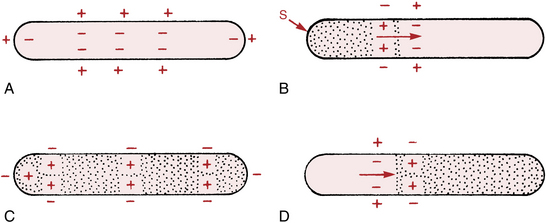
When a heart muscle cell is stimulated, it depolarizes. As a result the outside of the cell, in the area where the stimulation has occurred, becomes negative and the inside of the cell becomes positive. This produces a difference in electrical voltage on the outside surface of the cell between the stimulated depolarized area and the unstimulated polarized area (Fig. 2-1B). Consequently, a small electrical current is formed that spreads along the length of the cell as stimulation and depolarization occur until the entire cell is depolarized (Fig. 2-1C). The path of depolarization can be represented by an arrow, as shown in Figure 2-1B.
After a time the fully stimulated and depolarized cell begins to return to the resting state. This is known as repolarization. A small area on the outside of the cell becomes positive again (Fig. 2-1D), and the repolarization spreads along the length of the cell until the entire cell is once again fully repolarized. Ventricular repolarization is recorded by the ECG as the ST segment, T wave, and U wave. (Atrial repolarization is usually obscured by ventricular potentials.)
Basic ECG Waveforms: P, QRS, ST-T, and U Waves
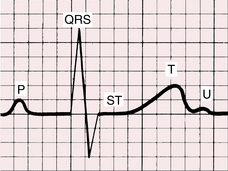
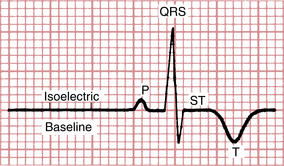
The spread of stimuli through the atria and ventricles followed by the return of stimulated atrial and ventricular muscle to the resting state produces the electrical currents recorded on the ECG. Furthermore, each phase of cardiac electrical activity produces a specific wave or complex (Fig. 2-2). The basic ECG waves are labeled alphabetically and begin with the P wave:
• P wave—atrial depolarization (activation)
• QRS complex—ventricular depolarization (activation)
• ST segment, T wave, and U wave—ventricular repolarization (recovery)
You may have asked why no wave or complex represents the return of stimulated atria to their resting state. The answer is that the atrial ST segment (STa) and atrial T wave (Ta) are generally not observed on the routine ECG because of their low amplitudes. An important exception is described in Chapter 10 in the discussion of acute pericarditis, which often causes PR segment deviation.
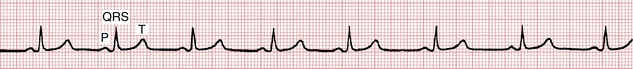
In summary, the P-QRS-T sequence represents the repetitive cycle of the electrical activity in the heart, beginning with the spread of a stimulus through the atria (P wave) and ending with the return of stimulated ventricular muscle to its resting state (ST-T sequence). As shown in Figure 2-3, this cardiac cycle repeats itself again and again.
ECG Graph Paper
The P-QRS-T sequence is usually recorded on special ECG graph paper that is divided into grid-like boxes (Figs. 2-3 and 2-4). Each of the small boxes is 1 millimeter square (1 mm2). The paper usually moves at a speed of 25 mm/sec. Therefore, horizontally, each unit represents 0.04 sec (25 mm/sec × 0.04 sec = 1 mm). Notice that the lines between every five boxes are heavier, so that each 5-mm unit horizontally corresponds to 0.2 sec (5 × 0.04 = 0.2). The ECG can therefore be regarded as a moving graph that horizontally corresponds to time, with 0.04-sec and 0.2-sec divisions.
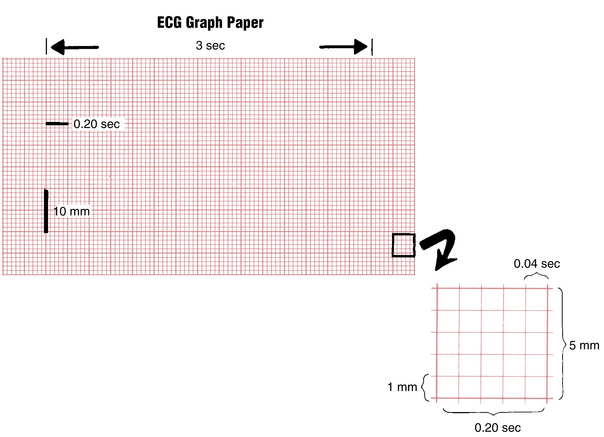
Vertically the ECG graph measures the voltages, or amplitudes, of the ECG waves or deflections. The exact voltages can be measured because the electrocardiograph is standardized (calibrated) so that a 1-mV signal produces a deflection of 10-mm amplitude (1 mV = 10 mm). In most electrocardiographs, the standardization can also be set at one-half or two times this usual calibration.
Basic ECG Measurements and Some Normal Values
Standardization (Calibration) Marker
The electrocardiograph must be properly calibrated so that a 1-mV signal produces a 10-mm deflection. Modern units are electronically calibrated; older ones may have a manual calibration button. As shown in Figure 2-5, the standardization mark produced when the machine is correctly calibrated is a square (or rectangular) wave 10 mm tall. If the machine is not standardized correctly, the 1-mV signal produces a deflection either more or less than 10 mm and the amplitudes of the P, QRS, and T deflections are larger or smaller than they should be.
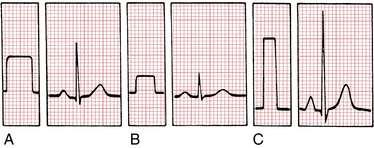
The standardization deflection is also important because standardization can be varied in most electrocardiographs (see Fig. 2-5). When very large deflections are present (as occurs, for example, in some patients who have an electronic pacemaker that produces very large spikes or who have high QRS voltage caused by hypertrophy), it may be advisable to take the ECG at one-half standardization to get the entire tracing on the paper. If the ECG complexes are very small, it may be advisable to double the standardization (e.g., to study a small Q wave more thoroughly). Some electronic electrocardiographs do not display the calibration pulse. Instead, they print the paper speed and standardization at the bottom of the ECG paper (“25 mm/sec, 10 mm/mV”).
Because the ECG is calibrated, any part of the P, QRS, and T deflections can be described in two ways; that is, both the amplitude (voltage) and the width (duration) of deflection can be measured. Thus, it is possible to measure the amplitude and width of the P wave, the amplitude and width of the QRS complex, the amplitude of the ST segment deviation (if present), and the amplitude of the T wave. For clinical purposes, if the standardization is set at 1 mV = 10 mm, the height of a wave is usually recorded in millimeters, not millivolts. In Figure 2-3, for example, the P wave is 1 mm in amplitude, the QRS complex is 8 mm, and the T wave is about 3.5 mm.
A wave or deflection is also described as positive or negative. By convention, an upward deflection or wave is called positive. A downward deflection or wave is called negative. A deflection or wave that rests on the baseline is said to be isoelectric. A deflection that is partly positive and partly negative is called biphasic. For example, in Figure 2-6 the P wave is positive, the QRS complex is biphasic (initially positive, then negative), the ST segment is isoelectric (flat on the baseline), and the T wave is negative.
Stay updated, free articles. Join our Telegram channel

Full access? Get Clinical Tree


