Introduction
Diabetes mellitus (DM) is diagnosed when plasma glucose levels rise above predefined thresholds. People diagnosed with DM have a high future risk of serious health consequences including cardiovascular events. Indeed, they develop cardiovascular disease approximately 15 years earlier than their non-diabetic counterparts1 and have a cardiovascular risk up to fourfold higher than in people without DM.1–4 The magnitude of this increased risk is progressively related to the degree of glucose elevation above normal. Moreover, this relationship is not restricted to people with DM and there is growing recognition that a progressive relationship exists between glucose levels and cardiovascular risk that begins at glucose levels well below the diagnostic thresholds for DM and that extends right into the diabetic range.5 Thus, like low-density lipoprotein (LDL) cholesterol or systolic blood pressure, glycemia, as measured by fasting glucose level, postload glucose levels or HbA1c levels, is a progressive cardiovascular risk factor. Whether glucose lowering or prevention of the rise in glucose levels with time can reduce cardiovascular risk in people with various degrees of glucose elevation (i.e. impaired glucose tolerance, impaired fasting glucose, newly detected DM or established diabetes) is currently being actively studied.
What is diabetes and how common is it?
Diagnosis and classification
DM is a common chronic condition that is defined on the basis of high glucose levels, and that is an independent risk factor for a growing list of serious diseases including, but not limited to, blindness, renal failure, amputations, claudication, stroke, myocardial infarction, and premature death. It is diagnosed when there is evidence of persistently elevated glucose levels that are above specific thresholds or cutpoints (Table 14.1).6 These thresholds were originally based on epidemiologic studies relating the risk of diabetic eye disease to the glucose level achieved two hours after drinking a 75 g oral glucose tolerance load.7 People with higher levels were at high risk of diabetic reti-nopathy and nephropathy, whereas those with levels below this threshold were at low risk for these health consequences.8,9
Table 14.1 Diagnostic thresholds for diabetes, impaired glucose tolerance, and impaired fasting glucose

WHO, World Health Organization; ADA, American Diabetes Association; ameasured during a 75 g oral glucose tolerance test (OGTT); bmust be confirmed on a subsequent day by any one of the three methods.
Recent data have confirmed the general relevance of these thresholds for eye disease, and have shown that people with glucose levels below these thresholds have a lower (but not negligible) incidence of retinopathy.10,11 More importantly, they have also highlighted the fact that these thresholds are not relevant to many of the other chronic consequences of DM that are listed in Table 14.2. Thus, as noted below, the risk of cardiovascular disease is progressively related to glucose levels extending from normal levels right into the DM range.
Table 14.2 Major chronic consequences of diabetes
| Eye disease (cataracts, retinal disease) | Early death |
| Kidney disease (renal failure, nephropathy) | Ischemic heart disease |
| Nerve disease (sensory, motor) | Stroke |
| Foot disease (pain, ulceration, callus, infection) | Peripheral vascular disease |
| Lower limb amputation | Cognitive decline |
| Steatohepatitis and cirrhosis | Depression |
| Hip fractures | Connective tissue abnormalities |
| Imbalance and frailty | Erectile/sexual dysfunction |
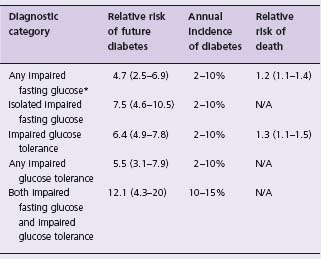
When the diagnostic thresholds for DM were established it was clear that many people had glucose levels that fell below the diabetic threshold but that were nevertheless still abnormal and could rise into the DM range with time. This led to the classification of impaired glucose tolerance (IGT) and impaired fasting glucose (IFG) which identified people at low risk for diabetic retinopathy and nephropathy but at very high risk for developing DM.9 Table 14.1 summarizes the current diagnostic thresholds for IGT and IFG (sometimes referred to as “prediabetes”) and Table 14.3 lists the relative risk and incidence of DM in people with these two dysglycemic states.12 Of note, the American Diabetes Association has adopted lower thresholds for impaired fasting glucose (i.e. 5.6 mmol/L) to optimize its sensitivity and specificity for predicting future DM;13 however, this lower threshold has not been adopted globally.14
Table 14.3 Risk of diabetes and risk of death in “prediabetes”

Data are from a systematic overview and meta-analysis of prospective studies.12
*Defined as a fasting plasma glucose level ≥ 6.1 mmol/L (i.e. WHO criterion); N/A, not available.
Prevalence
The estimated prevalence of DM in 2003 was 5.1% of all adults in the world.15 This prevalence has been rapidly rising and is currently reaching alarming proportions throughout much of the world. For example, in Ontario, Canada, the prevalence of DM rose from 5.2% of all adults in 1995 to 8.8% in 2005.16 This prevalence rises with age, approaching 20% of all people over the age of 70 in Canada16,17 and the USA.18 It also varies with race and ethnicity, with the highest prevalence in people from aboriginal populations throughout the world, followed by those with South Asian, Middle Eastern, African and European ancestry.15 In response to this epidemic, on December 20 2006 the United Nations formally recognized DM as a “chronic, debilitating and costly disease”, which “poses severe risks for families, countries and the entire world” and encouraged countries “to develop national policies for the prevention, treatment and care of diabetes”.
The prevalence of impaired glucose tolerance varies in a similar pattern; in most populations it is somewhat higher than the prevalence of diagnosed diabetes. Thus in 2003, the estimated prevalence of impaired glucose tolerance in the world was 8.2% of all adults.15
Etiology
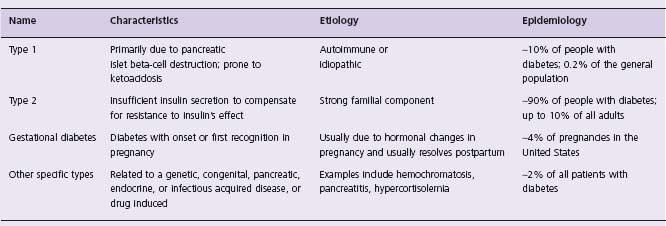
DM emerges when an individual is unable to secrete sufficient pancreatic insulin to maintain normoglycemia in response to various glucose-raising stimuli (such as meals, stress, etc.) throughout the day. This may occur due to a number of causes.19 Thus people with type 1 DM typically suffer from autoimmune damage to their beta cells and have minimal to absent insulin secretion. Conversely, people with type 2 DM or gestational DM may make abundant insulin; nevertheless, the absolute amount made is insufficient to maintain normal glucose homeostasis and to overcome whatever “insulin resistance” is present (due to obesity, inactivity or other factors). As insulin is the primary hormone that prevents hyperglycemia, by both inhibiting hepatic glucose production and facilitating glucose clearance by muscle, insufficient insulin quickly results in an elevated glucose level. The etiologic classification of DM and the associated characteristics and suspected causes of each type are listed in Table 14.4.
Table 14.4 Etiologic classification of diabetes mellitus

Adapted from reference 6. Note that patients with any form of diabetes may require treatment with insulin at some stage of their disease. Use of insulin does not in itself classify the patient.
How much does dysglycemia increase cardiovascular risk?
Relative risk of cardiovascular disease with diabetes
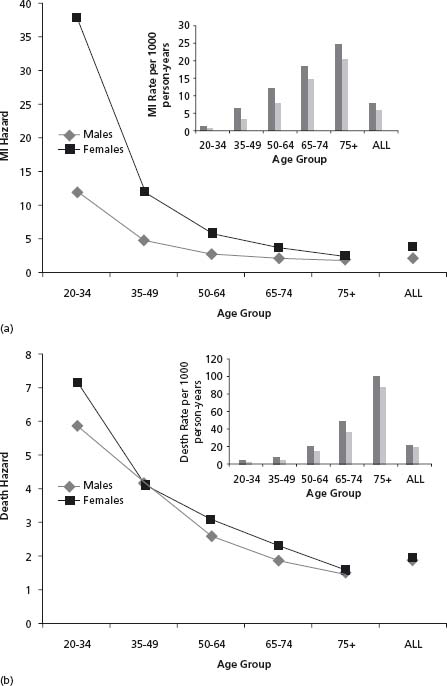
People diagnosed with DM are two to four times more likely to suffer a cardiovascular (CV) event than people without a diagnosis of DM,1–4 and people with DM develop cardiovascular disease approximately 15 years earlier than their non-diabetic counterparts.1 Moreover, the relative risk is highest for young individuals, and is higher in women than in men. Thus, men and women aged 20–34 have a relative risk of myocardial infarction (MI) of 12 and 37.8 respectively, whereas by age 75 or older the risks are 1.86 and 2.41 respectively.1 Figure 14.1 summarizes the incidence and risk of MI (Fig. 14.1a) and death (Fig. 14.1b) by sex and age group based on data from a population-based cohort of 9.4 million people (approximately 400 000 with diabetes) followed for six years from 1994 to 2000.1 These findings are supported in a recent large meta-analysis of 37 prospective studies performed from 1966 to 2005, comprising 447 064 people followed for 4–36 years in five continents, which reported that compared to people without diabetes, the age-adjusted relative risk of fatal coronary heart disease was 3.69 and 2.16 in women and men respectively; adjustment for other risk factors only modestly attenuated the risk to 3.12 and 1.99 respectively.20 The fact that the high risk of cardiovascular disease in people with DM cannot be explained by the co-existence of other cardiovascular risk factors has focused attention on the factor that is pathognomonic of diabetes: the elevated glucose level.
Figure 14.1 Myocardial infarction (MI) and death in men and women with diabetes. The hazard and rates (insert) of MI and death in men and women with diabetes in Ontario, Canada, between 1994 and 2000 by age range is shown in panels A and B respectively.1 Data are from the cited article.

Relationship of glycemia to cardiovascular disease in diabetes
Several prospective studies in people with DM have now clearly shown a graded relationship between HbA1c level and the incidence of cardiovascular outcomes. For example, the Wisconsin Epidemiologic Study of Diabetic Retinopathy followed a population-based sample of 1210 patients with DM presenting before the age of 30 and 1780 patients with DM presenting at or after the age of 30.21 In both groups of subjects, 10-year mortality increased with the baseline glycated hemoglobin quartile. After controlling for other risk factors, a 1% increase in glycated hemoglobin was associated with a 10% (older onset subjects) to 18% (younger onset subjects) increase in the hazard of dying from ischemic heart disease. In an epidemiologic analysis of data from the United Kingdom Prospective Diabetes Study, a 1% higher HbA1c was associated with a 14% higher risk of death, a 14% higher risk of myocardial infarction and a 12% higher risk of stroke.22 In another analysis of 1626 people with DM in the United States, a 1% higher HbA1c was associated with a 14% higher risk of myocardial infarction, fatal coronary heart disease or revascularization.23 Finally, the best estimate of this relationship was reported in a recent meta-analysis of 10 prospective studies in which a 1% higher HbA1c was associated with an 18% higher risk of coronary heart disease or stroke in people with type 2 diabetes; a similar relationship was noted in studies of people with type 1 DM.24
Relationship of glycemia to cardiovascular disease regardless of diabetes status
As noted above, prospective studies have consistently showed that the relationship between glucose levels and the subsequent risk of cardiovascular disease extends well below the diabetic threshold. For fasting glucose levels, a prospective 14-year study of 3458 non-diabetic men and women aged 40–70 with a fasting plasma glucose <7.8mmol/L (140mg/dL) reported that the age-adjusted ischemic heart disease mortality rates approximately doubled in men as the fasting glucose rose from 5 to 7 mmol/L (90–126 mg/dL), and tripled in women as the fasting glucose rose from 6 to 7.2 mmol/L (108–130 mg/dL).25 For postload glucose levels, a 10-year follow-up of 18 050 non-diabetic male civil servants revealed up to a twofold increase in coronary heart disease and stroke mortality in subjects whose two hour postload capillary glucose value was greater than 5.4mmol/L (97mg/dL) compared to those with lower glucose levels; this increase was independent of age, smoking, blood pressure, cholesterol, and occupation.26,27 Moreover, over a 33-year period, participants in this study had a 12% higher risk of coronary heart disease death per 1mmol/L (18mg/dL) higher two-hour glucose level (above 4.6 mmol/L or 83 mg/dL) after adjusting for several other cardiovascular risk factors.28 Other cohort studies also subsequently showed a relationship between cardiovascular events and both fasting and post-load glucose levels.29
In a 1998 systematic overview and meta-analysis of published cohort studies describing more than 1 million person-years of follow-up of mainly non-diabetic populations, the risk of cardiovascular disease increased continuously with fasting and postload glucose levels above 4.2mmol/L (75mg/dL).30 In a more recent meta-analysis of several large prospective studies comprising more than 1 million person-years of follow-up of people with and without diabetes, a 1 mmol/L higher fasting glucose level was associated with a 20% higher risk of various cardiovascular outcomes.31
Prospective studies have also demonstrated a relationship between HbA1c and cardiovascular outcomes regardless of DM status. Thus, in a nine-year prospective study of 1326 people with no history of diabetes, the risk of myocardial infarction, fatal coronary heart disease or revascularization rose 68% per 1% point increase in the absolute HbA1c level, after accounting for other cardiovascular risk factors.23 Moreover, in a six-year prospective study of 10 232 people (243 with established diabetes) the age-adjusted risk of a cardiovascular disease event rose 30% per 1% point increase of HbA1c and 20% per 1% point increase of HbA1c after adjustment for many other risk factors.32 These studies also suggest that the relationship between glucose and cardiovascular disease may be more marked in the prediabetes or early DM range than it is in people with established diabetes.
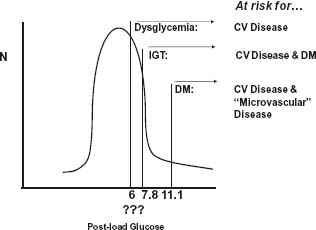
Therefore, glucose appears to be a continuous cardiovascular risk factor, similar to cholesterol or blood pressure in its dose–response relationship,33,34 and dysglycemia rather than DM per se has been used to best capture this concept.35,36 Thus people with dysglycemia alone are at risk for cardiovascular disease, people with dysglycemia and impaired glucose tolerance (IGT) are at higher risk for cardiovascular disease as well as DM, and people with DM are at even higher risk for cardiovascular disease as well as eye, kidney, and nerve disease (Fig. 14.2).
Figure 14.2 Frequency distribution of glucose levels in the general population. The significance of glucose as a risk factor for chronic disease depends on the level. Glucose levels above the diabetic threshold are associated with an increasing risk of cardiovascular and microvascular (e.g. retinal) disease, levels above the IGT threshold are associated with an increasing risk of diabetes, and elevated levels above some as yet undefined “dysglycemic” threshold are associated with an increasing risk of cardiovascular disease. CV, cardiovascular; DM, diabetes mellitus; IGT, impaired glucose tolerance.

Explanation of the dysglycemia–cardiovascular disease connection
Possible explanations for a glucose–cardiovascular disease relationship have been reviewed5 and are summarized in Figure 14.3. They include:


