Fig. 40.2 Pre-excited atrial fibrillation (AF). Tachycardia. No visible P waves. QRS duration varies between leads; the maximum being 130 ms. The key diagnostic clues are: (i) QRS complexes occur very irregularly (see rhythm strip), indicating that the rhythm must be AF (ventricular tachycardia is fairly if not completely regular); (ii) the upstroke of the QRS complex is ‘slurred’, especially laterally – the delta wave of Wolff–Parkinson–White; most QRS complexes are activated via the accessory pathway.

Fig. 40.3 Ventricular tachycardia (VT). This diagram illustrates how one can often distinguish VT from SVT with aberrancy (that is, SVT with either right- or left bundle branch block (R/LBBB)) mainly using leads V1 and 6, and looking at the exact pattern of the ECG in these leads. In SVT with LBBB, the V6 appearance is of a slurred M, with the first upstroke being smaller than the second, the QRS complex always remaining positive (i.e. above the iso-electric line). If the complex deviates below the line, then the diagnosis is likely to be VT. In SVT with RBBB, the QRS appearance in lead V1 is of an rsR′ appearance, that is, a small positive deflection, a slightly larger negative deflection, then a very large late positive deflection. In VT with a right bundle branch block appearance, either the complex is always positive, often with the first deflection much more positive than the later deflection, or the complex starts with a negative deflection, an S wave, not an R wave or aberrancy? LBBB, left bundle branch block; RBBB, right bundle branch block; SVT, supraventricular tachycardia.
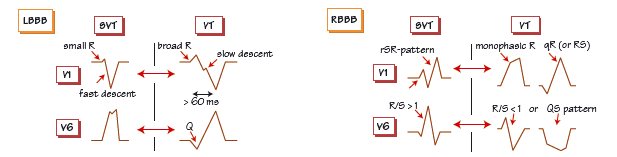
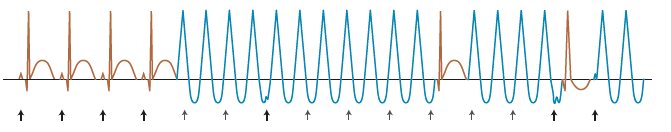
Fig. 40.4 Capture and fusion beats in ventricular tachycardia (VT). Sinus rhythm giving way to a broad complex tachycardia. P waves are arrowed, bold ones = P waves visible on the ECG, lighter arrows P waves ‘swallowed’ by the QRS complex. P waves are most easily visible on the top or bottom of a QRS complex. There is no relationship between the P waves and the QRS complex – the diagnosis is therefore VT. The trace shows a ‘capture’ beat, where the timing of the P wave allows penetration of the atrioventricular node, then into the normal conducting tissue and the ventricular myocardium, at the precise moment the VT circuit has passed, the ventricle has repolarized and the refractory period is over. As the basic VT circuit persists, the VT starts immediately afterwards. Later on a beat occurs, comprising partly a ventricular beat activated by the P wave and the normal conducting tissue, and partly by the VT circuit beat – a fusion beat. Fusion and capture beats are pathognomonic of VT.
A key question in managing sustained arrhythmias is to determine the origin/mechanism of the electrical disturbance. How can this be done?
Narrow complex tachycardias
Tachycardias where the QRS complex is narrow (≤ 120 ms) are universally of supraventricular origin. The common arrhythmias are:
- atrial flutter (see Chapter 44).
- atrial fibrillation (AF) (see Chapter 43).
- atrial tachycardia (see Chapter 44).
- atrioventricular nodal re-entrant tachycardia (AVNRT) (see Chapter 45).
- atrioventricular re-entrant tachycardia (AVRT) (see Chapter 46).
Broad complex tachycardias
Broad complex tachycardias can be either supraventricular or ventricular. All broad complex tachycardias should be considered to be ventricular tachycardia (VT) unless proven otherwise! How can these two diagnoses be distinguished?
- The clinical situation offers clues; cardiac disease (e.g. post-myocardial infarction, known left ventricular dysfunction from another cause) increases the chance of VT (Fig. 40.1

Stay updated, free articles. Join our Telegram channel

Full access? Get Clinical Tree


