Chapter 19 Diagnosis and Prognosis in Cardiac Disease Using Cardiac PET Perfusion Imaging
INTRODUCTION
There is a worldwide rising concern about the increasing morbidity and mortality rates related to coronary artery disease (CAD). This has motivated remarkable advances in the field of cardiovascular imaging that we have witnessed within the last 2 decades. The latest evidence underscores that functional imaging remains essential for an appropriate selection of therapy and for improving patient outcomes.1 The introduction of positron emission tomography (PET) represented a major breakthrough that ultimately has shed light on the pathophysiology and diagnosis of heart diseases. More recently, the concept of dual-modality imaging technology emerged,2 mainly spurred by the use of computed tomography (CT) to achieve accurate attenuation correction (AC). Currently, hybrid PET/CT systems allow simultaneous assessment of cardiac and coronary arterial structure together with myocardial perfusion and metabolism.
At first PET was regarded a powerful investigative tool that contributed to the understanding of several diseases.3,4 Nevertheless, the leading role of PET imaging in the field of oncology, along with the U.S. Food and Drug Administration (FDA) approval of radiotracers and changes in reimbursement, have all contributed to move the state-of-the-art technology from the research laboratory to the clinical arena. Currently, cardiac PET constitutes a well-developed means for detecting and tracking the progression of CAD, diagnosing microvascular dysfunction, and for the follow-up of different therapies, offering a comprehensive approach for the workup of CAD.
Cardiac PET has potential advantages in patients with multivessel CAD as well as in subjects with large body habitus, prone to attenuation artifacts. Taking into account risk stratification, a normal PET study indicates an excellent prognosis,5–8 and the risk of hard cardiac events increases with higher summed stress scores (SSS) and lower LVEF.3,9,10
Three-dimensional (3D)-mode PET imaging is becoming the standard with the latest brands of PET/CT systems. 3D-mode combines improved image quality and reduced patient radiation exposure, but this method increases scatter and presents certain technical challenges for cardiac PET.11–13
PRACTICAL ASPECTS OF IMAGING AND ANALYSIS
General Principles of PET Imaging
PET imaging is based on the use of radiotracers that decay by positron emission. A positron (a positively charged electron) is emitted from the nuclei of unstable isotopes during radioactive decay.14 Then, both the positron and an electron undergo a process known as positron annihilation and are converted into two coincident gamma-ray photons of 511 keV that travel in opposite directions. The distance traveled by the positron prior to annihilation constitutes the positron range. Detectors placed on either side of the active volume are connected in a coincidence circuit, so that if both detectors record an event within a very short interval, it is assumed that positron annihilation has occurred.12 This constitutes the basis of PET.
PET utilizes biological radiotracers labeled with positron-emitting isotopes such as carbon (11C), oxygen (15O), rubidium (82Rb), and fluorine (18F) that mimic natural substances. Thus, PET enables the measurement of several biological processes, including cardiac tissue blood flow, metabolism, and neurohormonal and receptor function. Many of the isotopes used for PET imaging have short physical half-lives (T1/2),14 making them readily applicable in studies requiring repetitive measurements in the same session.15
Attenuation effects are significantly higher with PET than with SPECT. Attenuation correction (AC) is relatively straightforward with PET because the length of the path of attenuation for the pair of 511-keV photons is constant and known for PET, whereas it is variable with SPECT.13 Traditionally, external transmission sources, such as germanium-68 (68Ge) or cesium-137 (137Cs), have been used as established means for AC of the PET emission data.13 Today this has been replaced exclusively by x-ray transmission scanning in the current generation of PET/CT systems, shortening the total transmission imaging time to under a minute. Since fast helical CT scans acquire images at a single point in the respiratory cycle, whereas PET data are averaged over many respiratory cycles, respiratory motion mismatch artifacts can be produced.11 These artifacts, when present, typically affect the anterior and anterolateral segments of the LV.16,17
In recent years, PET instrumentation has shown substantial evolution. New crystal materials, such as lutetium oxyorthosilicate (LSO) and gadolinium oxyorthosilicate (GSO) have become available.13 These crystals are attractive for PET, owing to faster light decay time and higher light yield than bismuth germanate (BGO) crystals.18 Furthermore, there is an increasing trend to apply 3D-imaging acquisition mode (septa out) instead of the traditional two-dimensional (2D) mode (septa in), with the potential to improve image quality and reduce injected doses but at the expense of increased background counts and higher reliance on scatter-correction accuracy.11,19 Notably, several new PET/CT scanners operate only in 3D mode.13 The current role of 3D mode versus 2D-mode will be fully described elsewhere in this textbook.
Cardiac PET has several technical advantages over traditional SPECT that should be appreciated:
Myocardial PET Perfusion Tracers
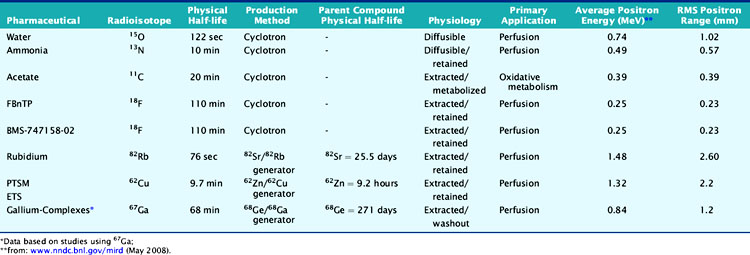
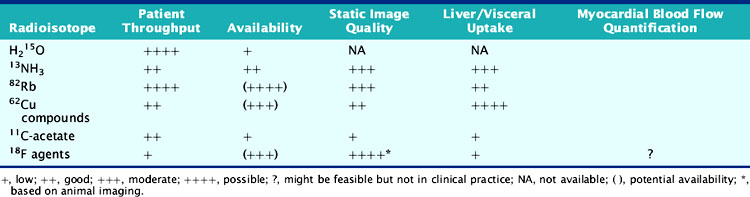
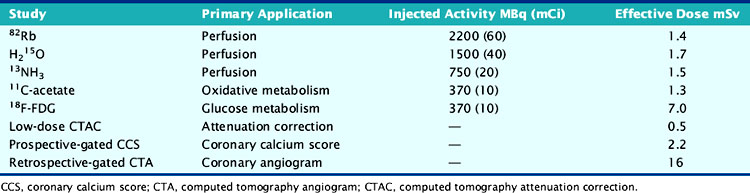
According to their physical properties, myocardial PET blood flow tracers fall into two basic categories: (1) inert, freely diffusible tracers like H215O and (2) physiologically retained tracers like 13NH3 and 82Rb.4,14 The main aspects of PET flow tracers have been summarized in Tables 19-1, 19-2, and 19-3.
Nitrogen-13 Ammonia
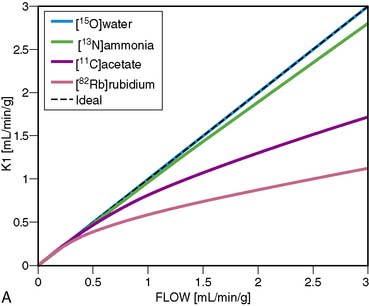
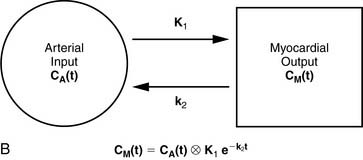
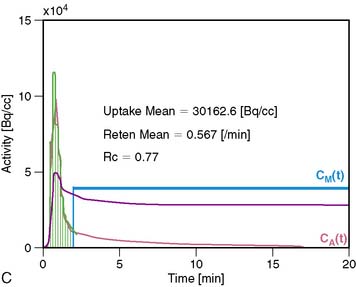
13NH3 (T1/2 = 9.96 minutes) requires an on-site cyclotron and radiochemistry synthesis capability.3,22 In the bloodstream, neutral 13NH3 is in equilibrium with the ionic form, ammonium (NH4+). 13NH3 diffuses freely across capillary and cell membranes and is retained in myocardial tissue,24 whereby it can be either incorporated into synthesis of 13N-glutamine, or it can diffuse back into the vascular space. The initial extraction is high, even at high flow rates. As such, the uptake rate constant K1 is a good estimate for quantitative blood flow (Fig. 19-1).
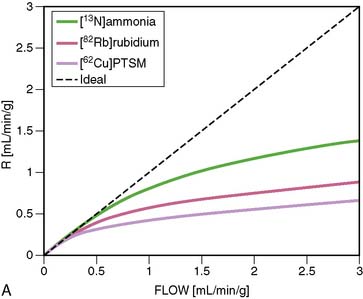
The net tissue retention is approximately 90% in the resting state. For 13NH3, the direct relationship between net tissue retention and blood flow is preserved for values of blood flow up to 2.5 mL/min/g, but at higher flow rates this linear relationship is lost (Fig. 19-2).25 Therefore, it is necessary to correct for flow-dependent changes in net tissue retention.
Myocardial retention of 13NH3 may be heterogeneous,26 and the lateral LV wall uptake can be 10% lower than that of other segments. Also, image quality can be hampered by the occasional intense liver activity, which could interfere with the evaluation of the inferior wall. Finally, in patients with severe left ventricular ejection fraction (LVEF) impairment, chronic obstructive pulmonary disease (COPD), or smoking, the sequestration of 13NH3 in the lungs can be abnormally increased. Then it would be necessary to delay the time between injection and image acquisition to enhance image quality.13
Rubidium-82
82Rb is produced from a strontium-82 (82Sr)/82Rb generator, which can be eluted every 10 minutes.27 The T1/2 of 82Sr is 25.5 days, which results in a generator life of 6 to 8 weeks. The short T1/2 of 82Rb (76 seconds) allows repeated and sequential perfusion studies but requires rapid image acquisition shortly after tracer administration.3,12 82Rb is a monovalent cationic analog of potassium and has similar biological activity to thallium-201 (201Tl). Myocardial uptake of 82Rb requires active transport via the sodium/potassium adenosine triphosphate transporter. In animal models, the net retention is approximately 50% at rest and decreases to 30% at peak flow. The retention fraction can be altered by acidosis and acute hypoxia.4
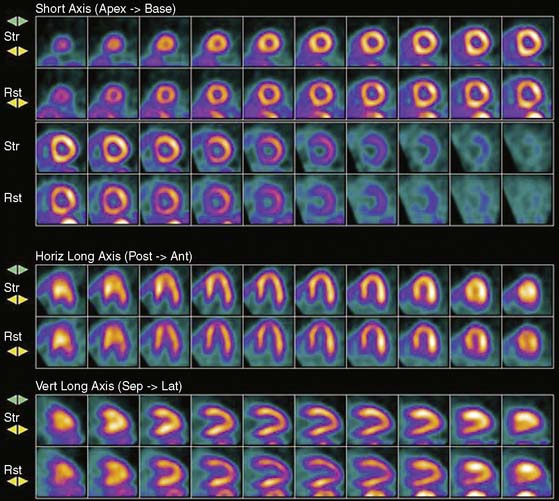
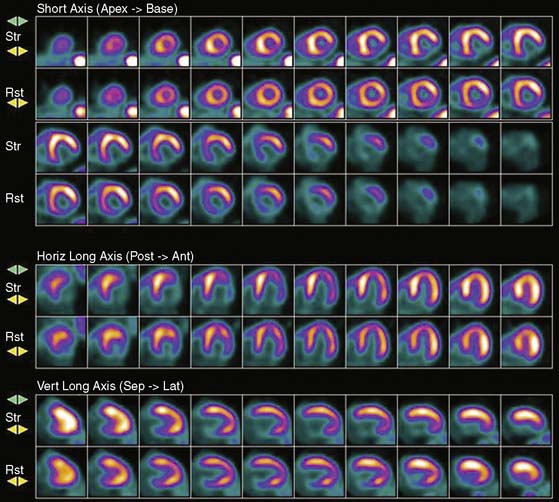
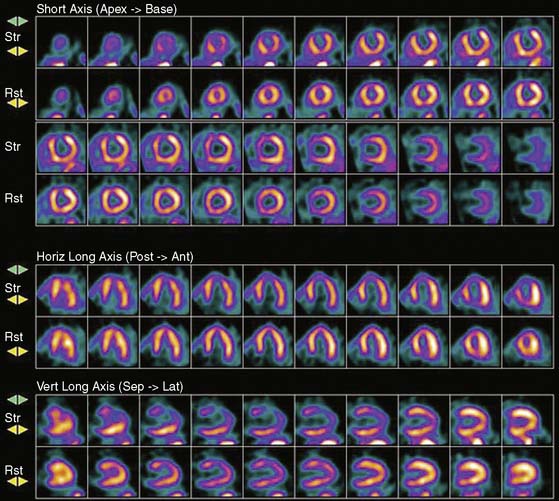
A small and mobile generator infusion system is used for eluting 82Rb every 10 to 15 minutes with low radiation exposure.27 Quantitative assessment with 82Rb is quite feasible and clinically practical with this generator as compared to cyclotron-produced compounds (Figs. 19-3, 19-4, and 19-5).28–31
Oxygen-15 Water
H215O (T1/2 = 2.04 minutes) is a cyclotron product and is considered the gold standard for absolute flow quantification.14 Since H215O is a freely diffusible agent, the extraction fraction is not affected by flow rates and is independent of the metabolic state of the myocardium.22 Cardiac imaging with H215O can be demanding because of its high concentration in the blood pool, entailing subtraction of the blood pool counts from the original image to visualize the myocardium.32 As such, it does not usually produce clinically interpretable perfusion images. Despite the success of H215O for research purposes, its clinical applications remain limited.18,22
Carbon-11-Acetate
Currently, PET using 11C-acetate (T1/2 = 20.4 minutes), a cyclotron product, is considered to be the most accurate and commonly used noninvasive method for measuring myocardial oxygen consumption ( ). As well, 11C-acetate has been proposed as a potential myocardial blood flow tracer33 because of its relatively high initial extraction fraction. Van den Hoff et al.34 reported that good MBF estimates can be obtained by fitting a simple compartmental model to regional acetate kinetics, providing similar quantitative accuracy relative to 13NH3-based blood flow methods. In addition, a potential advantage of 11C-acetate is its ability to simultaneously assess MBF and oxidative metabolism under resting conditions in a single tracer administration.35
Cu-62 PTSM, Cu-62 ETS
62Cu-pyruvaldehyde bis (N4-methylthiosemicarbazone) (PTSM) (T1/2 = 9.7 minutes36) is another generator-produced PET perfusion tracer and is produced from 62Zn/62Cu generator.37,38 62Cu-PTSM is a promising tracer for assessing myocardial and cerebral perfusion.36,39 Approximately 5% to 10% of the injected dose of 62Cu-PTSM remains in the circulation due to binding to red blood cells. Therefore, the quantitative measurement of regional MBF using the microsphere model requires correction of the arterial blood time-activity curve for blood-pool binding.40
Liver uptake may be problematic, but this appears less with newer related compounds such as 62Cu-ETS. Also, 62Cu has high positron energy similar to 82Rb, which may reduce image resolution.41,42
Recent Advances in PET Imaging: Novel Myocardial Blood Flow Tracers
18F-labeled compounds have relatively long physical T1/2 (110 minutes). Among these, 18F-p-fluorobenzyl triphenyl phosphonium cation (18F-FBnTP) is a member of a new class of positron-emitting lipophilic cations that may act as myocardial perfusion PET tracers.43,44 18F-BMS-747158-02 constitutes another emerging agent that is an analog of the insecticide pyridaben, an inhibitor of mitochondrial complex I (MC-1).45 Mitochondria constitute 20% to 30% of the myocardial intracellular volume. Consequently, molecules that target mitochondrial proteins may be enriched and retained selectively in the myocardium. With the longer 18F T1/2, these compounds have the potential for wide distribution. However, they may require reinjection or 2-day stress/rest imaging protocol similar to technetium-99 (99mTc) SPECT agents. On the other hand, this feature may enable routine exercise stress, which has not been widely developed with PET imaging to date. Recent data suggest kinetics may be suitable for quantification (Fig. 19-6).46
A 68Ge/68Ga generator can provide a convenient source of PET tracers because of the long physical half-life of 68Ge (T1/2 = 271 days) and a suitable daughter half-life (68Ga; T1/2 = 67.7 minutes). Recently, a ligand has been successfully labeled and tested with 67Ga for SPECT.47 The biodistribution of this novel complex has been assessed in normal and infarcted rat models, whereby it showed a high heart uptake, albeit low cardiac retention and high liver uptake. Further studies of other gallium complexes may improve the feasibility of measuring regional myocardial perfusion using similar ligands labeled with the PET isotope 68Ge.
MYOCARDIAL IMAGING PROTOCOLS AND ACQUISITION
Patient Preparation
Patients should be instructed to fast for at least 6 hours, to abstain from caffeine-containing products at least 12 hours, and to avoid theophylline-containing medications for 48 hours prior to the test.13 Diabetic patients should be guided on how to administer insulin before the study. Patients undergoing dobutamine stress tests should discontinue beta-blockers 48 hours prior to the test (only for diagnostic purposes and if it is clinically safe to do so).
Stress Testing Protocols
PET perfusion imaging is usually performed with pharmacologic stress. Adenosine, dipyridamole, and adenosine triphosphate block transport of adenosine into the cells and/or increase extracellular levels of adenosine, which causes coronary vasodilatation by interacting with the adenosine A2 receptors in the cell membrane.13 Adenosine and dipyridamole increase MBF without increasing oxygen demand. Side effects are somewhat greater with adenosine than with dipyridamole, but the latter more often require reversal with aminophylline (which is routine in some laboratories). More selective agonism of the adenosine A2A receptor subtype should theoretically result in a similar degree of coronary vasodilation with fewer and less severe side effects. Binodenoson,48 regadenoson,49 and apadenoson50 are highly selective agonists for the adenosine A2A receptor and are under investigation for clinical use for vasodilator stress imaging.
Dobutamine stress is a feasible alternative in those situations where adenosine, dipyridamole, or ATP are contraindicated.13,51 Dobutamine increases MBF to meet increasing myocardial oxygen demand. In segments supplied by diseased vessels, the increase in flow is attenuated during high-dose dobutamine administration (20 to 40 μg/kg/min).
Exercise stress may be a valid alternative and provide clinical information unobtainable with pharmacologic stress that is helpful in decision making, particularly for patients unable to tolerate pharmacologic stress. 13NH3 can be used in conjunction with treadmill exercise (TEX) or upright bicycle test. The tracer is administrated at peak exercise, and exercise should be continued for an additional 30 to 60 seconds after tracer injection. The patient is then repositioned in the PET camera to start the acquisition within 4 to 6 minutes.52 Accurate repositioning is of key importance to minimize artifact due to incorrect AC. Exercise stress is also available for the 82Rb imaging13,53,54 but can be logistically demanding; patients must be moved to and positioned in the scanner within 3 minutes of completing exercise.
Myocardial Perfusion Imaging Protocols
The most widely applied tracers in clinical practice are13NH3 and 82Rb.
13N Ammonia
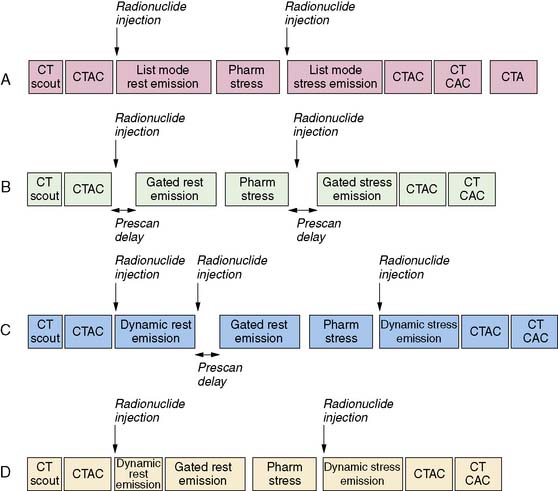
For relative perfusion imaging, 13NH3 is injected as a bolus of 370 to 740 MBq (10 to 20 mCi), and static images are acquired 2 to 3 minutes after tracer administration for an imaging time of 5 to 15 minutes.3,13 For patients undergoing PET/CT, two separate CT-based transmission scans should be performed for correction of rest and stress (after each emission scan is preferred to prevent misregistration artifacts).3
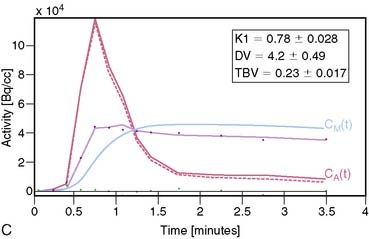
For flow quantification, a dynamic acquisition is required. This can be accomplished by performing separate dynamic and gated acquisitions with the same injection or through a single list-mode acquisition. From the dynamic images, time-activity curves are generated for the myocardium and the blood pool.13 Global and regional MBF can be measured with use of one- or two-tissue-compartment tracer kinetic modeling fit to myocardial activity data and corrected for spillover from the arterial input function.22
82Rubidium
A larger amount of tracer can be administered with similar absorbed dose to the patient because of the short physical half-life of 82Rb. In 2D acquisition mode, approximately 1500 to 2200 MBq (40 to 60 mCi) of 82Rb can be injected as an infusion over 30 seconds, with serial dynamic imaging acquisition starting at onset of the infusion. Between 70 and 150 seconds after completion of tracer infusion, a 3- to 7.5-minute image acquisition is initiated.8,13 Alternatively, newer-generation PET cameras can acquire data in 3D mode,28 which enables lower doses of 82Rb (750 to 1100 MBq [20 to 30 mCi]).
For quantitative assessment of global and regional MBF, one- and two-tissue-compartment models have been used. These account for activity in the vascular space and within the tissue compartment.55 Following bolus injection of the tracer, predominantly unidirectional transport is assumed from the vascular space into the tissue space.56 A simplified approach using tracer retention that involves a summed late image corrected for the input function, which can subsequently be corrected for the net retention,57,58 and similar methods have been developed for 13NH3.59 This approach enables a robust means to quantify perfusion that may be easier to apply in the clinical setting (see Figs. 19-1 and 19-2).28,30
Image Evaluation for Technical Sources of Errors: Quality Control
This step is of extreme importance for an accurate interpretation of the images. Patient body movements can lead to blurring of contours. Acquisition of a brief scan or scout image may facilitate accurate patient positioning. Body motion or respiratory movement can lead to transmission-emission misalignment and potential AC-induced artifacts (Fig. 19-8). However, most PET/CT systems should include software tools to correct transmission-emission misalignments. Finally, other potential sources of reconstruction artifacts encompass streak artifacts seen in large patients with arms-down imaging, metal implants, and IV contrast, as well as residual radioactivity in the IV line within the field of view (FOV).3,13
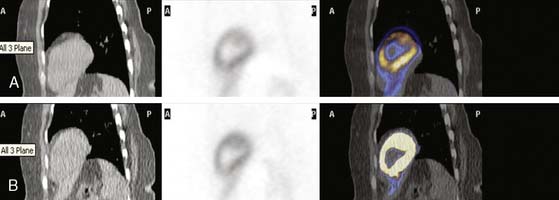
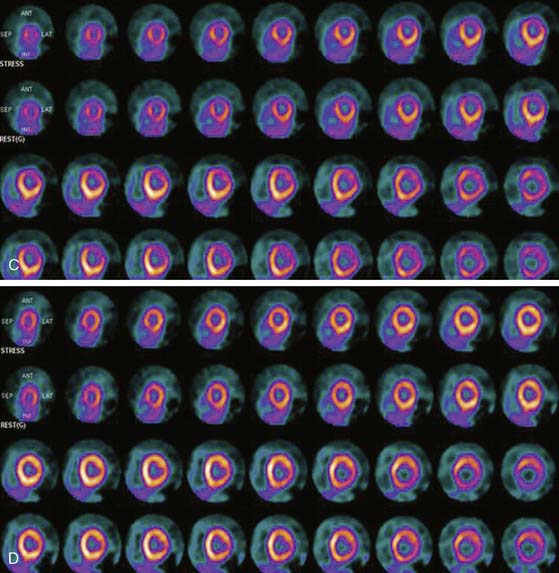
Image Analysis and Interpretation of Perfusion Images
Myocardial perfusion defects are usually identified by visual analysis of the reconstructed slices and compared between stress and rest images. Perfusion defect description, including extent, severity, reversibility, location, and specific coronary territories, should be reported routinely.60 Defects are typically defined as fixed, suggesting scar formation; reversible, indicating ischemia; or partly reversible, indicating a mixture of scar and ischemia. ACC/AHA/ASNC guidelines recommend semiquantitative analysis using a 17-segment model.13,61 Using this approach, summed perfusion defect score can be calculated, and this score is useful for cardiac risk stratification.61,62
Gated images are also acquired and interpreted. Contour definitions used for EF and volume estimates should be confirmed prior to interpreting gated EF data. The change in EF may have diagnostic value in terms of the extent of disease (discussed later).63 Wall-motion abnormalities at rest represent myocardial injury, either scar or otherwise, as may occur in a dilated cardiomyopathy. Wall-motion abnormalities that appear or are worse on stress imaging indicate ischemia-induced wall-motion abnormalities. This is in contrast to post-stress SPECT imaging acquired at least 30 minutes after the tracer injection, whereby wall-motion abnormalities are not reflecting concurrent ischemia but rather postischemic dysfunction or stunning. PET wall motion is acquired shortly after tracer injection, and thus changes reflect ischemic wall-motion abnormalities.
ABSOLUTE MYOCARDIAL BLOOD FLOW QUANTIFICATION
Advantages of Absolute Quantitative Analysis
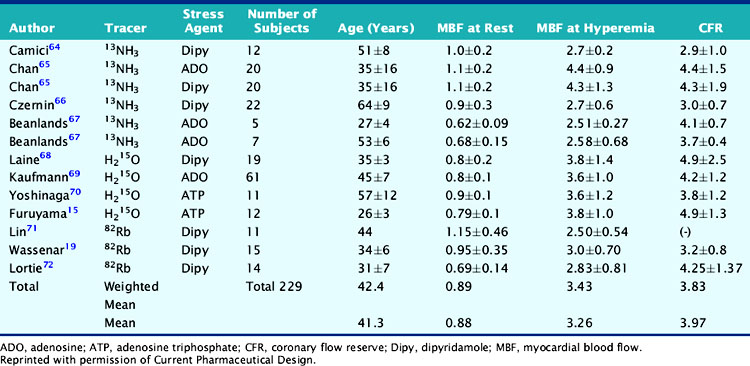
Atherosclerotic vascular disease has become a leading cause of death worldwide, and there is a need to identify the presence of CAD before the onset of symptoms. PET technology has the potential to image and measure pathophysiologic and molecular processes in vivo and is now recognized as the best noninvasive means by which to quantify MBF in absolute terms (mL/min/g) and CFR. Table 19-4 describes normal values of MBF and CFR in healthy subjects.
Table 19-4 Normal Values in Baseline Myocardial Blood Flow and Coronary Flow Reserve in Normal Subjects
Parkash et al. demonstrated the clinical importance of CFR over conventional visual analysis in patients with three-vessel CAD using 82Rb PET. In this study, the perfusion defect sizes were larger using quantification in comparison with the conventional relative uptake evaluation.29 Yoshinaga and colleagues compared the clinical value of CFR by PET to the relative assessment of MPI by SPECT in a population of 27 patients with overt CAD. Approximately two-thirds of regions with angiographic lesions more than 50% showed normal SPECT perfusion scans but significant impaired CFR by PET.70 Further investigations in larger sample size populations are needed to fully understand the clinical utility and added value of this approach. Only a few studies have assessed the prognostic value of abnormal MBF and CFR.73,74
Models for Flow Quantification
A mathematical model is constructed with parameters that represent the flux of the radiotracer between the compartments. Various tracer kinetic models have been applied and validated for MBF quantification with H215O, 13NH3, 82Rb, and 11C-acetate. Simple one-tissue-compartment models can be applied for flow quantification with each,25,32,34,56,75,76 providing a reasonable approach for estimating absolute tissue perfusion (see Fig. 19-1).11
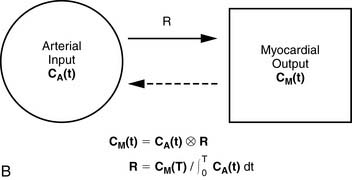
A further simplified retention model assumes that the tracer is retained completely without subsequent washout. A flow-dependent correction for net tracer retention is required to obtain quantitative perfusion estimates from the retention rates. The net retention model has been shown to produce precise estimates with 13NH377 and 82Rb62,78 in normal subjects and in patients with CAD, but the results depend in part on the time at which the model is evaluated and on the accuracy of retention measurement.11
Stay updated, free articles. Join our Telegram channel

Full access? Get Clinical Tree


