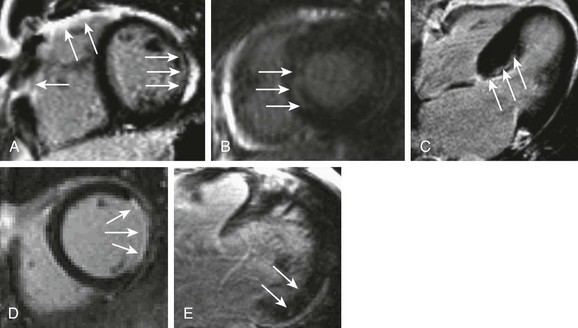
61 ARVD/C is a genetic disease characterized by fibrofatty infiltration of the right ventricle (RV) and less commonly the left ventricle (LV). An implantable cardioverter-defibrillator (ICD) provides reasonable therapy for patients who have one or more risk factors for sudden cardiac death (SCD), including inducible ventricular tachycardia (VT) during electrophysiological testing.1 Therefore, the diagnosis of ARVD/C has a significant impact not only on the proband with clinical events but also on the family members. Cardiac MRI plays a critical role in the diagnosis of ARVD/C in recently revised diagnostic criteria (Box 61-1).2 MRI overcomes the limitations of conventional imaging modalities such as echocardiography and provides multiplanar images of the right ventricle, allowing accurate evaluation of global and regional RV function. Further, MRI provides RV tissue characterization by depicting both fat infiltration and fibrosis (Figure 61-1, A). Although detecting RV fibrosis is challenging because of the thin wall of the RV, quantitative evaluation of the RV ejection fraction (EF) by cardiac MRI provides high sensitivity and specificity.3 The sensitivity of cardiac MRI ranges from 79% to 89% for major criteria and from 68% to 78% for minor criteria, with specificity of 96% to 100%.1 ARVD/C is associated with regional LV dysfunction; however, the overall LVEF is preserved.4 Independent LV involvement is rare, and the pattern of LV involvement is determined by the underlying genotype. In patients harboring plakophilin mutations (PKP2), LV abnormality often occurs in the form of focal epicardial fat infiltration of the LV lateral wall with preserved LV function.5 On the other hand, mutations in the desmoplakin (DSP) gene are associated with LV functional involvement. ARVD/C is also associated with RV mechanical dyssynchrony in up to 50% of cases, and with RV remodeling.6 Minor MRI abnormalities in RV structure, especially in the RV outflow tract, have been reported in up to 60% of mutation carriers and in none of the noncarriers5; however, the prognostic value of these findings remains unclear. Sarcoidosis is a multisystem granulomatous disease of unknown origin that is characterized by the presence of noncaseating granulomas in involved organs. Manifestations of cardiac sarcoidosis include conduction block, dilated cardiomyopathy (DCM), heart failure, ventricular arrhythmia, and SCD. Diagnostic reliance of the criteria on subjective assessment of LV wall thinning, wall motion abnormalities, and dilatation of the LV on echocardiography turned out to be insensitive for diagnosis.7 For example, at least some of the patients previously diagnosed with DCM are re-diagnosed with cardiac sarcoidosis once myocardial tissue is available for histologic analysis after ventricular assist device implantation.8 Technical advances in cardiac MRI have improved its capability to image the myocardial scar associated with cardiac sarcoidosis, and cardiac MRI plays a critical role in the diagnosis of cardiac sarcoidosis in the 2006 updated diagnostic criteria put forth by the Ministry of Health, Labor, and Welfare of Japan (Box 61-2).9 Diagnostic workup of cardiac sarcoidosis involves cardiac MRI with LGE to detect myocardial damage (Figure 61-1, B), and 18F-fluorodeoxyglucose (FDG)-positron emission tomography (PET) to detect disease activity.10,11 MRI is sensitive for cardiac involvement, and a positive MRI finding is associated with future adverse events including cardiac death.12 Severe myocarditis presents as DCM, heart failure, ventricular arrhythmia, and SCD. Cardiac MRI provides valuable clinical information on abnormal tissue characteristics associated with myocarditis,13 including (1) intracellular and interstitial edema (T2-weighted edema imaging), (2) hyperemia and capillary leakage (myocardial early gadolinium enhancement [EGEr]), and (3) necrosis and fibrosis (LGE).14 T2-weighted edema imaging is used to evaluate initial changes in myocardial tissue during the first phase of myocardial inflammation.15,16 Myocardial edema appears as an area of high signal intensity on T2-weighted images. EGEr uses T1-weighted images that are obtained both before and within the first minutes after di-N-methylglucamine salt of gadopentetate (Gd-DTPA) injection.14 Gd-DTPA accumulates in the myocardium, with hyperemia and capillary leakage during the early washout period. Because enhancement is visually subtle in most cases, quantitative analysis of myocardial EGEr is usually required. Several studies have confirmed the diagnostic value of this sequence, although it is prone to artifacts that decrease specificity.15 LGE allows visualization of the myocardium with necrosis and fibrosis. In myocarditis, LGE shows two patterns of myocardial damage: (1) an intramural, rim-like pattern in the septal wall; and (2) a patchy subepicardial distribution in the free LV lateral wall.17 However, LGE cannot differentiate between acute and chronic inflammation. The combination of these different MRI techniques provides high sensitivity and specificity.14,15 Most individuals with HCM are asymptomatic, and the first manifestation of the condition may be SCD, which is generally related to ventricular arrhythmia triggered by factors such as ischemia, outflow obstruction, or atrial fibrillation.18 Current guidelines recommend ICD implantation for patients with HCM who have one or more major risk factors for SCD.1 Recent advances in MRI technologies have demonstrated that myocardial fibrosis detected by LGE is a relatively early manifestation of HCM, and that the presence of fibrosis may itself represent a high risk for SCD in patients without conventional risk factors (Figure 61-1, C).19 In patients with HCM, myocardial fibrosis measured by LGE is associated with increased frequency of ventricular premature contractions and nonsustained VT on Holter monitoring.20 LGE is also an independent predictor of adverse outcomes, including cardiovascular death, unplanned cardiovascular admission, sustained VT or ventricular fibrillation (VF), or appropriate ICD therapy.21 These findings suggest that routine use of cardiac MRI in patients with HCM may improve risk stratification. Ventricular arrhythmia associated with myocardial scar in patients with ICM is a life-threatening arrhythmia that remains one of the most challenging clinical problems. Cardiac MRI is an extremely powerful tool for predicting ventricular arrhythmia and SCD in patients with ICM (Figure 61-1, D). Schmidt et al22
CT and MRI for Electrophysiology
Diagnosis
Arrhythmogenic Right Ventricular Dysplasia/Cardiomyopathy (ARVD/C)
Cardiac Sarcoidosis
Myocarditis
Prognosis
Hypertrophic Cardiomyopathy (HCM)
Ischemic Cardiomyopathy (ICM)
![]()
Stay updated, free articles. Join our Telegram channel

Full access? Get Clinical Tree


CT and MRI for Electrophysiology

