Electrocardiograms continue to be part of screening programs for athletes and familial hypertrophic cardiomyopathy (HC). Whether electrocardiographic (ECG) findings of left ventricular (LV) hypertrophy can distinguish between healthy populations and those with HC remains unclear. We sought to (1) analyze the relation between ECG voltage and LV mass in patients with HC and (2) evaluate ECG characteristics of patients with phenotypical HC. Retrospective cohort of patients with HC aged 13 to 18 years. Relation between ECG voltages (RV 6 , SV 1 , and RV 6 + SV 1 ) and echocardiogram measurements of LV mass was investigated using smoothing splines to display relations and compared with those in a prospectively obtained population of adolescents. Frequency of abnormal LV voltages and nonvoltage ECG changes (Q waves, T-wave changes, and ST changes) were analyzed for association with HC. Fifty-three patients with HC (72% men) were age and gender matched to 104 control patients. Smoothing splines demonstrated that parabolic rather than linear relations existed between LV mass and SV 1 , RV 6 , and RV 6 + SV 1 in patients with HC and not the control cohort. LV hypertrophy by ECG voltage criteria was present in 34% of patients with HC and associated with poor sensitivity (29%). In patients with HC, 56% demonstrated nonvoltage ECG abnormalities and were associated with improved sensitivity (68%) and high specificity (94%). In conclusion, there is a parabolic relation between LV voltages and LV mass in adolescents with HC that may lead to “pseudonormalization.” Voltage abnormalities were associated with poor sensitivity, whereas nonvoltage criteria were associated with improved sensitivity with high specificity.
Hypertrophic cardiomyopathy (HC) is the most common genetic heart disease in the United States, with a predilection for sudden cardiac death, particularly in young athletes. In efforts to identify at-risk patients, a number of screening processes have been proposed. Echocardiography offers noninvasive assessment of left ventricular (LV) size, wall thickness, and outflow obstruction. Electrocardiograms are assessed for excessive LV voltage, ST-segment changes, and abnormal Q waves. Although echocardiograms and electrocardiograms are part of the diagnostic workup for HC, there is conflicting evidence regarding the correlation of electrocardiographic (ECG) voltages to echocardiogram measurement of LV mass in pediatric patients with HC. Previous studies suggest that electrocardiogram has low sensitivity and high specificity in relation to LV mass on echocardiogram. Other studies suggest that extended ECG LV voltage criteria, including measures of Q waves and combination of voltage criteria, are better correlated to LV mass on echocardiogram than standard measurements of R waves in precordial leads. Whether ECG findings of LV hypertrophy can be used to distinguish between healthy population and those with HC remains unclear. The purpose of this study was to (1) analyze the relation between ECG voltage and LV mass in adolescent patients with HC, (2) evaluate ECG testing characteristics of patients with phenotypical HC, and (3) determine whether ECG characteristics can be used to differentiate between patients with phenotypical HC and adolescent athlete controls.
Methods
This was a retrospective cohort study of pediatric patients evaluated for HC. This study was approved by the Cincinnati Children’s Hospital Internal Review Board (study# 2013-4304). Consecutive adolescent patients aged 13 to 18 years with a history of HC from January 1, 2003, to June 30, 2013, were included. An electrocardiogram, echocardiogram, and genetic testing were part of the evaluation. Genetic testing was completed between 2008 and 2012. Patients with a gene positive family history of HC but without genetic screening specific to them were included in analysis if LV hypertrophy was present on echocardiogram. Each patient’s most recent electrocardiogram and echocardiogram completed within 14 days of each other up to age 18 years were included in analysis.
Patients with a known clinical history of hypertension, aortic stenosis, subaortic membrane, Friedreich ataxia, muscular dystrophy, LV noncompaction, and glycogen storage disease were excluded as these conditions may lead to secondary increased wall thickness and LV hypertrophy. In addition, patients without genetic testing and no LV hypertrophy on echocardiogram were excluded from the study.
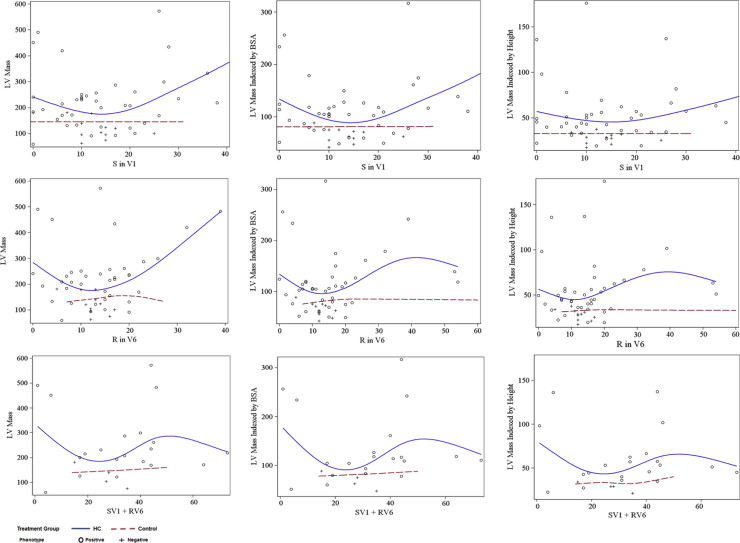
Relation between ECG voltages (R-wave V 6 , S-wave V 1 , and R-wave V 6 + S-wave V 1 ) and echocardiogram measurements of LV mass, LV mass per square-meters, and LV mass/height 2.7 was investigated. These were compared with measurements in a prospectively obtained population of adolescent athlete controls who underwent sports screening. Patients in the screening study were aged 13 to 18 years and underwent screening with echocardiogram and electrocardiogram. The frequency of abnormal LV voltages, as well as nonvoltage ECG changes that serve as components of the Seattle Criteria (pathologic Q waves, T-wave changes, and ST-segment changes), was analyzed for association with HC.
Demographic data, family history of HC, and genetic testing results were analyzed. On the basis of evaluation results, patients were categorized as (1) genotype positive and phenotype positive (gene+/phen+), (2) genotype positive but phenotype negative (gene+/phen−), (3) genotype negative but phenotype positive (gene−/phen+), and (4) genotype unknown but phenotype positive. Phenotype-positive patients were defined as patients with confirmed LV hypertrophy on echocardiogram. For this report, the “phenotype-positive group” includes the following subgroups: gene+/phen+, gene+/phen−, and genotype unknown but phenotype positive.
Electrocardiograms were reviewed by an experienced pediatric cardiac electrophysiologist. Each electrocardiogram was reviewed for baseline data including heart rate, frontal axis, PR interval, the presence of left atrial enlargement, QRS interval, presence of right or left bundle branch block, QT interval, and QTc interval. QTc prolongation was defined as a QTc interval >470 ms for men and >480 ms for women using the Bazett formula. Additionally, each electrocardiogram was analyzed for LV precordial voltages (S wave in V 1 , R wave in V 6 , and the combination of R-wave V 6 and S wave V 1 ) and nonvoltage characteristics (T-wave inversion, ST-segment depression, and pathologic Q waves). LV hypertrophy on electrocardiogram was determined by Davignon ECG standards in pediatric patients. Each LV precordial voltage was hand calculated.
Echocardiograms were reviewed by an experienced pediatric echocardiographer. Each echocardiogram was reviewed for baseline data including: M-mode LV diastolic septal thickness, LV diastolic posterior wall thickness, LV systolic posterior wall thickness, and LV mass. LV mass was determined per the American Society of Echocardiography recommendations: 0.8 × {1.04 [(LV internal diameter in diastole + LV posterior wall thickness in diastole + LV septal wall thickness in diastole) 3 − (LV internal diameter in diastole) 3 ]} + 0.6 g. LV size, location of hypertrophy if present (septal, concentric, and apical), and left atrial size were also reviewed. LV hypertrophy was defined as concentric if ≥0.42 or eccentric if ≤0.41. LV mass was indexed to height, and phenotype-positive LV hypertrophy was defined as LV mass index >150 g/m 2 .
Adolescent athlete controls from the sports screening study were age and gender matched to the patients with HC. The athlete controls had no documented family history of HC. Demographic and clinical characteristics of the study sample were summarized using measurements of central tendency, variability and frequency. Mean and standard deviation were reported for continuous variables. Frequency was reported for categorical variables. To determine if there was a difference in demographic and ECG values between patients with HC and matched controls, a 2-sample t test for equal or unequal variances, depending on the results of the equality-of-variances F test, was used for continuous variables and Fisher’s exact test was used for categorical variables. Smoothing splines were used to investigate and display the relation between LV mass as the dependent variable and ECG precordial voltage as independent variables in the HC and control groups separately. Statistical significance was determined as a p value ≤0.05. Statistical analyses were performed using SAS version 9.3 (SAS Institute Inc., Cary, North Carolina).
Results
There were 97 patients evaluated for HC during the study period, of which 52 met criteria. Eleven patients were excluded because they were genotype and phenotype negative. Thirty-four patients were excluded because genetic testing was not completed and phenotype negative. Patient demographics are demonstrated in Table 1 . Mean age was 16 years (13 to 18). Postevaluation HC classification was 21 (40%) gene+/phen+, 12 (23%) gene+/phen−, 10 (19%) gene−/phen+, and 9 (17%) genotype unknown but phenotype positive. MYH7 (50%) and MYBPC3 (42%) gene mutations were the most frequently encountered mutations in the gene+/phen− subgroup. Forty patients (77%) had LV hypertrophy by echocardiogram assessment, with the majority (65%) asymmetric. The phenotype-positive group demonstrated significantly greater LV mass on echocardiogram compared with controls (238 ± 119 vs 146 ± 37, p <0.0001). Smoothing splines demonstrated parabolic relations exist between LV mass and SV 1 , RV 6 , and RV 6 + SV 1 voltages in the phenotype-positive group. These parabolic relations were not seen in the control group ( Figure 1 ).
| Phenotype negative (n=12) | Phenotype positive (n=40) | Controls (n=104) | p value | |
|---|---|---|---|---|
| Age (years) | 16 ± 2 | 16 ± 2 | 16 ± 2 | 0.12 |
| Male | 5 (42%) | 33 (83%) | 76 (73%) | 0.24 |
| White | 11 (92%) | 31 (78%) | 96 (92%) | 0.02 |
| Weight (kg) | 69 ± 19 | 88 ± 30 | 68 ± 16 | 0.0003 |
| Body Surface Area (m2) | 1.8 ± 0.2 | 2.0 ± 0.3 | 1.8 ± 0.2 | 0.003 |
| Left Ventricular Mass (gm) | 122 ± 41 | 238 ± 119 | 146± 37 | <0.0001 |
| Gene positive | 12 | 22 (54%) | N/A | N/A |
LV hypertrophy by ECG voltage criteria was present in 35% (n = 14) of the phenotype-positive group but only 8% (n = 1) of the gene+/phen−group. In the phenotype-positive group, 56% demonstrated nonvoltage ECG abnormalities: Q wave (13%), T wave (45%), and ST segment (20%). Only 2 patients (17%) in the gene+/phen−group demonstrated nonvoltage ECG abnormalities. In total, 59% of the phenotype-positive group demonstrated either abnormal voltages or nonvoltage abnormalities compared with 17% of gene+/phen−patients. When comparing gene+/phen+ patients with HC to gene+/phen− patients with HC, there was no significant difference in LV precordial voltages on ECG. However, the presence of T-wave inversion in 2 or more leads was significantly associated with the gene+/phen+ group compared to the gene+/phen− group (p = 0.002).
The phenotype-positive group demonstrated increased SV 1 voltages compared with controls, although this increase did not reach statistical significance (p = 0.08; Table 2 ). There were no statistically significant differences in RV 6 voltages (p = 0.55) or the combination of SV 1 + RV 6 (p = 0.19); however, the presence of abnormal voltage (greater than ninetieth percentile for age) in SV 1 , RV 6 , or SV 1 + RV 6 was more likely to occur in the phenotype-positive group than controls (p <0.0001, p = 0.04, and p <0.0001, respectively). When comparing the gene+/phen+ subgroup to the controls, the gene+/phen+ group had significantly increased LV precordial voltages in SV 1 (p = 0.0005) and SV 1 + RV 6 (p = 0.02; Table 3 ). In addition, nonvoltage ECG abnormalities were more frequently encountered in the gene+/phen+ group (all p ≤0.03).
| Phenotype negative (n=12) | Phenotype positive (n=40) | Controls (n=104) | p value | |
|---|---|---|---|---|
| Left Ventricular Precordial Voltages | ||||
| SV1 (mm) | 12.5 ± 6.1 | 14.7 ± 10.9 | 11.4 ± 6.3 | 0.08 |
| RV6 (mm) | 12.3 ± 3.0 | 15.9 ± 11.9 | 14.7 ± 6.0 | 0.55 |
| SV1 + RV6 (mm) | 26.3 ± 8.3 | 33 ± 18.8 | 26.2 ± 6.9 | 0.12 |
| Abnormal SV1 | 1 (8%) | 9 (23%) | 1 (1%) | <0.0001 |
| Abnormal RV6 | 0 | 5 (13%) | 3 (3%) | 0.04 |
| Abnormal SV1 + RV6 | 0 | 7 (35%) | 2 (2%) | <0.0001 |
| Non-Voltage Abnormality | ||||
| T wave inversion >1mm in two or more leads | 0 | 18 (45%) | 1 (1%) | <0.0001 |
| ST segment depression >0.5 mm in two or more leads | 0 | 8 (20%) | 1 (1%) | 0.0001 |
| Pathological Q waves >3mm in depth in two or more leads | 2 (17%) | 5 (13%) | 0 | 0.0014 |
| Pathological Q waves >40 ms in two or more leads | 0 | 4 (10%) | 0 | 0.005 |
| Left axis deviation | 1 (8%) | 6 (15%) | 4 (4%) | 0.03 |
| Long QT interval QTc > 470ms (male) QTc > 480ms (female) | 0 | 4 (10%) | 0 | 0.005 |
| Genotype positive Phenotype negative (n=12) | Genotype positive Phenotype positive (n=21) | p value ∗ | Controls (n=104) | p value † | |
|---|---|---|---|---|---|
| Left Ventricular Precordial Voltages | |||||
| SV1 (mm) | 12.5 ± 6.1 | 13.2 ± 10.9 | 0.82 | 11.4 ± 6.3 | 0.48 |
| RV6 (mm) | 12.3 ± 3.0 | 13.9 ± 12.2 | 0.56 | 14.7 ± 6.0 | 0.76 |
| SV1 + RV6 (mm) | 26.3 ± 8.3 | 28.8 ± 14.7 | 0.74 | 26.2 ± 6.9 | 0.53 |
| Abnormal SV1 | 1 (8%) | 5 (24%) | 0.38 | 1 (1%) | 0.0005 |
| Abnormal RV6 | 0 | 3 (14%) | 0.28 | 3 (3%) | 0.06 |
| Abnormal SV1 + RV6 | 0 | 3 (23%) | 0.54 | 2 (2%) | 0.01 |
| Non-Voltage Abnormality | |||||
| T wave inversion >1mm in two or more leads | 0 | 11 (52%) | 0.002 | 1 (1%) | < 0.0001 |
| ST segment depression >0.5 mm in two or more leads | 0 | 6 (29%) | 0.06 | 1 (1%) | < 0.0001 |
| Pathological Q waves >3mm in depth in two or more leads | 2 (17%) | 3 (14%) | 1.0 | 0 | 0.004 |
| Pathological Q waves >40 ms in two or more leads | 0 | 2 (10%) | 0.52 | 0 | 0.03 |
| Left axis deviation | 1 (8%) | 4 (19%) | 0.63 | 4 (4%) | 0.03 |
| Long QT interval QTc > 470ms (male) QTc > 480ms (female) | 0 | 3 (14%) | 0.28 | 0 | 0.004 |
Stay updated, free articles. Join our Telegram channel

Full access? Get Clinical Tree


