Chapter 20 Coronary Artery Calcification
Pathogenesis, Imaging, and Risk Stratification
INTRODUCTION
Assessing atherosclerotic plaque burden has long been the goal of cardiologists, considering that the initial presentation of a significant percentage of previously asymptomatic patients is with myocardial infarction (MI) or sudden cardiac death.1 Large epidemiologic studies have identified a host of “conventional” risk factors that are able to predict only about two-thirds of those patients who will eventually go on to develop coronary artery disease (CAD).2 Nearly a third of patients dying of CAD in the United States are classified as being at low risk with the Framingham Risk Index score.3
It is now well known that most of the acute coronary events result from the rupture and/or erosion of non-stenotic but vulnerable plaques.4,5 To date, invasive coronary angiography remains the gold standard for imaging the coronary arteries and intravascular ultrasonography (IVUS) is the investigation of choice to accurately assess the total atherosclerotic plaque burden and plaque morphology. With the attending risk (though small) involved with an non-invasive technique to image the coronary arteries and accurately assess the total atherosclerotic plaque burden. The exponential improvements in imaging technology in the last 2 decades, most notably the improvements in computed tomography (CT) and the rapid growth of computer technology, have made this goal a reality. There has been a plethora of articles published on the subject of detection of coronary artery calcification (CAC) using electron beam CT (EBCT) and multislice CT (MSCT) and its value in prognosis and risk stratification, particularly in asymptomatic patients or in those patients with a low to intermediate probability of developing CAD.
TYPES OF ARTERIAL CALCIFICATION
Two distinct types of arterial calcification have been described: medial arterial calcification and calcification associated with atherosclerotic plaque.6 These two types of calcification differ in terms of their pathophysiology, morphologic features, and clinical significance. In atherosclerotic plaque, calcium deposits are typically found in the intima. In contrast, medial calcification, also known as Mönckeberg’s sclerosis, occurs independently of atherosclerosis. Medial arterial calcification (MAC) occurs in the small and medium sized muscular arteries. It is typically noted in the arteries of the abdominal viscera, breast and the thyroid gland. Medial calcification of the coronary arteries, though rare, has been noted in patients with advanced diabetes and/or chronic kidney disease. MAC is not associated with luminal stenosis but causes stiffening and decreased compliance of the arteries.
PATHOGENESIS OF CORONARY ARTERY CALCIFICATION
Atherosclerosis is known to be a chronic inflammatory process where various components of the immune system are implicated.7,8 In the majority of cases, the presence of a high plasma lipid concentration fuels the process of atherosclerosis. Endothelial cells, leukocytes, and intimal smooth muscle cells, as well as other contributory factors such as smoking, hypertension, diabetes, and in some cases, high homocysteine levels, all play an important part in the process of atherosclerosis, but the exact nature of their interactions with each other is yet to be fully unraveled.
There have been different views regarding the mechanism of calcium deposition in atherosclerotic plaques.9 Some initial theories suggest that calcification results from passive adsorption of Gla-containing proteins with a high affinity for calcium phosphate and hydroxyapatite, whose only known function is to bind calcium.10,11 This seems unlikely in light of the fact that calcification occurs in only those vessels with atherosclerosis and is absent in normal arteries.12 Other evidence suggests that coronary calcification is an actively regulated process rather than passive adsorption and precipitation.13 In fact, several intriguing similarities have been noted between coronary calcification and bone formation.14
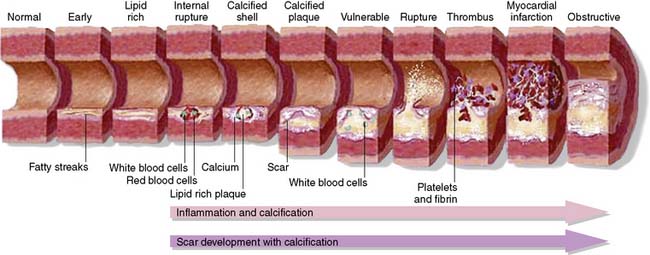
Calcium deposition within an atherosclerotic plaque lesion starts as early as the second decade of life, when the plaque lesion is no more than a fatty streak15 (type III plaque lesion). When calcification becomes widespread, it is then classified as a type IV lesion, which contains granules of calcium within the smooth muscle cells and the extracellular matrix. The process of calcification starts in the damaged intracellular organelles of smooth muscle cells that subsequently become apoptotic and act as niduses of further calcification.16 The extracellular accumulation of lipids within the plaque deep within the intima appears to be the starting point for this process.17 The small granules of calcium fuse together to form larger deposits in the form of lumps and plates. These are progressively classified as type V, VI, and VII plaque lesions, with increasing quantities of calcium. The stages in the progression of atherosclerotic plaque have been illustrated in Figure 20-1.
Clinical Relevance of Coronary Artery Calcification
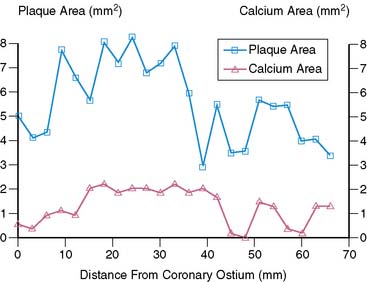
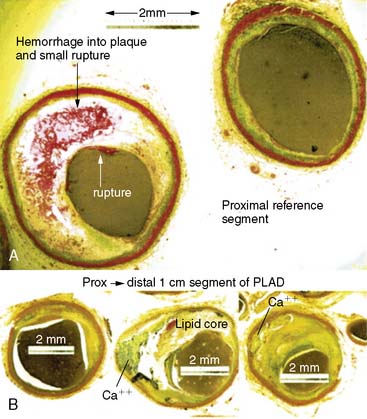
The amount of coronary calcium correlates well with the segmental atherosclerotic plaque burden18 and is clearly illustrated in Figure 20-2. Histologic study by Rumberger et al. showed that on average, calcium represents about a fifth of the total atherosclerotic burden.19 However, the amount of calcium does not correlate with the severity of angiographic luminal stenosis, and this is most likely due to the remodeling process, whereby there is an increase in size of the arteries, compensating for the atherosclerotic plaque (Fig. 20-3).20 Furthermore, presence and extent of calcification do not predict the future risk of plaque rupture. In fact, there are conflicting theories regarding the effect of calcium on plaque stability. It has been suggested that calcified plaques are much stiffer and hence less likely to rupture than cellular plaques. Culprit lesions revealed by IVUS were found to contain less calcium than stable lesions,21 lending credibility to the notion that calcification stabilizes a plaque. There have also been studies suggesting that calcification is a result of subclinical plaque rupture, a sort of protective mechanism of the plaque, to stabilize and prevent further plaque rupture.
On the contrary, Abedin et al. suggest that the vessel is rendered less vulnerable to rupture only when extensive calcification has occurred, whereas the early stages of calcification may actually enhance plaque vulnerability.22 It has been shown that calcified atherosclerotic plaque is at least 4 to 5 times stiffer than cellular plaque.23 In the initial stages of calcification, plaques are most prone to rupture at areas of interface between high- and low-density tissue.24 As the degree of calcification increases, the number of interfaces between rigid and distensible plaque initially would increase until the point at which the rigid plaques coalesce. Calcification beyond this point may be associated with decreasing risk of plaque rupture. However, further research is needed to unravel the association between calcification and plaque vulnerability.
Biochemical Factors Implicated in Coronary Calcification
Current opinion suggests that coronary artery calcification is an active process mediated by the production of ectopic bone matrix proteins by either vascular pericyte-like cells, smooth muscle cells or macrophage-derived foam cells.25,26 Fitzpatrick and colleagues have identified the mRNA of the matrix protein Osteopontin in coronary artery specimens with calcification.27 The bone matrix proteins implicated in the development of coronary artery calcification so far are shown in Table 20-1.
Table 20-1 Biochemical Factors Implicated in Coronary Artery Calcification
| Biomarker | Class | Action/Role |
|---|---|---|
| Osteopontin | Glycoprotein | Cell attachment |
| Osteonectin | Calcium-binding glycoprotein | Binds strongly to both hydroxyapatite and collagen |
| Osteocalcin | Gamma-carboxylated protein | Responsible for mineralization, only produced by osteoblasts |
| Osteoprotegerin | Cytokine of the tumor necrosis factor family (glycoprotein) | Osteoclastogenesis inhibitory factor, inhibiting the differentiation of macrophages into osteoclasts |
| Bone morphogenetic protein (BMP) 2a | Cytokine belonging to the transforming growth factor beta superfamily of proteins | Induces the pericyte-like cells to undergo osteogenic differentiation leading to production of bonelike matrix |
Osteoprotegerin (OPG) in particular appears to have garnered a fair share of attention. Anand and colleagues showed that OPG levels correlated significantly with increased CAC scores in a cohort of asymptomatic diabetics with an unadjusted odds ratio of 3.08 (95% CI: 2.42 to 3.92, P < 0.001).28 More recently, in a very high-risk population of patients with chronic kidney disease (CKD), it was shown that the levels of OPG correlated significantly with the degree of CAC as well as survival. In a multivariate logistic regression model, OPG independently predicted all-cause mortality in CKD patients.29
CORONARY ARTERY CALCIUM IMAGING USING ELECTRON BEAM COMPUTED TOMOGRAPHY/MULTISLICE COMPUTED TOMOGRAPHY
A few studies have compared the data variability between these two imaging modalities (EBCT and MSCT scanners), and they show good correlation between the scanners in terms of accuracy and reproducibility. Knez et al. showed an excellent correlation between MSCT and EBCT for quantification of coronary calcium in 99 patients (r = 0.994; P = 0.01).30 Becker et al. compared the two modalities in 100 patients and found a good correlation between the two types of scanners.31
ALGORITHMS FOR QUANTIFICATION OF CORONARY CALCIUM
Agatston Score
The calcium scoring system first described by Agatston et al.32 in 1990 is widely used even today. They described a scoring algorithm that takes into consideration the area and density of the calcified plaque. Calcified foci within the outline of epicardial coronary arteries with a threshold area of 1 mm2 and a threshold attenuation value of 130 Hounsfield units are scored. CAC score is calculated as maximal computed tomographic number (MCTN) multiplied by area of calcification in mm2. The MCTN is obtained from the maximal Hounsfield intensity within the area of interest, as shown in Table 20-2. For example, if the peak x-ray density of a calcified lesion is 400 Hounsfield units, and the total area occupied is 10 mm2, then the CAC score using this method is: 4 × 10 = 40 Agatston units (Au). The score for each lesion in a given patient is measured, and all the scores are added to give the total CAC score for the patient.
Table 20-2 Calculating Maximum Computed Tomographic Number*
| Attenuation Density of Coronary Plaque (Hounsfield Units) | Maximum Computed Tomographic Number |
|---|---|
| 130–200 | 1 |
| 201–300 | 2 |
| 301–400 | 3 |
| >400 | 4 |
* Used in coronary artery calcium scoring using the Agatston method.
The Agatston method is susceptible to partial volume effects, and the reported variability of repeated EBCT scanning ranges from 22% to 49%.33–35 In a study by Bielak et al.,36 hyperattenuating foci less than 2 mm2 showed less than 50% reproducibility in 256 subjects who underwent two sequential electron beam CT examinations several minutes apart. The factors mainly responsible for poor reproducibility are cardiac, respiratory, and patient motion; arrhythmias; image noise; and image gaps due to discontinuous acquisition of image data. There are a few other factors that can also cause artifacts and difficulty in scan analysis, such as the presence of pacing or ICD wires and coronary stents.
Volume Score
One of the ways of improving reproducibility is to use volume-based calcium quantification, as reported by Callister et al.37 An important limitation of the Agatston scoring algorithm is that it is based on the area (rather than the volume) of the calcified plaque. This means only the length and breadth of a plaque are taken into account, and the depth is ignored. Volume-based calcium quantification uses isotropic interpolation, and thus the value obtained is the volume of calcium present and not an abstract number. The absence of a Hounsfield units–dependent factor makes this system less susceptible to the effects of partial-volume averaging. This is particularly useful with the newer spiral scanners, which use overlapping image reconstruction, since the volume score is independent of the image overlap and the slice thickness used.
Detrano et al.38 evaluated the effect of scanner type and scoring algorithm on the reproducibility of CAC measurements among the participants of the Multi-Ethnic Study of Atherosclerosis (MESA), a multicenter observational study of 6814 asymptomatic subjects. Three of the study centers used EBCT, and the other three centers used MSCT. Each participant underwent two scans 2 minutes apart. EBCT and MSCT scanners showed equivalent reproducibility for measuring coronary artery calcium. Calcium volume scores showed slightly better reproducibility compared to Agatston scores.
Mass Score
It has also been suggested that calculating absolute calcium mass is a reliable method of quantification of coronary artery calcium. If appropriate calibration is used, either with an external standard or a calibration phantom, the reliability is improved and is independent of the CT hardware or the differing scanning protocols.39 Calcium mass is calculated as a product of lesion volume, average CT density of the lesion in Hounsfield units, and a calibration factor. These newer methods of calcium quantification are not widely being used, because there is no standardized reference database for them as yet. Since the majority of the large-scale trials have used the Agatston score, this method continues to be the clinical standard used in most centers.
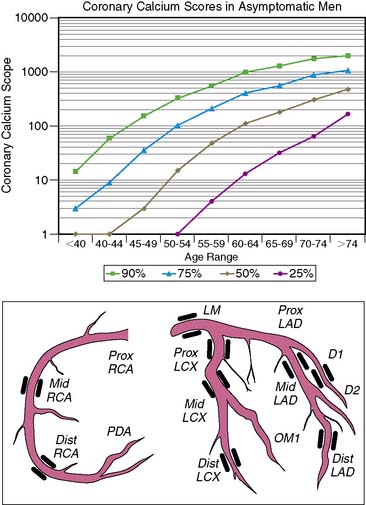
The age/sex percentile rank and diagrammatic representation of the coronary arteries with CAC lesions (depicted in black) in a typical CAC score report is shown in Figure 20-4.
Coronary Artery Calcium Score: What Does It Mean?
Age and sex of a patient play an important role in determining the prevalence and extent of CAC. In both the sexes, prevalence of CAC increases with age.40 CAC scores vary greatly, so even in subjects of similar age groups, an age/sex nomogram is required to standardize an individual patient value against that of a matched population—or in essence, to suggest a “coronary age.”41,42 Hoff et al. analyzed 35,246 self-referred, predominantly white, asymptomatic subjects between the ages of 30 and 90 years and categorized them according to percentiles.43 The total CAC scores in this study group were decidedly non-Gaussian. The age/sex nomogram generated from this study is particularly useful in the risk stratification of individuals, depending on their CAC scores. For example, a calcium score of 15 Au in a male subject younger than 40 years of age, though not alarming in itself, places him above the 90th percentile when ranked with the nomogram. From these data, it is also clear that CAC measured in men is similar to the scores measured in women who are 15 years older.
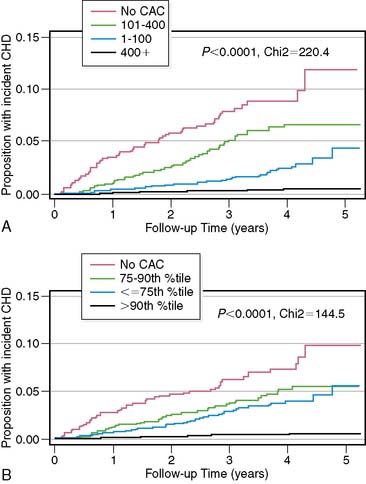
However, a recent study by Budoff and colleagues44 demonstrated that absolute CAC score groups were a better predictor of incident CHD events than age/sex and ethnicity-based percentile rank in the MESA cohort of patients. This is clearly illustrated in Figure 20-5. The Kaplan-Meier curves based on absolute CAC scores appear to have a better separation than those based on age-sex-race/ethnicity percentile ranks, indicative of better risk stratification capability in the short term. What this suggests is that patients in the lower absolute CAC score group are at low risk of CHD events irrespective of their age-sex-race/ethnicity percentile rank. This appears to be true for prediction of obstructive CAD as well in both asymptomatic and symptomatic patients.45
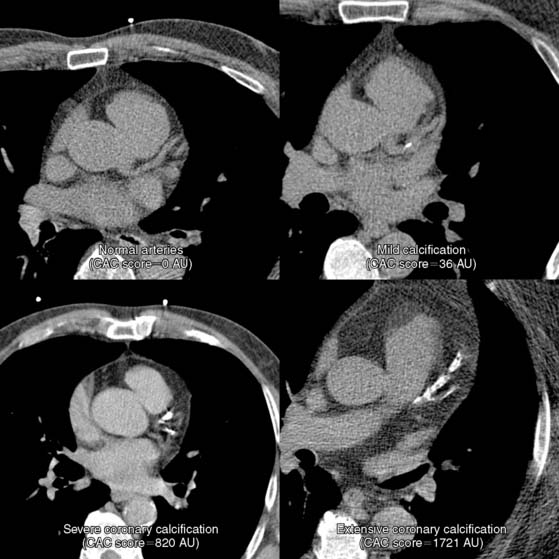
Severity of CAC score is arbitrarily classified as minimal, mild, moderate, severe, and extensive based on the absolute score, as shown in Table 20-3. Snapshotsof the varying degrees of severity of CAC score in a typical scan are clearly illustrated in Figure 20-6.
Table 20-3 Categories of Coronary Artery Calcification
| CAC Score (Agatston Units) | Coronary Calcification Category |
|---|---|
| 0 | Absent |
| 1–10 | Minimal |
| 11–100 | Mild |
| 101–400 | Moderate |
| 401–1000 | Severe |
| >1000 | Extensive |
ROLE OF CAC IMAGING IN RISK STRATIFICATION
The Significance of Risk Stratification in Coronary Artery Disease
In approximately 50% of patients with newly diagnosed CAD, the first presentation is either MI or sudden cardiac death.1 Nearly half a million sudden deaths occur in the United States each year, and approximately 70% of them are due to CAD.46 Although the overall mortality of cardiovascular diseases has decreased in the United States, mortality due to SCD has remained largely unchanged.47 Conventional cardiovascular risk factors account for a large proportion of CAD burden48; early identification and timely intervention to lower risk in asymptomatic individuals could prevent or postpone a majority of CAD events.49 Risk stratification is an important initial step in the clinical management of cardiovascular risk factors. Risk stratification should start with simple evaluation of clinical risk markers, including age, sex, history of hypertension, diabetes, smoking, hypercholesterolemia, and family history of premature cardiovascular disease. Commonly used risk algorithms include the Framingham Risk Score (FRS),50 PROCAM score,51 or the European risk prediction system called SCORE52 (systemic cardiovascular risk evaluation). These risk scores predict the 10-year absolute risk of cardiovascular events and are helpful in selecting the most appropriate candidates for risk-reduction treatments. Such office-based, clinically derived risk scores, though practical, inexpensive, and easy to calculate, have significant limitations53 and are not uniformly applicable in different populations.54–57 CAC imaging, by virtue of its ability to detect and accurately quantify subclinical atherosclerosis in coronary arteries, offers promise to refine the current risk stratification strategies.
Correlation Between Coronary Artery Calcium and Conventional Cardiovascular Risk Factors
The prevalence of coronary calcification is significantly higher in subjects with traditional cardiovascular risk factors such as hypertension, diabetes, obesity, infrequent exercise, previous smoking, and hypercholesterolemia.58 There was a significant, continuous graded relationship between prevalence of coronary calcium, mean CAC scores, and the number of risk factors. The prevalence of CAC deposits was 40% in asymptomatic men aged younger than 60 years with no risk factors, as opposed to 74% in those with three or more risk factors. However, in older men (>60 years of age), the prevalence of CAC deposits was more than 80% regardless of the number of risk factors present. Multiple logistic regression analysis showed age (relative risk [RR] = 2.82 per 10 years), female gender (RR = 0.34), history of hypertension (RR = 1.53), diabetes (RR = 2.32), obesity (RR = 2.22), and hypercholesterolemia (RR = 1.63) to be significant independent predictors of the presence of coronary calcium. In a recent study, Parikh et al.59 performed CAC measurements in the second- and third-generation descendents of original Framingham cohorts and showed that parental premature cardiovascular disease was associated with a significantly high likelihood of coronary calcification in the offspring, after adjustment for other cardiovascular risk factors.
The Coronary Artery Risk Development in Young Adults (CARDIA) Study60 observed the effect of cardiovascular risk factors in young adults on subsequent development of coronary calcification. The study involved over 3000 adults, aged between 18 and 30 years, who underwent risk assessment at years 0, 3, 5, 7, 10, and 15, followed by CAC measurement in year 15. Individuals with above-average baseline risk were significantly more likely to develop coronary atherosclerosis as indicated by the presence of CAC, underscoring the importance of risk assessment in younger individuals.
Who Should Undergo CAC Screening?
The fundamental principle of preventive cardiology is that the intensity of risk-reduction measures should match the baseline risk of disease,61 so that the benefits of intervention outweigh the risks. Accordingly, the National Cholesterol Educational Programme (NCEP) Expert Panel62 recommends that individuals with multiple cardiovascular risk factors that confer a CAD risk greater than 20% in 10 years should be targeted for intensive lipid-lowering therapy, with a target LDL cholesterol level of under 100 mg/dL, similar to those with established CAD or CAD risk equivalents such as diabetes, peripheral artery disease, and symptomatic carotid artery disease. Hence, high-risk individuals should be targeted for aggressive risk-reduction measures without need for additional risk assessment tests. At the other end of the spectrum, in low-risk individuals (10-year absolute CAD risk < 10%), the likelihood of adverse cardiovascular events is too low to justify any interventions beyond simple lifestyle changes.
In individuals at intermediate risk, it is difficult to make decisions regarding the administration of risk-reduction treatments. Subclinical disease markers such as CAC imaging are most likely to be effective in this group by reclassifying them into either low- or high-risk groups, thereby influencing management decisions. In a prospective observational study,63 Greenland et al. demonstrated that asymptomatic individuals at intermediate risk according to Framingham criteria but with CAC scores above 300 had an annualized hard cardiac event rate of 2.8% (10-year absolute risk > 20%) and therefore would have to be reclassified as high-risk patients. This information would then mandate a more intensive approach to modification of risk factors, including goals for reducing LDL cholesterol. Furthermore, in low-risk (<10% over 10 years) and high-risk (>20% over 10 years) individuals, CAC measurements did not change the risk prediction substantially enough to alter their prognosis and clinical management.
As a caveat, estimation of lifetime risk of cardiovascular disease (CVD) should be considered as an adjunct to 10-year risk calculation in adults younger than 50 years of age. A significant percentage of adults younger than 50 are placed in the low-risk category for developing CVD over a 10-year period, despite a high lifetime risk of developing CVD. Estimation of lifetime risk for CVD has been elucidated by Lloyd-Jones et al. previously.64 Berry et al.65 studied 2988 subjects aged younger than 50 years at study entry into the MESA cohort and at year 15 of follow-up of the CARDIA trial, respectively, and divided them into three distinct groups. The first group was composed of subjects with low (<10%) 10-year risk of CVD and low lifetime risk (<39%) of developing CVD, the second group was composed of subjects with low 10-year risk but high lifetime risk (>39%) for CVD, and finally those with high 10-year risk or diagnosed diabetes mellitus (DM). In the cohort of subjects with low 10-year risk of CVD, those with a high lifetime risk had a significantly higher prevalence of CAC in men and women, as well as greater carotid intima media thickness. Subjects with a higher lifetime risk also showed greater CAC progression than those with lower lifetime risk. This was true for subjects in both the CARDIA and the MESA trials.
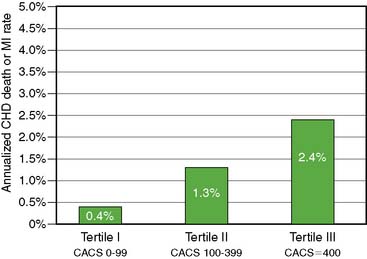
The ACC/AHA expert committee task force analysis66 of intermediate FRS patients from four studies63,67–69 reported annual CAD death/MI rates of 0.4%, 1.3%, and 2.5% for CAC score categories of less than 100, 100 to 400, and =400, respectively. This is illustrated in Figure 20-7 and reflects the discriminatory ability of CAC in this important intermediate-risk group, which represents a third of the U.S. population aged 60 years or older, according to data from the third National Health and Nutrition Examination Survey (NHANES III).70
THE PROGNOSTIC VALUE OF CAC: AVAILABLE EVIDENCE
A meta-analysis71 of 4 studies72–75 showed that CAC scores remained predictive of coronary events, even after adjustment for established cardiovascular risk factors. The event rates in individuals with even mild coronary calcification (CAC scores of 1 to 100) were twice as high compared to those with no detectable coronary calcium (RR = 2.1). CAC scores over 400 were associated with very high relative risks (RR = 4.3 to 17) after adjustment for age, sex, and other cardiovascular risk. However, the meta-analysis showed a significant heterogeneity in the quality of these studies, most of which used self-reported or historical as opposed to measured risk factor data and did not use blinded outcome adjudication, which could have overestimated the predictive accuracy of CAC measurements. Selection bias was also an issue, since most of these studies recruited self-referred or physician-referred individuals, who are not necessarily representative of the general population. Furthermore, earlier studies included “soft” endpoints, including coronary revascularization, which could have overestimated the predictive ability of CAC, since CAC results per se could influence the decision to undertake revascularization.
More recent studies have focused on the prediction of “hard” cardiac events (myocardial infarction, CAD death) and are less likely to be subjective. One such study conducted by Ostrom and colleagues76 included 2538 consecutive patients referred for CT coronary angiography. Correlation of mortality and absolute CAC score groups (1 to 9, 10 to 99, 100 to 399 and > 400) was assessed in the 1060 patients diagnosed with nonobstructive CAD. The survival rates for different CAC score groups over a follow-up period of 78 ± 12 months were 99.2%, 99%, 96.9%, and 96.1%, respectively. The risk factor adjusted RR of 5.1 (P = 0.003) and 6.2 (P = 0.001) for CAC scores of 100 to 399 and over 400, respectively, elegantly demonstrated the independent and incremental value of the CAC score.
A recent meta-analysis reported as part of the ACC/AHA 2007 Expert Consensus statement66 on CAC imaging included six studies63,67–69,77,78 published between 2003 and 2005, involving a total of 27,622 patients with 395 hard cardiac events. CAC score of zero was associated with a very low risk (0.4%; 49 events in 11,815 individuals) of CAD death or MI over 3 to 5 years of observation, and presence of any detectable coronary calcium increased the risk fourfold (P < 0.0001). The summary RR increased significantly in those with more severe coronary calcification (7.2 for CAC score of 400 to 1000, and 10.8 for CAC scores >1000, compared to zero CAC score), establishing a continuous graded relationship between CAC scores and risk of coronary events.
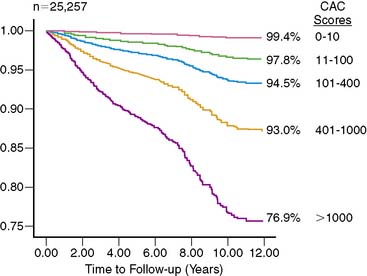
A subsequent large observational study79 published in 2007 evaluated the effect of CAC on all-cause mortality in a cohort of 25,253 patients followed for 6.8 ± 3 years. The study conclusively established the independent and incremental prognostic ability of CAC to predict all-cause mortality. The 10-year cumulative survival was 99.4% for a CAC score of zero and reduced to 87.8% for a score of over 1000 (P < 0.0001) (Fig. 20-8). ROC analysis showed a significant increase in the area under the curve when CAC score was added to risk factors and age. The improved strength and quality of available evidence were enough for the 2007 Expert Consensus Committee of the AHA/ACC to recommend CAC imaging as a reasonable choice for refining the risk stratification in asymptomatic individuals with intermediate Framingham Risk Score,66 which is a significant change from the earlier recommendation made in 2000 by the same body.80
Limitations of CAC Imaging as a Screening Tool in the General Population
For a screening program to be successful, both the disease to be screened and the screening test should satisfy certain criteria.81 The disease should be of considerable public health importance and should have a prolonged latent, preclinical stage, and early identification of preclinical patients should lead to treatments that can reduce the risk of subsequent adverse clinical events. The screening test should be practical, safe, acceptable, available, and affordable, and should accurately differentiate between high-risk and low-risk patients. CAD remains the most deadly and the also most expensive disease in most industrialized nations. Autopsy studies82 showed atherosclerotic lesions in men in their 20s and 30s, indicating a long subclinical asymptomatic stage. Studies have consistently shown that institution of aggressive risk-reduction treatments in high-risk asymptomatic individuals is associated with a significant reduction in mortality and morbidity. Although CAD appears to be an ideal disease for screening, CAC imaging as a universal screening test for CAD has certain limitations.
Although CAC imaging is a safe, noninvasive test and generally acceptable, currently its availability is limited, especially outside the United States. The current cost of a CAC scan (approximately $500 per scan)83 makes it a relatively expensive test for screening the general population. Also, it involves exposure to radiation, which, though very low for an individual patient, might have consequences when applied in the general population.84 Perhaps the most important limitation for CAC screening is its limited ability to accurately differentiate between individuals who are likely to have events from those who will not.85 In most of the outcome analysis studies performed to date, in spite of the positive correlation between CAC scores and likelihood of events, 85% to 95% of those with high CAC scores remained event free over 2 to 7 years of follow-up, and absence of coronary calcium did not always preclude events.86 Calcium is just one of the components of the atherosclerotic plaque and tends to develop late in the natural course of an individual plaque. Thus a CAC score of zero, though it may indicate a low risk of coronary events, by no means excludes the possibility of acute coronary events, since such events can result from the rupture of plaques that have not yet calcified or accumulated enough calcium to exceed the threshold for detection by Agatston method. The study by Cheng and colleagues87 showed that 6.5% of patients with zero CAC had evidence of noncalcified coronary plaque on CT angiography, though only a small minority (0.5%) had evidence of significant (= 50%) luminal stenosis.
When individuals were stratified according to FRS, CAC results did not cause substantial change in treatment targets in low- and high-risk groups.63 Also, there are no prospective data to show that the use of CAC screening can reduce CAD-associated mortality and morbidity. Therefore, even after a cumulative experience of nearly 400,000 patient years of observation in various prospective and observational studies, CAC is not approved as a screening tool for CAD in the general population, unlike other established screening strategies for abdominal aortic aneurysm,88 colon cancer, and breast cancer.89,90
Role of CAC Imaging in the Diagnosis of CAD in Symptomatic Patients
Several studies evaluating the role of CAC imaging in the diagnosis of symptomatic patients with suspected CAD reported reasonable diagnostic accuracy, with the cutoff CAC score chosen in a particular study determining the relative sensitivity and specificity. The 2000 ACC/AHA Expert Consensus document80 on EBCT reported a meta-analysis of 16 studies32,36,91–104 published before 1999, involving a total of 3683 patients without prior CAD who underwent EBCT and diagnostic angiography. The weighted average sensitivity and specificity were 80.4% and 39.9%, respectively. For non-zero CAC scores, the summary odds of having significant obstructive CAD elevated 20-fold. However, there was heterogeneity in the included studies in terms of the use coronary calcium score thresholds, patient entry criteria, and angiographic stenosis thresholds to define significant obstructive CAD. Subsequent studies established the ability of CAC scoring to improve diagnostic discrimination over conventional risk factors in the identification of patients with angiographic coronary disease.105–110
Haberl et al. studied 1764 patients with suspected CAD from a single center.107 CAC score greater than 0 Au had very high sensitivity (99% in men and 100% in women) and negative predictive value (97% in men and 100% in women) in detecting the equivalent of 50% angiographic stenosis. However, the specificity was poor (23% in men and 40% in women), and the positive predictive value was moderate (62% in men and 66% in women). Importantly, in the absence of detectable coronary calcium, angiographically significant stenosis was a rare finding, even in the presence of symptoms (n = 5, of whom only 2 patients needed intervention). There was no evidence of coronary calcium in 11% of men and 22% of women with high pretest probability of CAD. Calcium scoring can therefore identify a subset of patients with a very low risk of significant CAD in whom invasive diagnostic procedures may be omitted; it can thus act as a potential gatekeeper before more invasive tests. In another large multicenter trial, Budoff and colleagues evaluated 1851 patients who underwent angiography for clinical indications.108 The overall sensitivity and specificity of non-zero CAC score to predict obstructive CAD were 95% and 40%, respectively. Increasing the cutoff CAC score to 20, 80, and 100 Au decreased the sensitivity to 90%, 79%, and 76%, whereas the specificity increased to 58%, 72%, and 75%, respectively. CAC scores demonstrated independent and incremental power to predict obstructive CAD when added to age and sex (area under the curve increased from 0.67 to 0.84; P < 0.001). CAC scores, when added to clinically derived pretest probabilities, dramatically changed the posttest probability of obstructive coronary disease across a wide range of patients; the greatest change was noted in patients with intermediate (20% to 70%) pretest probabilities. These earlier studies were subjected to verification bias, which could increase sensitivity and reduce specificity.
In a more recent large, angiographically correlated study109
Stay updated, free articles. Join our Telegram channel

Full access? Get Clinical Tree


